. 2016 May 27:6:27004.
doi: 10.1038/srep27004.

Mechanism of impaired microtubule-dependent peroxisome trafficking and oxidative stress in SPAST-mutated cells from patients with Hereditary Spastic Paraplegia

Affiliations

Mechanism of impaired microtubule-dependent peroxisome trafficking and oxidative stress in SPAST-mutated cells from patients with Hereditary Spastic Paraplegia

Gautam Wali et al. Sci Rep. .

Abstract

Hereditary spastic paraplegia (HSP) is an inherited neurological condition that leads to progressive spasticity and gait abnormalities. Adult-onset HSP is most commonly caused by mutations in SPAST, which encodes spastin a microtubule severing protein. In olfactory stem cell lines derived from patients carrying different SPAST mutations, we investigated microtubule-dependent peroxisome movement with time-lapse imaging and automated image analysis. The average speed of peroxisomes in patient-cells was slower, with fewer fast moving peroxisomes than in cells from healthy controls. This was not because of impairment of peroxisome-microtubule interactions because the time-dependent saltatory dynamics of movement of individual peroxisomes was unaffected in patient-cells. Our observations indicate that average peroxisome speeds are less in patient-cells because of the lower probability of individual peroxisome interactions with the reduced numbers of stable microtubules: peroxisome speeds in patient cells are restored by epothilone D, a tubulin-binding drug that increases the number of stable microtubules to control levels. Patient-cells were under increased oxidative stress and were more sensitive than control-cells to hydrogen peroxide, which is primarily metabolised by peroxisomal catalase. Epothilone D also ameliorated patient-cell sensitivity to hydrogen-peroxide. Our findings suggest a mechanism for neurodegeneration whereby SPAST mutations indirectly lead to impaired peroxisome transport and oxidative stress.


Figures
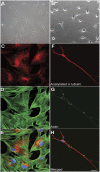
Figure 1
Figure 1. Axon-like processes induced by neuronal differentiation of ONS cells.
(A) Phase-contrast image of control ONS cells in normal growth medium. (B) Phase contrast image of control ONS cells grown in cytochalasin (D) neuron-induction medium to generate immature neurons with axon-like processes. (C–E) The same field of undifferentiated ONS cells labelled with an antibody to acetylated α-tubulin (red, C) and phalloidin labelling of actin (green, D), and merged with nuclei labelled with DAPI (blue, E). (F–H) The same field showing a differentiated cell labelled with an antibody to acetylated α-tubulin (red, F) and phalloidin labelling of actin (green, G), and merged with nuclei labelled with DAPI (blue, H). In ONS cells microtubules and actin filaments overlap. Differentiated cells have microtubules but the actin filaments are depleted. Scale bar in (B) applies to (A,B) 100 μm. Scale bar in (H) applies to (C–H) 20 μm.
Figure 2
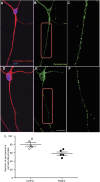
Figure 2. Reduced peroxisome number in axon-like processes of differentiated patient cells.
(A) Control differentiated cells immunostained with an antibody to acetylated α-tubulin (red), and DAPI to label nuclei (blue). (B) The same cell immunostained with an antibody to the peroxisomal membrane protein PEX14 (green). (C) Higher magnification view of the boxed area in (B), showing the individual peroxisomes in axon-like process. (D) Patient differentiated cell immunostained with an antibody to acetylated α-tubulin (red), and with DAPI (blue). (E) The same cell immunostained with an antibody to PEX14 (green). (F) Higher magnification view of the boxed area in (E), showing the individual peroxisomes in the axon-like process. Scale bar in E applies to (A,B,D,E) 20 μm. (G) Peroxisome numbers were quantified along 100 μm of axon-processes starting 20 μm from cell body (example shown in C,F). 4022 peroxisomes were quantified from 50 axon-like processes of 5 control cell lines and 2903 peroxisomes were quantified from 50 axon-like processes of 5 patient cell lines. Average numbers of peroxisomes/axon-process of all patient cell lines (solid circles) were compared to all control cell lines (open circles). N = 5 cell lines per group; unpaired t-test; two tailed; p-value: 0.0052; t = 3.808 df = 8. Data are represented as Mean ± SEM.
Figure 3
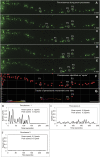
Figure 3. Automated analysis of peroxisome movement along axon-like processes.
(A–E) Images from a time-lapse movie of a control axon-like process at the times indicated. GFP-labelled peroxisomes are evident (green dots). Three example peroxisomes (P1-P3, circled) indicate peroxisomes moving different distances during the four minutes. (F) The computer-generated representation of the peroxisomes in the image shown in A (red dots). (G) The computer-generated tracks of movement of P1-P3 assessed from successive 2 second images over the 4 minute observation period. Scale bar in (G) applies to (A–G) 10 μm. (H–J) The speed of peroxisome movement was plotted against time for the three identified peroxisomes. At this time scale, peroxisome movement was characterised by saltatory movement with bursts of movement separated by rest periods. The fastest moving peroxisomes were characterised by multiple fast saltatory movements with rest periods, as for peroxisome P1. The majority of peroxisomes moved either like peroxisome P2, with multiple slow saltatory movements characterised as Brownian-like motion, or were immobile like peroxisome P3.
Figure 4
Figure 4. Time-dependent dynamics of peroxisome movement.
(A) Example of saltatory movements of a single peroxisome from a patient axon-like process, with speed plotted against time. Saltatory events were defined as those exceeding a threshold (dashed line at 0.1 μm/s). Five saltatory events are indicated. (B) Saltatory events were quantified from approximately 200 fast moving peroxisomes from patient and control axon-like processes. Data are represented as Mean ± SEM. Fast moving peroxisomes were defined as those exceeding the average speed of the fastest 10% of control peroxisomes (1.4 μm/s).
Figure 5
Figure 5. Reduced numbers of fast moving peroxisomes in patient cell axon-like processes.
(A,B) Frequency distributions of peroxisome speeds in populations of peroxisomes from control (A; N = 2837 peroxisomes from 50 axon-like processes of 5 control cell lines) and patient axon-like processes (B; N = 2023 peroxisomes from 50 axon-like processes of 5 patient cell lines). The red dotted lines indicate the 10th, 25th, 50th, 75th and 90th percentiles of the frequency distribution. Compared to the control peroxisomes, the frequency distribution of the patient peroxisomes is shifted to the left, indicating a shift to more slowly moving peroxisomes. (C) Quantile regression analysis of the frequency distributions, showing a significant reduction at all percentiles in mean peroxisome speeds in patient cells (HSP) compared to control cells. For inter-percentile comparisons the patient-control difference (β), standard error (SE), significance (p-value) and 95% confidence interval (CI) values are shown. (N = 2837 peroxisomes from 50 control axon-like processes of 5 control cell lines and 2023 peroxisomes from 50 control axon-like processes of 5 control cell lines). (D) Mean speeds of peroxisomes travelling along patient and control axon-like processes. 2837 peroxisomes from 50 control axon-like processes of 5 control cell lines and 2023 peroxisomes from 50 control axon-like processes of 5 control cell lines were analysed. Average mean speeds of peroxisomes of all patient cell lines (solid circles) were compared to all control cell lines. N = 5 cell lines per group. Unpaired t-test; two tailed; p-value: 0.0064; t = 3.663 df = 8. Data are represented as Mean ± SEM. (E) Average percentage of fast moving peroxisomes of all patient cell lines (solid circles) were compared to all control cell lines (open circles). N = 5 cell lines per group. Unpaired t-test; two tailed; p-value: 0.0041; t = 3.975 df = 8. Data are represented as Mean ± SEM.
Figure 6
Figure 6. Patient cells were under oxidative stress.
(A,B) Control (A) and patient (B) ONS cells (cytoplasm, red, Cell mask; nucleus, DAPI, blue). (C,D) Control (C) and patient (D) ONS cells immunostained for the oxidative stress marker (4HNE, green). (E) 4HNE fluorescence in cells cultured under baseline conditions (Control, Patient) and 1 hour after 50 μm hydrogen peroxide (Control + H2O2, Patient + H2O2). N = 1977 control cells at baseline; 1027 control cells post H2O2 exposure; 2022 patient cells at baseline and 1003 patient cells post H2O2 exposure. Average 4HNE fluorescence values of all patient cell lines (solid circles) were compared to all control cell lines (open circles). The fluorescence intensity was significantly different among the groups (repeated measures ANOVA; control v/s patient: p = 0.002; effect of hydrogen peroxide: p < 0.001 and interaction between disease status and treatment: p = 0.042). (F) Quantification of cell viability with MTS assay. Average cell viability values measured by MTS assay for all patient cell lines (solid circles) were compared to all control cell lines (open circles). N = 5 cell lines per group. Unpaired t-test; two tailed; p-value: 0.0429; t = 2.404 df = 8. Data are represented as Mean ± SEM. (G) Quantification of ATP production with ATPlite assay. Average ATP values measured by ATPlite assay for all patient cell lines (solid circles) were compared to all control cell lines (open circles). N = 5 cell lines per group. Unpaired t-test; two tailed; p-value: 0.0336; t = 2.562 df = 8. Data are represented as Mean ± SEM.
Figure 7
Figure 7. Epothilone D ameliorated hydrogen peroxide-induced oxidative stress in patient cells.
4HNE fluorescence in cells (control and patient) cultured under normal culture conditions; exposed to H2O2 and treated with 2 nM epothilone D for 7 days and then exposed to H2O2. N = 1204 control cells under normal culture conditions; 1402 control cells exposed to H2O2; 1066 control cells treated with epothilone D and exposed to H2O2; 1178 patient cells under normal culture conditions; 1209 patient cells exposed to H2O2 and 1013 patient cells treated with epothilone D and exposed to H2O2. The fluorescence intensity was significantly different among the groups (repeated measures ANOVA; control v/s patient: p = 0.024; main effect of treatment (both H2O2 and epothilone D): p = 0.008; disease status and treatment: p = 0.007).
Figure 8
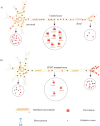
Figure 8. Model for oxidative stress linked to peroxisome trafficking.
In healthy axons an adequate microtubule network allows normal numbers of peroxisomes to travel at normal speeds in anterograde and retrograde directions (A: large circle). In SPAST-mutated axons the reduced microtubule network reduces the number of peroxisomes causing fewer peroxisomes to travel more slowly, with a larger effect on retrograde transport (B: large circle). In healthy neurons the peroxisome transport is enough to assure normal peroxisome distributions in cell body and distal axon and appropriate redox state (A: small circles). In SPAST-mutated neurons impaired peroxisome transport causes a build-up of peroxisomes at the distal end of the axon, with reduced peroxisome turnover at the cell body leading to oxidative stress (B: small circles).

Similar articles

Cited by

References

    1. Salinas S., Proukakis C., Crosby A. & Warner T. Hereditary spastic paraplegia: clinical features and pathogenetic mechanisms. Lancet neurology 7, 1127–1138, 10.1016/S1474-4422(08)70258-8 (2008). - DOI - PubMed
    1. Vandebona H., Kerr N., Liang C. & Sue C. SPAST mutations in Australian patients with hereditary spastic paraplegia. Internal medicine journal 42, 1342–1347, 10.1111/j.1445-5994.2012.02941.x (2012). - DOI - PubMed
    1. Agosta F. et al. Hereditary Spastic Paraplegia: Beyond Clinical Phenotypes toward a Unified Pattern of Central Nervous System Damage. Radiology 0, 141715, 10.1148/radiol.14141715. - DOI - PubMed
    1. Duning T. et al. Specific pattern of early white-matter changes in pure hereditary spastic paraplegia. Movement disorders: official journal of the Movement Disorder Society 25, 1986–1992, 10.1002/mds.23211 (2010). - DOI - PubMed
    1. Warnecke T. et al. A novel form of autosomal recessive hereditary spastic paraplegia caused by a new SPG7 mutation. Neurology 69, 368–375, 10.1212/01.wnl.0000266667.91074.fe (2007). - DOI - PubMed

Publication types

MeSH terms

LinkOut - more resources