Identification of intestinal ion transport defects in microvillus inclusion disease
- PMID: 27229121
- PMCID: PMC4967175
- DOI: 10.1152/ajpgi.00041.2016
Identification of intestinal ion transport defects in microvillus inclusion disease
Abstract
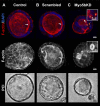
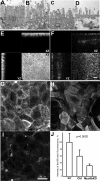
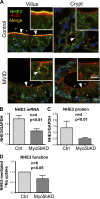
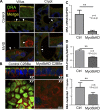
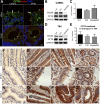
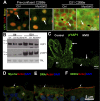
Loss of function mutations in the actin motor myosin Vb (Myo5b) lead to microvillus inclusion disease (MVID) and death in newborns and children. MVID results in secretory diarrhea, brush border (BB) defects, villus atrophy, and microvillus inclusions (MVIs) in enterocytes. How loss of Myo5b results in increased stool loss of chloride (Cl(-)) and sodium (Na(+)) is unknown. The present study used Myo5b loss-of-function human MVID intestine, polarized intestinal cell models of secretory crypt (T84) and villus resembling (CaCo2BBe, C2BBe) enterocytes lacking Myo5b in conjunction with immunofluorescence confocal stimulated emission depletion (gSTED) imaging, immunohistochemical staining, transmission electron microscopy, shRNA silencing, immunoblots, and electrophysiological approaches to examine the distribution, expression, and function of the major BB ion transporters NHE3 (Na(+)), CFTR (Cl(-)), and SLC26A3 (DRA) (Cl(-)/HCO3 (-)) that control intestinal fluid transport. We hypothesized that enterocyte maturation defects lead villus atrophy with immature secretory cryptlike enterocytes in the MVID epithelium. We investigated the role of Myo5b in enterocyte maturation. NHE3 and DRA localization and function were markedly reduced on the BB membrane of human MVID enterocytes and Myo5bKD C2BBe cells, while CFTR localization was preserved. Forskolin-stimulated CFTR ion transport in Myo5bKD T84 cells resembled that of control. Loss of Myo5b led to YAP1 nuclear retention, retarded enterocyte maturation, and a cryptlike phenotype. We conclude that preservation of functional CFTR in immature enterocytes, reduced functional expression of NHE3, and DRA contribute to Cl(-) and Na(+) stool loss in MVID diarrhea.
Keywords: CFTR; MVI; MVID; Myo5b; NHE3; brush border.
Figures


Similar articles
-
Loss of MYO5B Leads to Reductions in Na+ Absorption With Maintenance of CFTR-Dependent Cl- Secretion in Enterocytes.Gastroenterology. 2018 Dec;155(6):1883-1897.e10. doi: 10.1053/j.gastro.2018.08.025. Epub 2018 Aug 23. Gastroenterology. 2018. PMID: 30144427 Free PMC article.
-
Editing Myosin VB Gene to Create Porcine Model of Microvillus Inclusion Disease, With Microvillus-Lined Inclusions and Alterations in Sodium Transporters.Gastroenterology. 2020 Jun;158(8):2236-2249.e9. doi: 10.1053/j.gastro.2020.02.034. Epub 2020 Feb 26. Gastroenterology. 2020. PMID: 32112796 Free PMC article.
-
Myosin 5b loss of function leads to defects in polarized signaling: implication for microvillus inclusion disease pathogenesis and treatment.Am J Physiol Gastrointest Liver Physiol. 2014 Nov 15;307(10):G992-G1001. doi: 10.1152/ajpgi.00180.2014. Epub 2014 Sep 25. Am J Physiol Gastrointest Liver Physiol. 2014. PMID: 25258405 Free PMC article.
-
An overview and online registry of microvillus inclusion disease patients and their MYO5B mutations.Hum Mutat. 2013 Dec;34(12):1597-605. doi: 10.1002/humu.22440. Epub 2013 Oct 16. Hum Mutat. 2013. PMID: 24014347 Review.
-
Altered MYO5B Function Underlies Microvillus Inclusion Disease: Opportunities for Intervention at a Cellular Level.Cell Mol Gastroenterol Hepatol. 2022;14(3):553-565. doi: 10.1016/j.jcmgh.2022.04.015. Epub 2022 Jun 1. Cell Mol Gastroenterol Hepatol. 2022. PMID: 35660026 Free PMC article. Review.
Cited by
-
125 Iodide as a surrogate tracer for epithelial chloride transport by the mouse large intestine in vitro.Exp Physiol. 2019 Mar;104(3):334-344. doi: 10.1113/EP087445. Epub 2019 Jan 25. Exp Physiol. 2019. PMID: 30615234 Free PMC article.
-
A V0-ATPase-dependent apical trafficking pathway maintains the polarity of the intestinal absorptive membrane.Development. 2019 Jun 5;146(11):dev174508. doi: 10.1242/dev.174508. Development. 2019. PMID: 31110027 Free PMC article.
-
Modeling the cell biology of monogenetic intestinal epithelial disorders.J Cell Biol. 2024 Jul 1;223(7):e202310118. doi: 10.1083/jcb.202310118. Epub 2024 Apr 29. J Cell Biol. 2024. PMID: 38683247 Free PMC article. Review.
-
The Hippo Pathway Is Essential for Maintenance of Apicobasal Polarity in the Growing Intestine of Caenorhabditis elegans.Genetics. 2019 Oct;213(2):501-515. doi: 10.1534/genetics.119.302477. Epub 2019 Jul 29. Genetics. 2019. PMID: 31358532 Free PMC article.
-
Recent advances in understanding and managing malabsorption: focus on microvillus inclusion disease.F1000Res. 2019 Dec 5;8:F1000 Faculty Rev-2061. doi: 10.12688/f1000research.20762.1. eCollection 2019. F1000Res. 2019. PMID: 31824659 Free PMC article. Review.
References
-
- Ameen N, Alexis J, Salas P. Cellular localization of the cystic fibrosis transmembrane conductance regulator in mouse intestinal tract. Histochem Cell Biol 114: 69–75, 2000. - PubMed
-
- Ameen NA, Ardito T, Kashgarian M, Marino CR. A unique subset of rat and human intestinal villus cells express the cystic fibrosis transmembrane conductance regulator. Gastroenterology 108: 1016–1023, 1995. - PubMed
-
- Ameen NA, Marino C, Salas PJ. cAMP-dependent exocytosis and vesicle traffic regulate CFTR and fluid transport in rat jejunum in vivo. Am J Physiol Cell Physiol 284: C429–C438, 2003. - PubMed
-
- Ameen NA, Salas PJ. Microvillus inclusion disease: a genetic defect affecting apical membrane protein traffic in intestinal epithelium. Traffic 1: 76–83, 2000. - PubMed
MeSH terms
Substances
Supplementary concepts
Grants and funding
LinkOut - more resources
Full Text Sources
Other Literature Sources
Medical

