. 2016 May 25;36(21):5709-23.
doi: 10.1523/JNEUROSCI.4366-15.2016.

Optogenetic Visualization of Presynaptic Tonic Inhibition of Cerebellar Parallel Fibers

Affiliations

Optogenetic Visualization of Presynaptic Tonic Inhibition of Cerebellar Parallel Fibers

Ken Berglund et al. J Neurosci. .

Abstract

Tonic inhibition was imaged in cerebellar granule cells of transgenic mice expressing the optogenetic chloride indicator, Clomeleon. Blockade of GABAA receptors substantially reduced chloride concentration in granule cells due to block of tonic inhibition. This indicates that tonic inhibition is a significant contributor to the resting chloride concentration of these cells. Tonic inhibition was observed not only in granule cell bodies, but also in their axons, the parallel fibers (PFs). This presynaptic tonic inhibition could be observed in slices both at room and physiological temperatures, as well as in vivo, and has many of the same properties as tonic inhibition measured in granule cell bodies. GABA application revealed that PFs possess at least two types of GABAA receptor: one high-affinity receptor that is activated by ambient GABA and causes a chloride influx that mediates tonic inhibition, and a second with a low affinity for GABA that causes a chloride efflux that excites PFs. Presynaptic tonic inhibition regulates glutamate release from PFs because GABAA receptor blockade enhanced both the frequency of spontaneous EPSCs and the amplitude of evoked EPSCs at the PF-Purkinje cell synapse. We conclude that tonic inhibition of PFs could play an important role in regulating information flow though cerebellar synaptic circuits. Such cross talk between phasic and tonic signaling could be a general mechanism for fine tuning of synaptic circuits.

Significance statement: This paper demonstrates that an unconventional form of signaling, known as tonic inhibition, is found in presynaptic terminals and affects conventional synaptic communication. Our results establish the basic characteristics and mechanisms of presynaptic tonic inhibition and show that it occurs in vivo as well as in isolated brain tissue.

Keywords: GABA; cerebellum; chloride; imaging; parallel fibers; tonic inhibition.


Conflict of interest statement

The authors declare no competing financial interests.

Figures
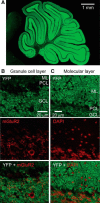
Figure 1.
Figure 1.
Exclusive expression of Clomeleon in granule cells in the cerebellum. A, A parasagittal section of the entire cerebellum from Clomeleon transgenic mouse line 1, showing YFP fluorescence from Clomeleon in granule cells. Both the ML and GCL are fluorescent due to the presence of Clomeleon in GCBs/dendrites and PFs. Note the absence of YFP fluorescence in the Purkinje cell layer (PCL) in between as Purkinje cell bodies do not express Clomeleon. B, Immunostaining against Clomeleon (top) and mGluR2 (middle) in the GCL. The lack of overlap of the two signals indicates exclusive expression of Clomeleon in GCBs in the GCL (bottom). C, Immunostaining against Clomeleon (top) and nuclear staining with DAPI (middle) in the ML. The lack of overlap of the two signals indicates exclusive expression of Clomeleon in PFs within the ML (bottom).
Figure 2.
Figure 2.
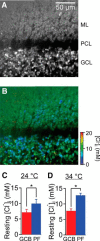
Measuring [Cl]i in granule cells via 2-photon microscopy. A, An image of YFP fluorescence in the cerebellar cortex. B, Resting [Cl]i of granule cells, determined from the ratio of YFP/CFP fluorescence emission. C, Mean resting [Cl]i in GCBs and PFs. Error bars indicate SEM in this and subsequent figures (n = 24). D, Mean resting [Cl]i of granule cells at more physiological temperature (n = 7). *p = 0.016 (two-tailed Wilcoxon paired-sample test).
Figure 3.
Figure 3.
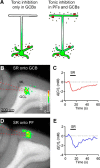
Tonic inhibition of granule cells. A, Reduction in [Cl]i produced throughout the cerebellar cortex by bath application of SR (10 μm). Image was obtained with a wide-field microscope. B, C, Time course of [Cl]i changes in the two compartments of granule cells, GCBs (B) and PFs (C), in response to SR application. D, Mean changes in resting [Cl]i produced by SR application (n = 11). E, Mean changes in [Cl]i at more physiological temperature (n = 7).
Figure 4.
Figure 4.
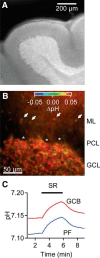
pH measurements in the cerebellar granule cells. A, A SNARF-5F-loaded cerebellar slice. Emission at 630 nm. B, Global alkalization in the cerebellar cortex was seen when SR (10 μm) was applied in the bath. A part of the cerebellar cortex was imaged with the 40 × objective lens. ML interneurons were loaded as well (arrows). Note the lack of SNARF-5F loading in Purkinje cells (*). Image was integrated over the last minute of SR application. C, Time courses of intracellular pH changes following SR application in the two compartments of granule cells, GCBs and PFs. Traces represent averages of 12 experiments.
Figure 5.
Figure 5.
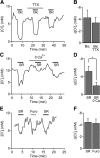
Properties of tonic inhibition of PFs. A, TTX (1 μm) did not change basal [Cl]i in PFs or block the changes in [Cl]i produced by bicuculline (Bic; 20 μm). B, Mean changes in resting [Cl]i of PFs produced by application of bicuculline alone (Bic) or by bicuculline in the presence of TTX (Bic TTX; n = 6). C, Treatment of cerebellar slices with Ca2+-free extracellular solution increased basal [Cl]i in PFs but did not block the response of PFs to SR (10 μm). D, Mean changes in resting [Cl]i of PFs produced by application of SR in normal saline (SR) and in the absence of Ca2+ (SR 0 Ca; n = 9). * p < 0.05 (Wilcoxon test). E, [Cl]i of PFs was reduced by SR as well as by furosemide (Furo; 100 μm). F, Mean changes in resting [Cl]i produced by application of SR or furosemide (n = 7).
Figure 6.
Figure 6.
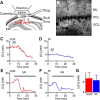
Tonic inhibition in vivo. A, Diagram of experimental arrangement for in vivo imaging experiment. Red line indicates a representative focal plane when imaging [Cl]i in the fourth and fifth lobule of the cerebellum (4 and 5). B, Two-photon microscopy image of YFP fluorescence obtained from the location shown in A. C, D, Time courses of [Cl]i changes in response to subcutaneous injection of SR (5 mg/kg body weight). C, D, Obtained in GCBs and PFs, respectively. E, F, Time courses of [Cl]i changes in response to topical application of SR (2 mm). E, [Cl]i changes in GCB. F, [Cl]i changes in PFs. G, Mean changes in resting [Cl]i produced by SR application (n = 7; combined results of topical and subcutaneous applications).
Figure 7.
Figure 7.
Tonic activation of GABAA receptors on PFs. A, Two possible models for tonic inhibition of PFs in granule cells. Left, [Cl]i in PFs may be raised by diffusion of Cl that enters via GABAA receptors in GCBs/dendrites. Right, PFs may have GABAA receptors that are tonically active. B, [Cl]i response to SR (100 μm for 10 s) locally applied from a puff pipette (dotted lines) onto GCBs. C, Time course of the response shown in B. A transient decrease in [Cl]i was produced in GCBs near the pipette. D, Response to SR application onto PFs. E, Time course of the response shown in D. A similar transient reduction in [Cl]i was produced in PFs near the pipette in response to SR.
Figure 8.
Figure 8.
Depolarizing action of GABA on PFs. A, Reduction in [Cl]i in PFs produced by GABA (1 mm for 500 ms) locally applied from a pipette (dotted lines) onto the ML. B, Time course of the response shown in A. C, Local application of GABA onto the GCL elevated [Cl]i in GCBs. D, Time course of the response shown in C.
Figure 9.
Figure 9.
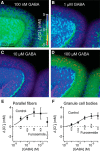
Biphasic actions of GABA on PFs. A–D, Images of changes in [Cl]i produced by bath application of GABA at the indicated concentrations. E, F, GABA dose–response curves for GCBs (E) and PFs (F). In GCBs, furosemide (100 μm) blocked the response by higher doses of GABA. Smooth curve indicates fits of the Hill equation to the data. Because of the biphasic nature of the [Cl]i changes in PFs, only data from GABA concentrations of ≤1 μm were fit, using the same Kd measured for the GCB dose–response curve (n = 6).
Figure 10.
Figure 10.
Tonic inhibition requires HCO3. A, Measurement of pH changes in PFs during HCO3 removal (acetazolamide [AZA]/HEPES/no CO2). B, HCO3 removal reduced intracellular pH in PFs significantly. *p = 0.028. C, [Cl]i changes in PFs during HCO3 removal. D, HCO3 removal reduced resting [Cl]i significantly. *p = 0.0008. E, Reduction in [Cl]i in PFs caused by SR treatment disappeared in the absence of HCO3. *p < 0.05.
Figure 11.
Figure 11.
Two types of GABAA receptors in PFs. High-affinity receptors are permeable to HCO3, with the efflux of this anion providing a positive driving force for Cl that enables persistent influx of Cl through these receptors (left). Low-affinity receptors are not permeable to HCO3, reversing the polarity of the electrochemical driving force for Cl at high GABA levels (right).
Figure 12.
Figure 12.
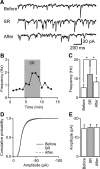
Tonic inhibition affects spontaneous transmitter release from PFs. A, Spontaneous EPSCs recorded from a Purkinje cell before, during, and after application of SR (10 μm) in the bath. SR increased the frequency of spontaneous EPSCs. B, Time course of changes in frequency of spontaneous EPSCs produced by application of SR. Results from the same experiment shown in A. C, Mean frequency of spontaneous EPSCs in the indicated conditions (n = 6). *p < 0.05, significant differences between comparisons illustrated by lines. D, Cumulative distribution of spontaneous EPSC amplitudes was unaffected by SR application (n > 7000 events for each condition from four cells). E, Mean amplitude of spontaneous EPSCs measured in the indicated conditions. Mean EPSC amplitude was not statistically different between groups (p > 0.4; paired Student's t tests; n = 6), from the same data shown in C.
Figure 13.
Figure 13.
Tonic inhibition reduces evoked transmitter release. A, EPSCs recorded from a Purkinje cell in response to electrical stimulation of PFs. Blocking tonic inhibition by bath application of SR (10 μm) increased the amplitude of EPSCs. Coapplication of glutamate receptor blockers kinurenic acid (KA; 3 mm) and CNQX (100 μm) almost completely eliminated EPSCs, revealing their glutamatergic origins. Each trace represents the average of responses to 20 stimuli. B, Time course of changes in EPSC amplitude produced by application of SR. EPSC amplitudes were normalized to the mean value measured before SR application. Points represent the means of 8 experiments. C, Mean amplitude of EPSCs in the indicated conditions (n = 9). D, EPSCs produced by paired stimuli separated by an interval of 100 ms, with responses normalized to the peak amplitude of the response to the first stimulus. Each trace represents the average of 40 trials. E, Amount of facilitation measured in the three conditions indicated (n = 9). F, Coefficient of variation (CV) of the first eEPSCs in the three conditions (n = 10). *p < 0.05 (paired Student's t test). **p < 0.01 (paired Student's t test).

Similar articles

Cited by

References

    1. Alvarez-Leefmans FJ, Delpire E. Thermodynamics and kinetics of chloride transport in neurons: an outline. In: Alvarez-Leefmans FJ, Delpire E, editors. Physiology and pathology of chloride transporters and channles in the nervous system. London: Academic; 2009. pp. 81–108.
    1. Astorga G, Bao J, Marty A, Augustine GJ, Franconville R, Jalil A, Bradley J, Llano I. An excitatory GABA loop operating in vivo. Front Cell Neurosci. 2015;9:275. doi: 10.3389/fncel.2015.00275. - DOI - PMC - PubMed
    1. Atluri PP, Regehr WG. Determinants of the time course of facilitation at the granule cell to Purkinje cell synapse. J Neurosci. 1996;16:5661–5671. - PMC - PubMed
    1. Baker BJ, Mutoh H, Dimitrov D, Akemann W, Perron A, Iwamoto Y, Jin L, Cohen LB, Isacoff EY, Pieribone VA, Hughes T, Knöpfel T. Genetically encoded fluorescent sensors of membrane potential. Brain Cell Biol. 2008;36:53–67. doi: 10.1007/s11068-008-9026-7. - DOI - PMC - PubMed
    1. Berglund K, Dunbar RL, Lee P, Feng G, Augustine GJ. Imaging synaptic inhibition with Clomeleon, a genetically encoded chloride indicator. In: Konnerth A, Lanni F, Yuste R, editors. Imaging in neuroscience and development: a laboratory manual, Ed 2. New York: Cold Spring Harbor Laboratory; 2005. pp. 495–498.

Publication types

Substances

LinkOut - more resources