. 2016 May 25:6:26742.
doi: 10.1038/srep26742.

Combinations of Oseltamivir and T-705 Extend the Treatment Window for Highly Pathogenic Influenza A(H5N1) Virus Infection in Mice

Affiliations

Combinations of Oseltamivir and T-705 Extend the Treatment Window for Highly Pathogenic Influenza A(H5N1) Virus Infection in Mice

Bindumadhav M Marathe et al. Sci Rep. .

Abstract

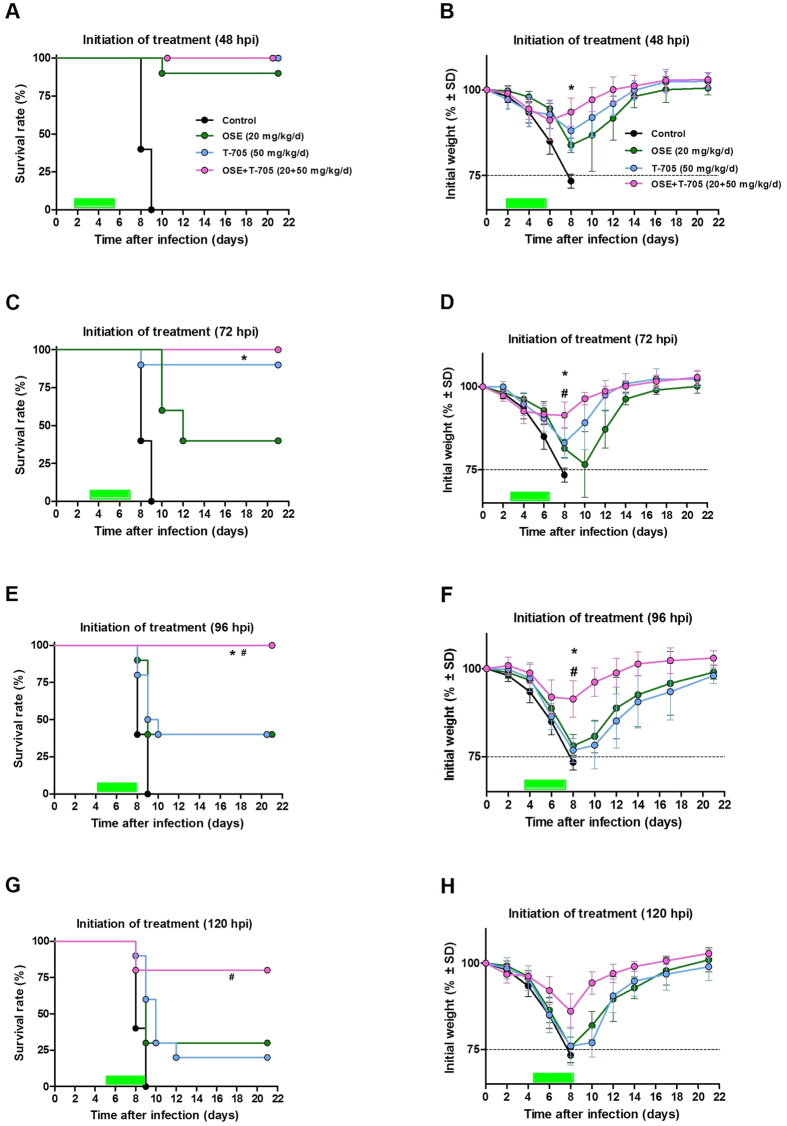
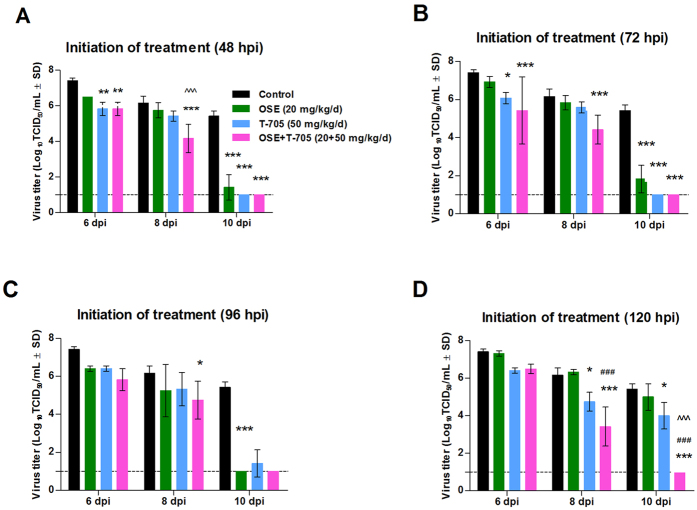
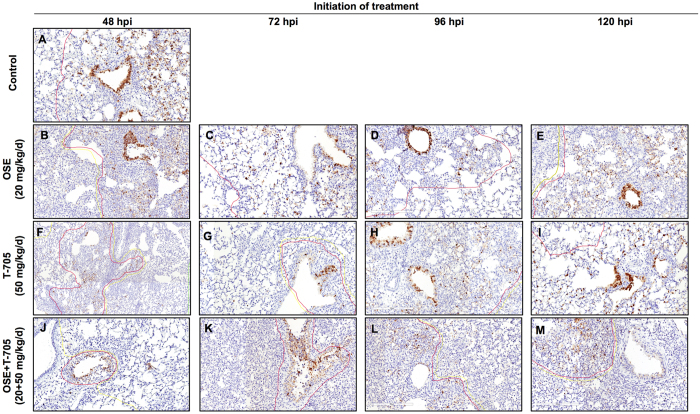
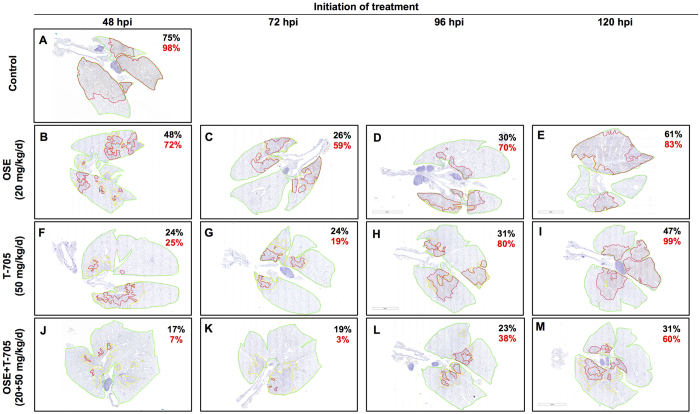
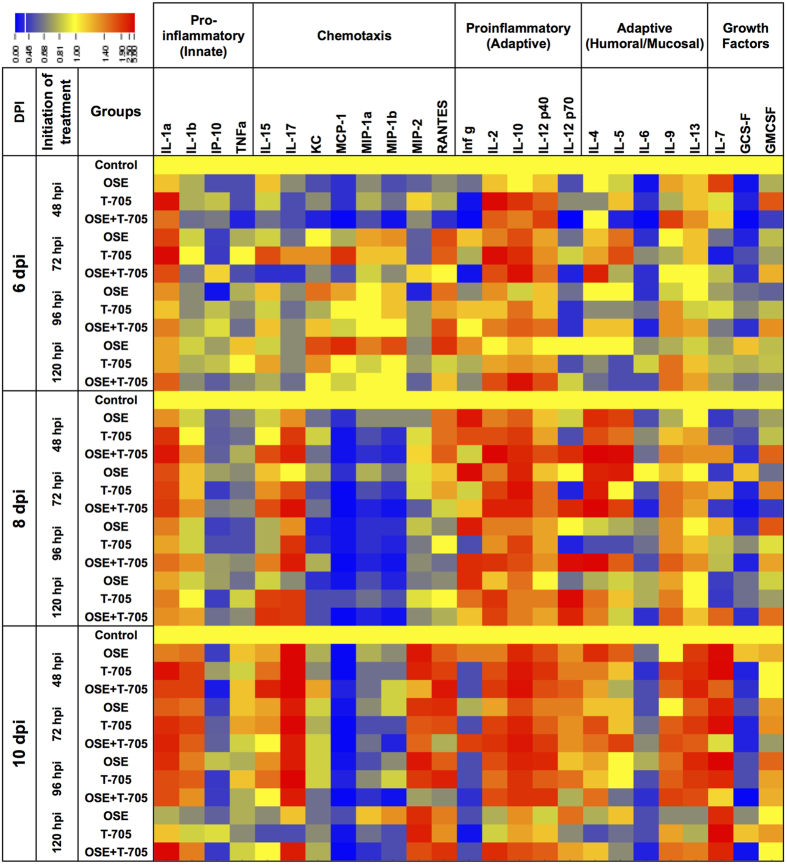
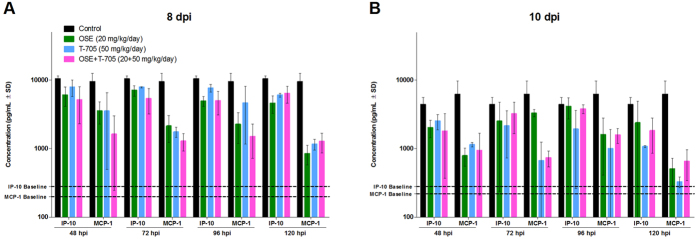
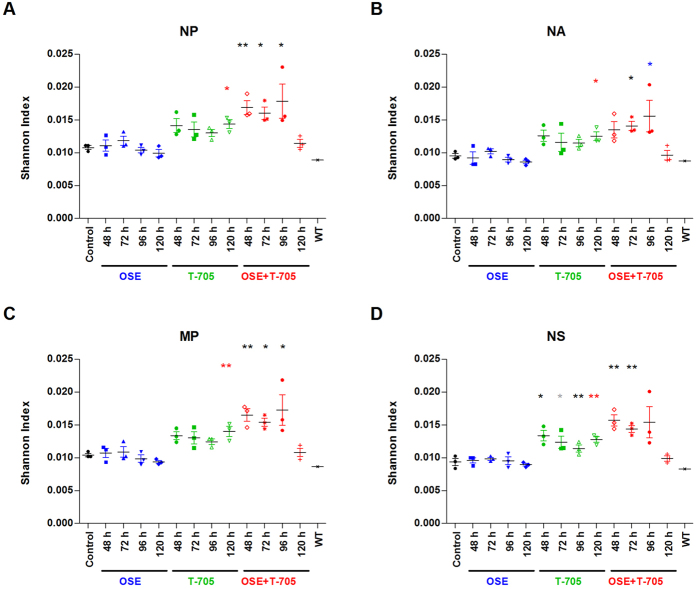
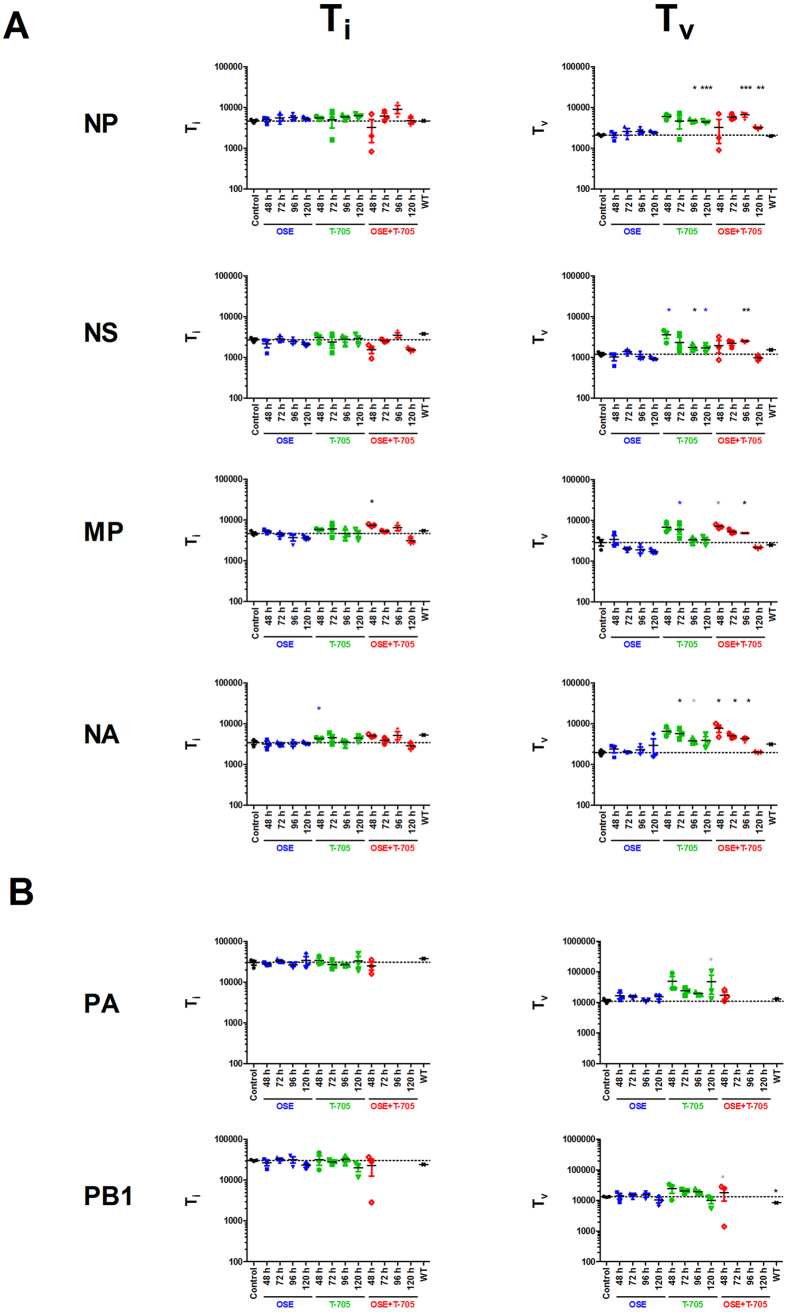
Current anti-influenza therapy depends on administering drugs soon after infection, which is often impractical. We assessed whether combinations of oseltamivir (a neuraminidase inhibitor) and T-705 (a nonspecific inhibitor of viral polymerases) could extend the window for treating lethal infection with highly pathogenic A(H5N1) influenza virus in mice. Combination therapy protected 100% of mice, even when delayed until 96 h postinoculation. Compared to animals receiving monotherapy, mice receiving combination therapy had reduced viral loads and restricted viral spread in lung tissues, limited lung damage, and decreased inflammatory cytokine production. Next-generation sequencing showed that virus populations in T-705-treated mice had greater genetic variability, with more frequent transversion events, than did populations in control and oseltamivir-treated mice, but no substitutions associated with resistance to oseltamivir or T-705 were detected. Thus, combination therapy extended the treatment window for A(H5N1) influenza infection in mice and should be considered for evaluation in a clinical setting.


Figures

Figure 1
Figure 1. Survival and weight change in A(H5N1) virus–inoculated mice treated with oseltamivir, T-705, or their combination.
Female 6- to 8-week-old BALB/c mice (n = 10/group) were lightly anesthetized with isoflurane and inoculated intranasally with 10 MLD50 of A/Turkey/15/2006 (H5N1) influenza virus. Mice were treated with oseltamivir (20 mg/kg/day), T-705 (50 mg/kg/day), or their combination starting at 48, 72, 96, or 120 hpi. The drugs were administered twice daily for 5 days by oral gavage. The green bars indicate the period of drug administration, and dotted line indicates endpoint for mortality (75% of initial weight). Control animals were treated with vehicle (water and ORA-PLUS, 1:1) on the same schedule. The graphs show the survival (A,C,E,G) and weight loss (B,D,F,H) of mice when treatment was initiated 48 (A,B), 72 (C,D), 96 (E,F), and 120 (G,H) hpi. *P < 0.05, compared between combination and oseltamivir monotherapy groups; #P < 0.05, compared between combination and T-705 monotherapy groups. Probabilities for survival were determined by log rank test and for difference in weights by 1-way ANOVA. Abbreviations: OSE, oseltamivir; OSE + T-705, oseltamivir and T-705 combination.
Figure 2
Figure 2. Lung virus titers in A(H5N1) virus–inoculated mice treated with oseltamivir (20 mg/kg/day), T-705 (50 mg/kg/day), or their combination.
BALB/c mice were treated as described in the legend for Fig. 1. Virus titers were determined in the lungs of mice (n = 3/group) at 6, 8, and 10 dpi by 50% TCID50 assays on MDCK cells. The bars represent the mean virus titers in mouse lungs when treatment was initiated 48 (A), 72 (B), 96 (C), or 120 (D) hpi. *P < 0.05; **P < 0.01; and ***P < 0.001, compared between combination and control groups; ###P < 0.001, compared between combination and oseltamivir monotherapy groups; and ^^^P < 0.001, compared between combination and T-705 monotherapy groups. Probabilities were determined by 2-way ANOVA. Abbreviations: OSE, oseltamivir; OSE + T-705, oseltamivir and T-705 combination.
Figure 3
Figure 3. Histologic changes in the lungs of A(H5N1) virus–inoculated mice treated with oseltamivir (20 mg/kg/day), T-705 (50 mg/kg/day), or their combination.
BALB/c mice were treated as described in the legend for Fig. 1. Pulmonary lesions were evaluated at 8 dpi (n = 2/group). The red lines designate areas with antigen-positive cells (active infection); the yellow lines outline areas with lesions but negligible antigen (inactive infection). In control mice (A), the lesions involved almost entire lobes and were characterized by widespread infection of bronchiolar epithelium, type II pneumocytes, and alveolar macrophages. In mice receiving oseltamivir monotherapy (B–E), active virus infection was generally restricted to airway epithelium and adjacent parenchyma (B), but when treatment was delayed until 72, 96, or 120 hpi (C–E), a broad band of infected type II pneumocytes surrounded the central lesions, which consisted of thickened septa and antigen-positive bronchioles. In mice receiving T-705 monotherapy (F–I), active virus infection was generally restricted to a few terminal airways and a narrow leading edge surrounding some lesions, but most antigen-positive cells in pulmonary lesions were only lightly stained. In mice receiving combination therapy (J–M), there was a marked reduction in both the extent of lesion development and the intensity of antigen staining. The lesions in combination therapy lungs were generally restricted to the peribronchiolar parenchyma, and antigen-positive cells were relatively uncommon and only lightly stained. Magnification, ×20. Abbreviations: OSE, oseltamivir; OSE + T-705, oseltamivir and T-705 combination.
Figure 4
Figure 4. Histomorphometry of the lung tissues of A(H5N1) virus–inoculated mice treated with oseltamivir (20 mg/kg/day), T-705 (50 mg/kg/day), or their combination.
BALB/c mice were treated as described in the legend for Fig. 1. For each mouse evaluated, one representative slide that included all the lung lobes was used. The red lines designate areas with antigen-positive cells (active infection); the yellow lines outline areas with lesions but negligible antigen (inactive infection). The total lesion area (active and inactive infection) is indicated as the percentage of the total lung field examined and is shown in black, and active infection is indicated as the percentage of the total lesion area and is shown in red. In control mice (A), active infection (indicated as a percentage) was extensive throughout the lungs. In mice treated with either oseltamivir (B–E) or T-705 (F–I) monotherapy, the extent of pulmonary lesions was less than in controls. When initiated at 48 or 72 hpi, T-705 therapy (F,G) was more effective than oseltamivir therapy (B,C). Combination therapy markedly reduced the extent of pulmonary lesions at all assessed time points (J–M). Magnification, ×2. Abbreviations: OSE, oseltamivir; OSE + T-705, oseltamivir and T-705 combination.
Figure 5
Figure 5. Pattern of cytokine and chemokine production in the lungs of A(H5N1) virus–inoculated mice treated with oseltamivir (20 mg/kg/day), T-705 (50 mg/kg/day), or their combination.
BALB/c mice were treated as described in the legend for Fig. 1. Twenty-five cytokines and chemokines were assayed in lung homogenates (n = 3/group) at 6, 8, and 10 dpi by using a MYCTOMAG-70K-PMX MILLIPLEX® MAP mouse cytokine/chemokine panel (Millipore). The concentration of each cytokine/chemokine tested was normalized to that for control A(H5N1) virus-infected animals (shown in yellow). The fold changes in the concentration of each cytokine or chemokine ranged from 0.00 (shown in blue) to 3.00 (shown in red). Abbreviations: OSE, oseltamivir; OSE + T-705, oseltamivir and T-705 combination.
Figure 6
Figure 6. Levels of IP-10 and MCP-1 in the lungs of A(H5N1) virus–inoculated mice treated with oseltamivir (20 mg/kg/day), T-705 (50 mg/kg/day), or their combination.
BALB/c mice were treated as described in the legend for Fig. 1. The concentrations of IP-10 and MCP-1 in lung homogenates (n = 3/group) at 6, 8, and 10 dpi were determined using a MYCTOMAG-70K-PMX MILLIPLEX® MAP mouse cytokine/chemokine panel (Millipore). The bars indicate the mean concentration of IP-10 and MCP-1 (pg/mL) ± SD. The dashed lines indicate the chemokine concentrations in mock-infected mice. All treatment regimens significantly reduced (P < 0.01) the production of IP-10 and MCP-1, as compared to that in control mice, at 8 and 10 dpi when tested by 2-way ANOVA. Abbreviations: IP-10, inducible protein; MCP-1, monocyte chemotactic protein 1.
Figure 7
Figure 7. Virus population diversity in the lungs of A(H5N1) virus–inoculated mice treated with oseltamivir (20 mg/kg/day), T-705 (50 mg/kg/day), or their combination.
BALB/c mice were treated as described in the legend for Fig. 1. The virus population diversity in the lung homogenates (n = 3/group) at 8 dpi was represented by the Shannon Entropy Index (SNT) obtained from the nucleotide deep-sequencing data for the following influenza genes: NP (A), NA (B), MP (C), and NS (D). *P < 0.05; **P < 0.01, and ***P < 0.001 when tested by 1-way ANOVA. Black * represents statistical significance when compared to control and oseltamivir, red * represents statistical significance when compared to control, oseltamivir, and combination group, blue * represents statistical significance when compared to oseltamivir, and gray * is significant only against control animals. Abbreviations: OSE, oseltamivir; OSE + T-705, oseltamivir and T-705 combination; NP, nucleoprotein; NA, neuraminidase; MP, matrix; WT, wild-type virus used for inoculation of mice.
Figure 8
Figure 8. Mutational profile of the virus population in the lungs of A(H5N1) virus–inoculated mice treated with oseltamivir (20 mg/kg/day), T-705 (50 mg/kg/day), or their combination.
BALB/c mice were treated as described in the legend for Fig. 1. The charts show the mutational events in the virus population collected from the lung homogenates (n = 3/group) at 8 dpi. Transition (Ti) and transversion (Tv) events were extracted from the read mappings for the NP, NS, MP, and NA genes (A) and the PA and PB1 genes (B) and graphed according to treatment group. Data from the groups that received combination therapies initiated at 48, 72, or 120 hpi were excluded from the analyses with PA and PB1 because of the poor sequence coverage and low viral titers obtained. *P < 0.05 and **P < 0.01, compared to control group by 1-way ANOVA. Black * represents statistical significance when compared to control and oseltamivir, blue * represents statistical significance when compared to oseltamivir, and gray * is significant only against control animals. Abbreviations: OSE, oseltamivir; OSE + T-705, oseltamivir and T-705 combination; NP, nucleoprotein; NS, nonstructural; MP, matrix; NA, neuraminidase; PA, acid polymerase; PB1, polymerase basic 1; WT, wild-type virus used for inoculation of mice.

Similar articles

Cited by

References

    1. World Health Organization. Cumulative numbers of confirmed human cases for influenza A(H5N1) reported to WHO, 2003-2015 (2016). Available at: http://www.who.int/influenza/human_animal_interface/2016_01_20_tableH5N1.... (Accessed: 9th March 2016).
    1. Chan M. C. et al.. Proinflammatory cytokine responses induced by influenza A (H5N1) viruses in primary human alveolar and bronchial epithelial cells. Respir Res 6, 135, doi: 10.1186/1465-9921-6-135 (2005). - DOI - PMC - PubMed
    1. de Jong M. D. et al.. Fatal outcome of human influenza A (H5N1) is associated with high viral load and hypercytokinemia. Nat Med 12, 1203–1207, doi: 10.1038/nm1477 (2006). - DOI - PMC - PubMed
    1. Shanmuganatham K. et al.. Genesis of avian influenza H9N2 in Bangladesh. Emerg Microbes Infect 3, e88, doi: 10.1038/emi.2014.84 (2014). - DOI - PMC - PubMed
    1. Qin Y. et al.. Differences in the Epidemiology of Human Cases of Avian Influenza A(H7N9) and A(H5N1) Viruses Infection. Clin Infect Dis, doi: 10.1093/cid/civ345 (2015). - DOI - PMC - PubMed

Publication types