. 2016 May 15;30(10):1155-71.
doi: 10.1101/gad.280941.116. Epub 2016 May 19.

Evolution of a transcriptional regulator from a transmembrane nucleoporin

Affiliations

Evolution of a transcriptional regulator from a transmembrane nucleoporin

Tobias M Franks et al. Genes Dev. .

Erratum in

Abstract

Nuclear pore complexes (NPCs) emerged as nuclear transport channels in eukaryotic cells ∼1.5 billion years ago. While the primary role of NPCs is to regulate nucleo-cytoplasmic transport, recent research suggests that certain NPC proteins have additionally acquired the role of affecting gene expression at the nuclear periphery and in the nucleoplasm in metazoans. Here we identify a widely expressed variant of the transmembrane nucleoporin (Nup) Pom121 (named sPom121, for "soluble Pom121") that arose by genomic rearrangement before the divergence of hominoids. sPom121 lacks the nuclear membrane-anchoring domain and thus does not localize to the NPC. Instead, sPom121 colocalizes and interacts with nucleoplasmic Nup98, a previously identified transcriptional regulator, at gene promoters to control transcription of its target genes in human cells. Interestingly, sPom121 transcripts appear independently in several mammalian species, suggesting convergent innovation of Nup-mediated transcription regulation during mammalian evolution. Our findings implicate alternate transcription initiation as a mechanism to increase the functional diversity of NPC components.

Keywords: Nup98; Pom121; evolution; hominoid; nuclear pore complex (NPC); transcription.


Figures

Figure 1.
Figure 1.
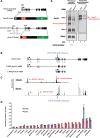
Detection of sPom121 mRNA and protein expression in human cells. (A) Schematic of two putative Pom121 isoforms expressed in humans and confirmed by 5′ rapid amplification of cDNA ends (RACE). (Top) Gray boxes indicate 5′ UTR-encoding exons, blue boxes indicate TM domain-encoding exon, and black boxes indicate Pom121-encoding exons. (Bottom) The TM domain, nuclear localization signal (NLS), and phenylalanine/glycine (FG) domain are indicated (blue, red, and green, respectively). (B) Schematic showing the annotated 5′ end of the Pom121 gene (shown at the top, “Pom121 gene”) compared with that of sPom121 (“5′ RACE sPom121 mRNA”) and Pom121 (“5′ RACE Pom121 mRNA”), identified here by 5′ RACE. (C) Histone H3 Lys4 trimethylation (H3K4me3) (top) and RNA sequencing (RNA-seq) (bottom) results from HeLa-C cells. Red arrows are used to indicate active transcriptional start sites (top), sPom121-specific exons (bottom left), or the TM-coding exon of Pom121 (bottom right). (D) sPom121 and Pom121 expression in various tissues. Quantitative PCR (qPCR) analysis of sPom121 (red bars) and Pom121 (blue bars) mRNA levels in multiple tissue types relative to actin. Results are plotted such that the tissue with the lowest sPom121 mRNA expression is at the left, while the tissue expressing the highest levels of sPom121 is shown at the right. Different primers were used to analyze sPom121 and Pom121 cDNA levels, and thus a comparison of sPom121 and Pom121 levels in each tissue cannot be made from these data. (E) Western blot to detect sPom121. Soluble (lanes 1,2) and insoluble (lanes 3,4) lysates were electrophoresed and Western blotted, and proteins were detected with a Pom121 antibody (top panels) or tubulin (bottom panels). (Lanes 2,4) Samples that had been treated with Pom121 siRNA are included to identify which bands correspond to Pom121 protein. Pom121 blots were exposed for 30 sec (left blot) or 10 sec (right blot).
Figure 2.
Figure 2.
sPom121 protein localizes in the nucleoplasm of human cells. (A) Schematic of the NPC components. (Gray, nuclear side of the NE) Cytoplasmic filaments; (gray, cytoplasmic side of the NE) nuclear basket; (black) Nup107/160 complex; (dark gray) Nup93-205 complex; (black with Pom121 highlighted in red) TM Nups; (blue) Nup98. (B) IF assays showing localization of endogenous Pom121 (panels 1,4) and Nup98 (panels 2,5) in HeLa-C cells. Merged images are shown in panels 3 and 6. (C) Comparison of localization of transfected rat Pom121-3GFP (panel 1) with endogenous Pom121 (panel 2). A merged image is shown in panel 3. The percentage of cells with intranuclear localization of the Pom121-3GFP is indicated in the bottom right corner of panel 1, while the number of cells quantified is in parentheses. (D) Comparison of sPom121-GFP (rat Pom121 amino acids 241–1200) with Nup98 in HeLa-C cells. The percentage of cells with intranuclear localization of the Pom121-3GFP is indicated in the bottom right corner of panel 1, while the number of cells quantified is in parenthesis.
Figure 3.
Figure 3.
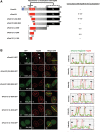
The NLS domain of sPom121 is required for colocalization with Nup98. (A) Schematic of Pom121 mutants used to identify the domain required to localize sPom121 to Nup98 foci. All mutants were cloned from a rat Pom121-3GFP construct that was described previously (Doucet et al. 2010; Talamas and Hetzer 2011). The Pom121 TM domain (blue), NLS domain (red), and FG domain (black) are shown. The fragment of sPom121 required for colocalization with Nup98 is indicated with a black bar (top), while the region that has a minor effect on sPom121 localization is indicated with a dotted black bar (top) (B) IF assays showing localization of the sPom121 mutants listed at the left (panels 1,4,7,10,13,16) and Nup98 (panels 2,5,8,11,14,17). Merged images are shown at the right (in panels 3,6,9,12,15,18). The percentage of cells with the Pom121 mutant colocalizing with GFP-Nup98 in the nucleoplasm is shown in the bottom right corner of the left panels, while the number of cells counted is shown in parentheses. (Panels 3,6,9,12,15,18) The fluorescence intensity of sPom121 and Nup98 at either the nuclear membrane or nucleoplasmic foci was observed by quantifying the intensity of the yellow lines drawn through a cell cross-section. The intensity graphs are shown at the right. (F) Focus. sPom121 only colocalizes with Nup98 in nucleoplasmic foci but never at the NE.
Figure 4.
Figure 4.
sPom121 and Nup98 have similar intranuclear dynamics. (A) FRAP assays showing fluorescence recovery of GFP-Nup98 (panels 1–3), sPom121-GFP (panels 4–6), or GFP-Nup133 (panels 7–9) during the time course shown at the top. The percent fluorescence recovery is indicated in the bottom right corner of each image, while the bleached area is indicated by the yellow dotted line. (B) Graph showing fluorescence recovery of either GFP-Nup98 (blue), sPom121-GFP (red), or GFP-Nup133 (green) under wild-type cell conditions. (C) FRAP assays showing fluorescence recovery of GFP-Nup98 (panels 1–3), sPom121-GFP (panels 4–6), or GFP-Nup133 (panels 7–9) in the presence of the transcriptional inhibitor actinomycin D (Act. D) during the time course shown at the top. The percent fluorescence recovery is indicated in the bottom right corner of each image, while the bleached area is indicated by the yellow dotted line. (D) Graph showing fluorescence recovery of either GFP-Nup98 (blue), sPom121-GFP (red), or GFP-Nup133 (green) in cells treated with actinomycin D.
Figure 5.
Figure 5.
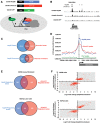
Nup98 and sPom121 cobind promoters in human cells. (A) Schematic of DamID constructs used to identify genomic binding sites of Nup98 (blue), sPom121 (red), and GFP (green). (Bottom diagram) DamID-tagged proteins that interact specifically with chromatin are expected to leave a well-defined peak, while GFP should not interact with chromatin and can be used to measure background DNA methylation. (B) Example of Nup98- and sPom121-binding peaks on a representative gene, FoxP2. Peaks that were called are shown at the top (C) Venn diagram showing overlap of Nup98 (blue) and sPom121 (red) DamID peaks (top) and Nup98 and sPom121 peaks that overlap at promoters (bottom) in HeLa-C cells. (D) Graph showing the number of peaks per base pair per gene relative to their transcriptional start sites. The X-axis represents location relative to the transcription start site (0 on the graph), while the Y-axis is the number of peaks per base pair per gene. Peaks identified in DamID experiments with Nup98 (blue), sPom121 (red), and a negative control protein, Cbx1 (green), which binds repressive chromatin are shown. (E) Overlap of genes misregulated by sPom121 (red) and Nup98 (blue) knockdowns. We asked what percentage of genes that are misregulated in sPom121 data sets (P-value < 0.01) is also misregulated by Nup98 knockdown (P-value < 0.01). The red area of the graph represents genes that were misregulated by sPom121 knockdown, while the blue represents genes that were misregulated by Nup98 knockdown. (F) Graph showing the log2 fold change of genes significantly misregulated (adjusted P-value < 0.05) in sPom121 knockdown data sets (Y-axis) plotted versus the log2 fold change of those same genes in Nup98 knockdown data sets (X-axis). If genes were up-regulated or down-regulated by both knockdowns, a red dot appears in the top right or bottom left quadrant of the graph, respectively (gray area of graph). In contrast, if a gene was misregulated by knockdown of either sPom121 or Nup98 but not by the other protein, a red dot appears in the top left or bottom right quadrant of the graph (white space).
Figure 6.
Figure 6.
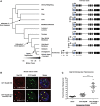
The hominoid version of sPom121 evolved recently and can recruit the Nup107/160 complex to the nucleoplasm when expressed in nonhominoid cells. (A) Novel upstream exons acquired sporadically during mammalian evolution are indicated in gray, while the Pom121 TM domain-coding exon (exon 4) is shown in blue, and the exons coding for the Pom121 ORF are shown in black. Note that, for simplicity, we are not showing the hominoid-specific duplication of the Pom121 gene (Pom121C). The gene structure of Pom121C is similar to the Pom121 locus, which is shown. (B) Localization of the endogenous Nup133 protein in mouse C2C12 cells in the presence of exogenous GFP-Nup98 or GFP-Nup98 and sPom121 together. The fold increase in Nup133 intensity in transfected cells relative to untransfected cells is shown in the bottom right corner of panels 1 and 4. (C) Plot of the fluorescence intensity of intranuclear Nup133. The intensity of Nup133 intranuclear foci in transfected cells was measured and plotted relative to Nup133 intranuclear staining in untransfected cells (background).
Figure 7.
Figure 7.
Model for sPom121-mediated recruitment of the Nup107/160 complex to the nucleoplasm of hominoid cells. (A,B, left side of model) In nonhominoid cells, sPom121 is likely not present, resulting in very little Nup133 (Nup107/160 complex) being prevented from entering the NPC during post-mitotic NPC assembly. (A,B, right side of model) In hominoids, sPom121 interacts with Nup98 and increases the affinity of Nup133 (Nup107/160) for Nup98 intranuclear complexes. As a result, a significant amount of Nup133 is retained in the nucleoplasm during post-mitotic and interphase NPC assembly. It remains to be seen whether the Nup107/160 complex can bind to Nup98 target genes and whether this has an effect on the regulation of said genes.

Similar articles

Cited by

References

    1. Alber F, Dokudovskaya S, Veenhoff LM, Zhang W, Kipper J, Devos D, Suprapto A, Karni-Schmidt O, Williams R, Chait BT, et al. 2007. The molecular architecture of the nuclear pore complex. Nature 450: 695–701. - PubMed
    1. Antonell A, de Luis O, Domingo-Roura X, Perez-Jurado LA. 2005. Evolutionary mechanisms shaping the genomic structure of the Williams-Beuren syndrome chromosomal region at human 7q11.23. Genome Res 15: 1179–1188. - PMC - PubMed
    1. Antonin W, Franz C, Haselmann U, Antony C, Mattaj IW. 2005. The integral membrane nucleoporin pom121 functionally links nuclear pore complex assembly and nuclear envelope formation. Mol Cell 17: 83–92. - PubMed
    1. Brawand D, Soumillon M, Necsulea A, Julien P, Csardi G, Harrigan P, Weier M, Liechti A, Aximu-Petri A, Kircher M, et al. 2011. The evolution of gene expression levels in mammalian organs. Nature 478: 343–348. - PubMed
    1. Brickner DG, Brickner JH. 2011. Gene positioning is regulated by phosphorylation of the nuclear pore complex by Cdk1. Cell Cycle 10: 392–395. - PMC - PubMed

Publication types

MeSH terms