. 2016 May 31;113(22):6194-9.
doi: 10.1073/pnas.1602878113. Epub 2016 May 16.

Chemo-mechanical pushing of proteins along single-stranded DNA

Affiliations

Chemo-mechanical pushing of proteins along single-stranded DNA

Joshua E Sokoloski et al. Proc Natl Acad Sci U S A. .

Abstract

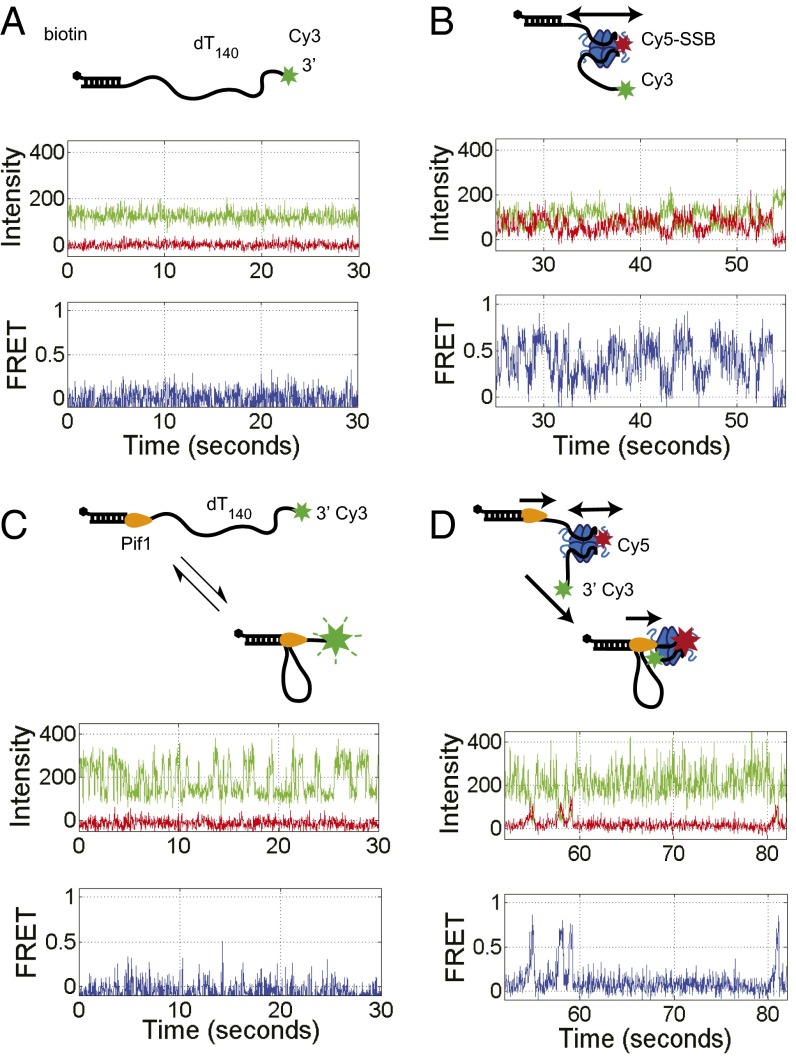
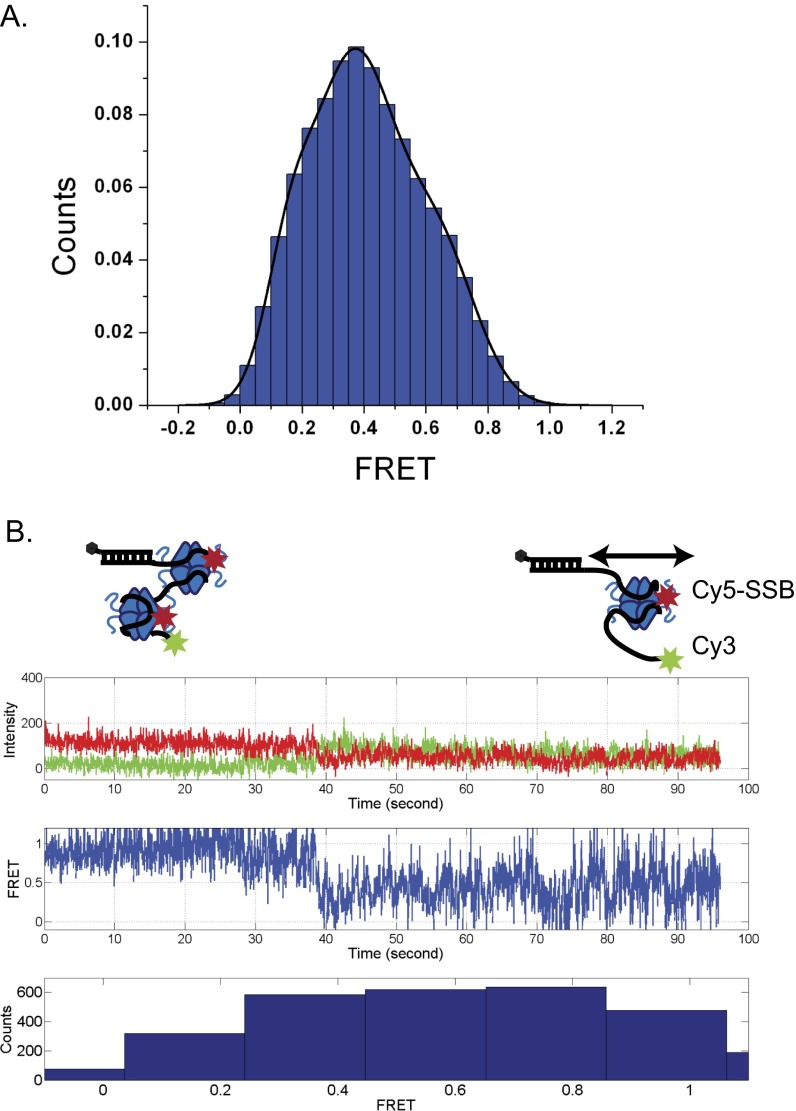
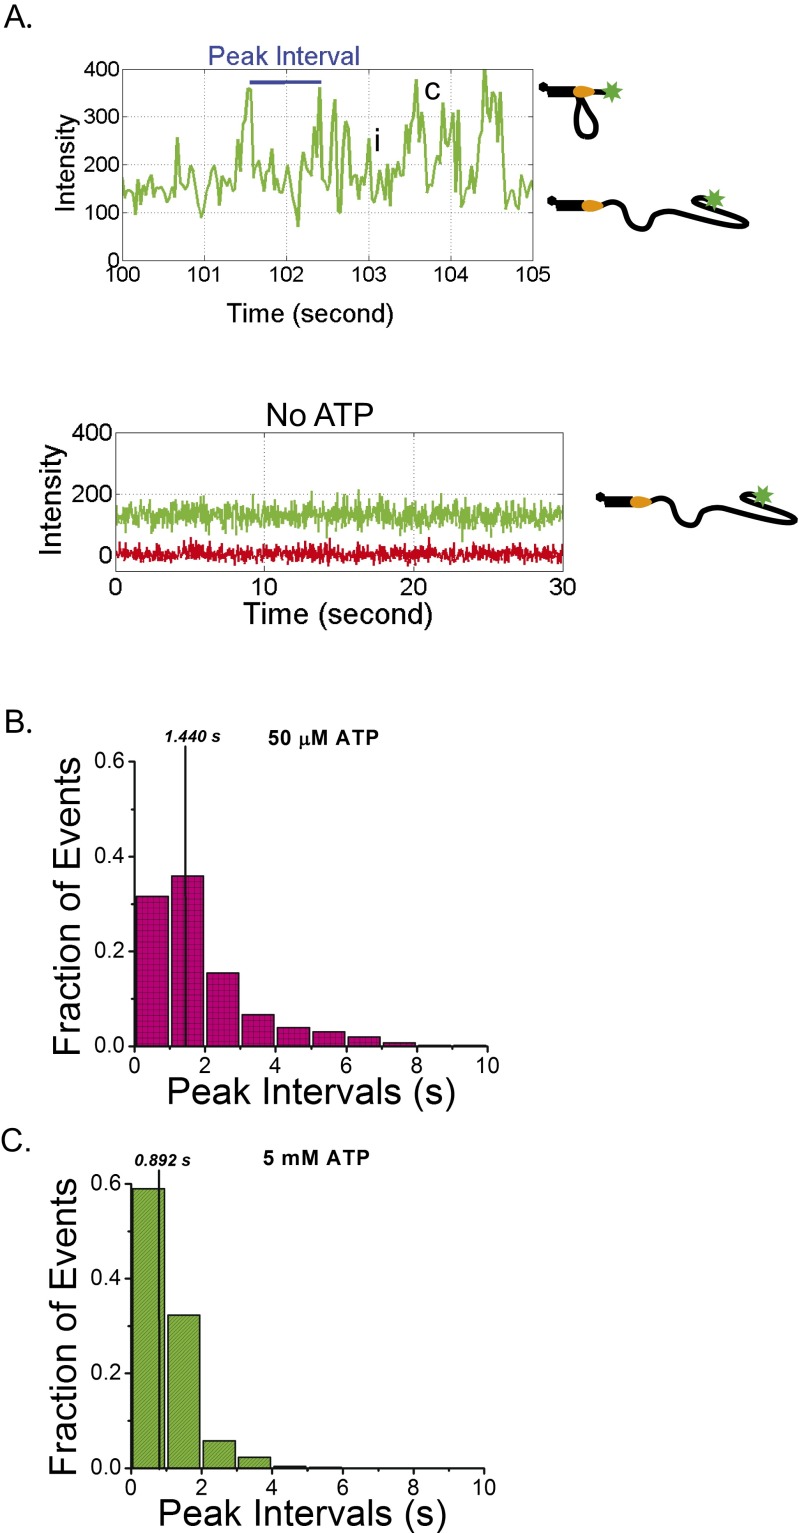
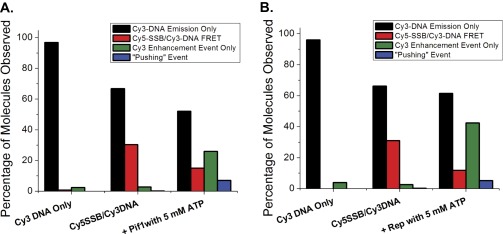
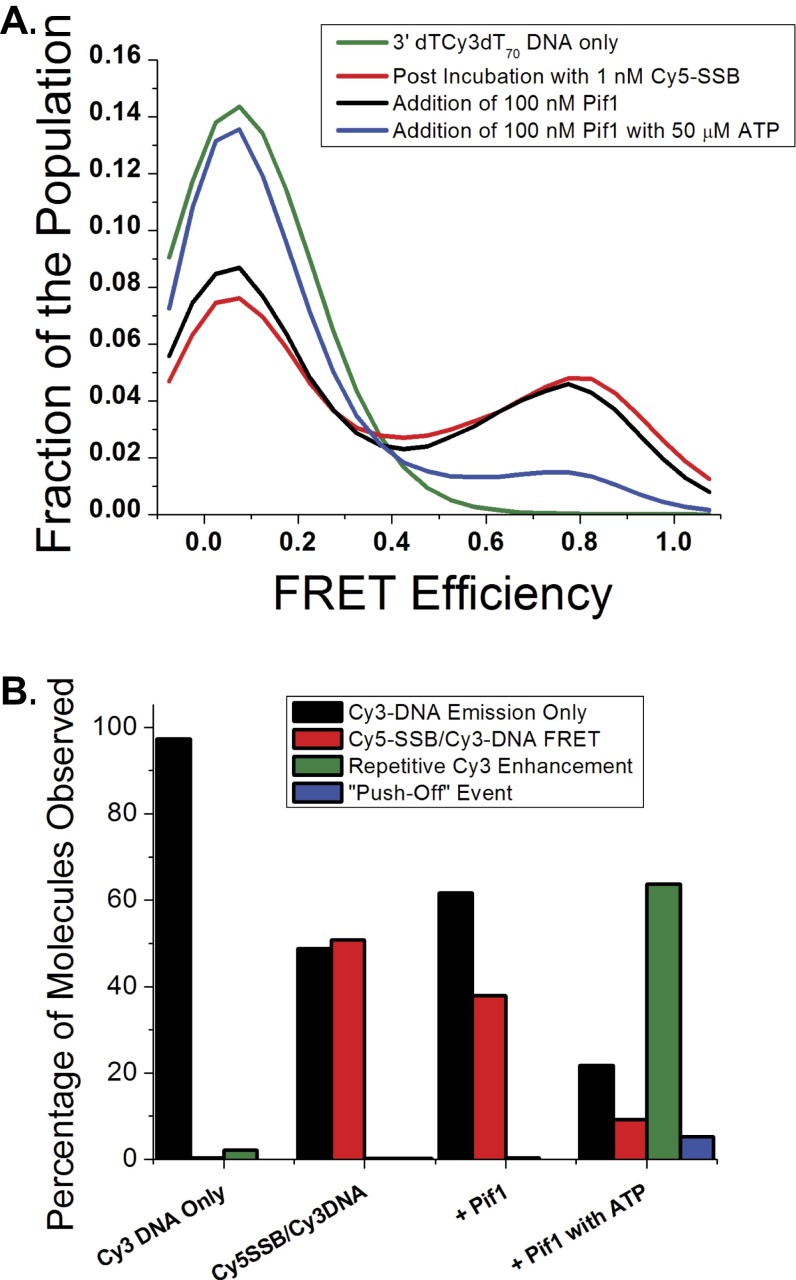
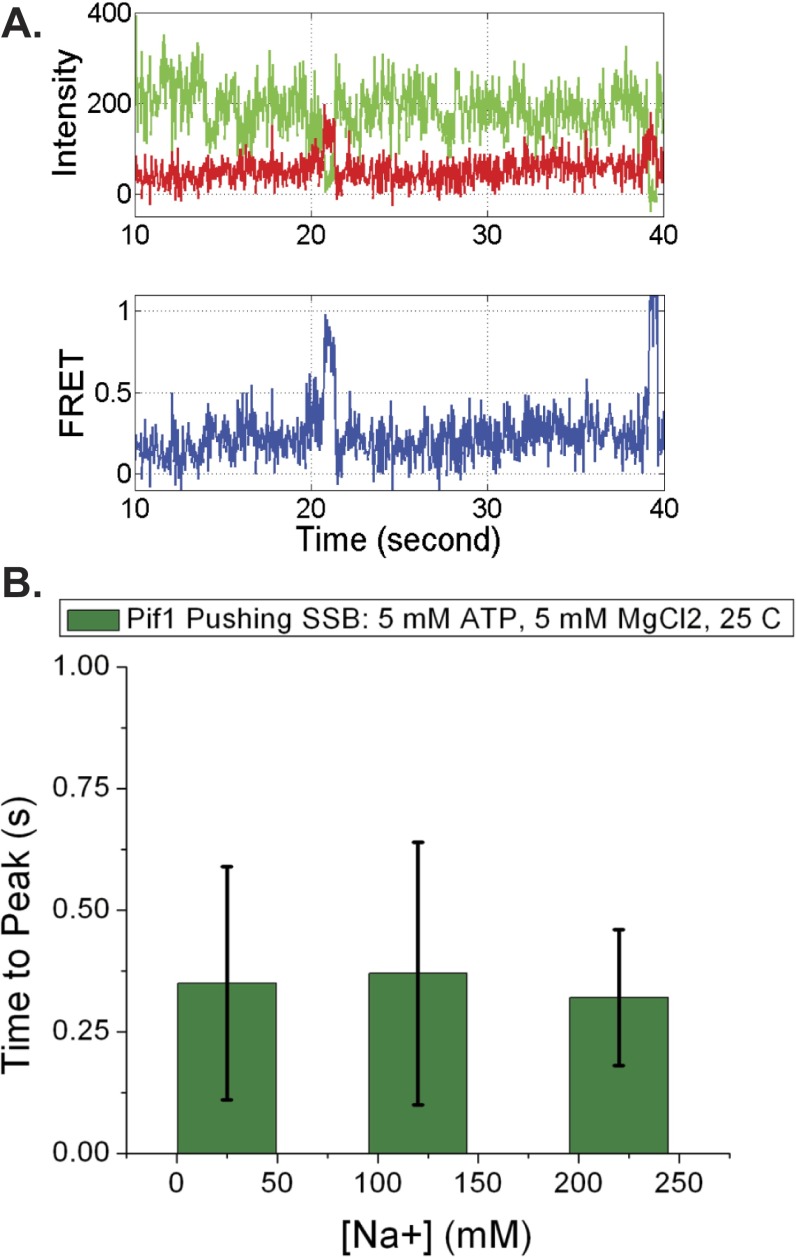
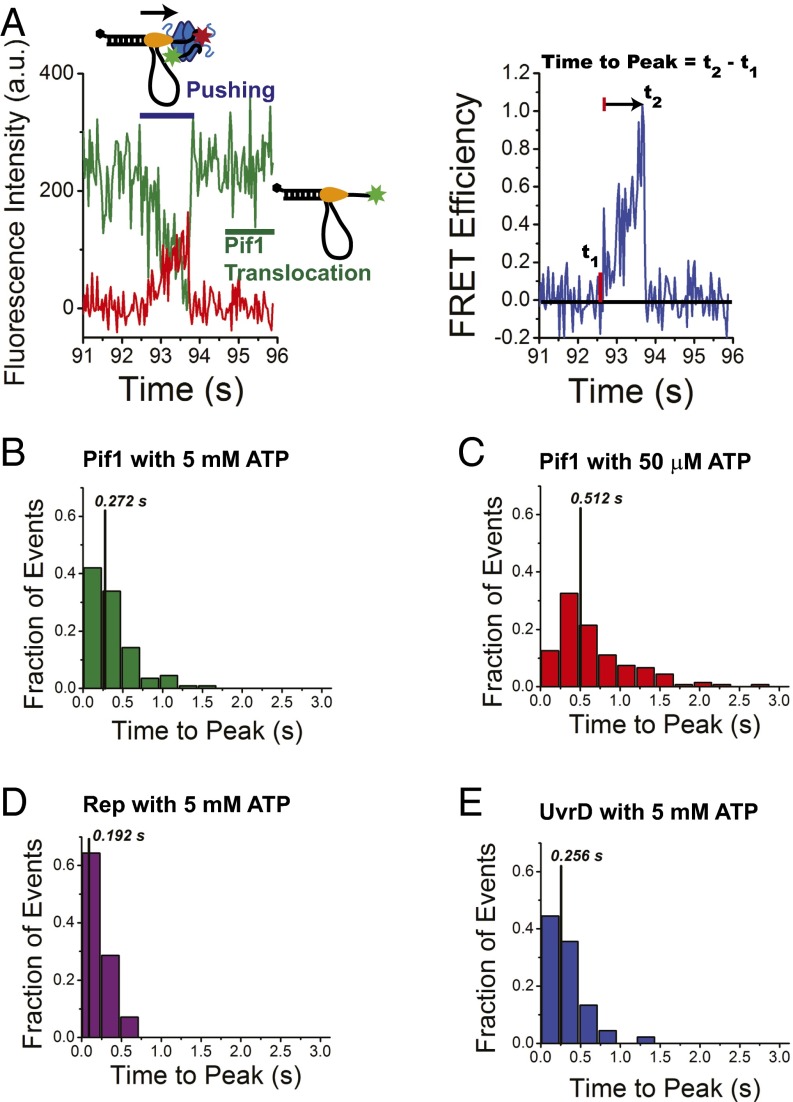
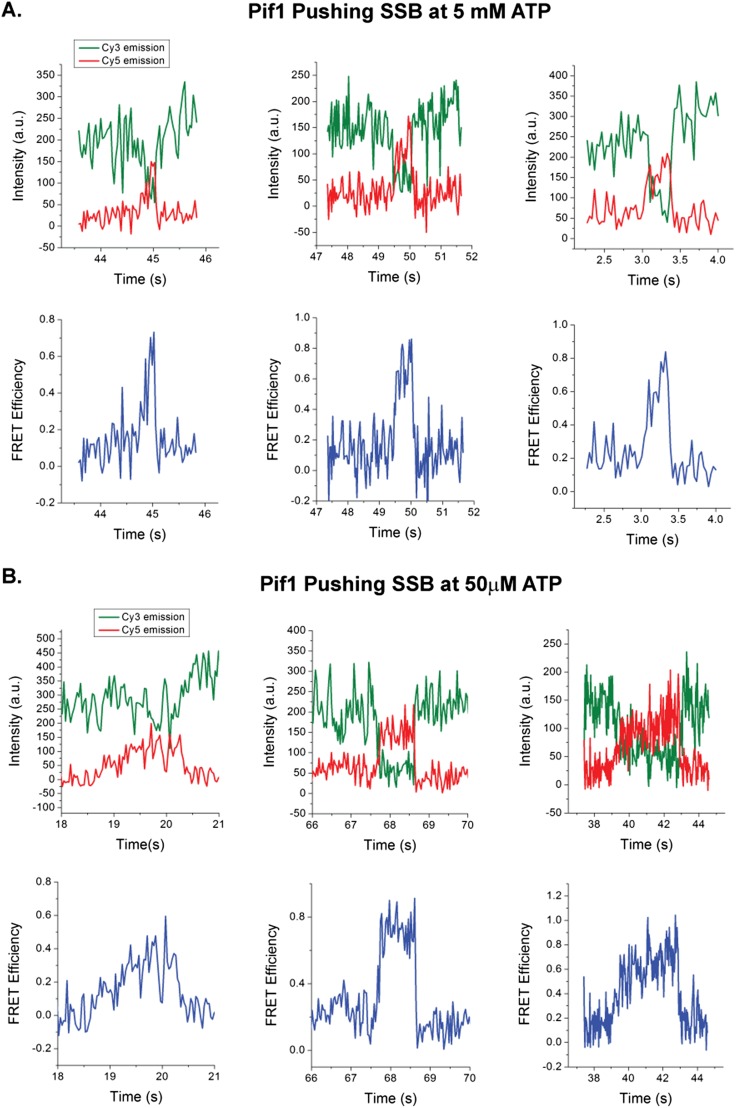
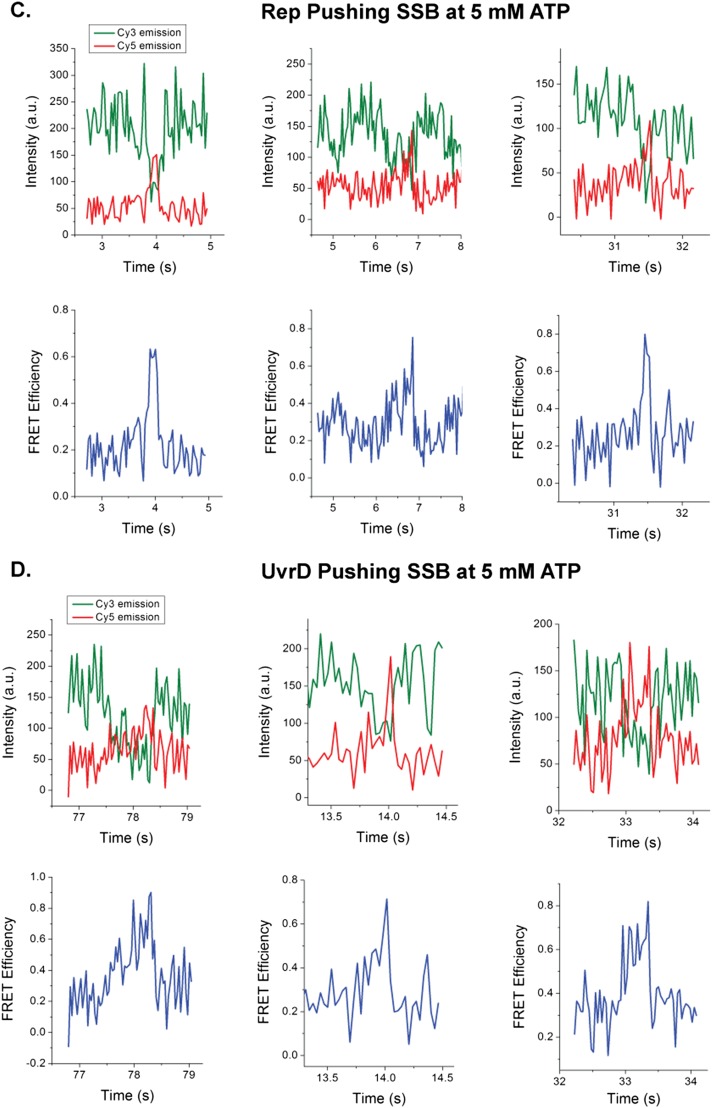
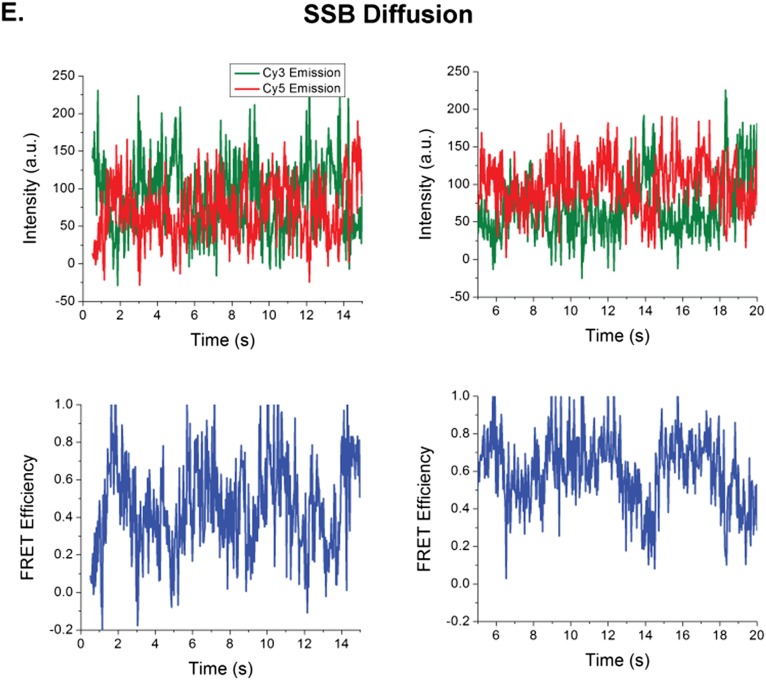
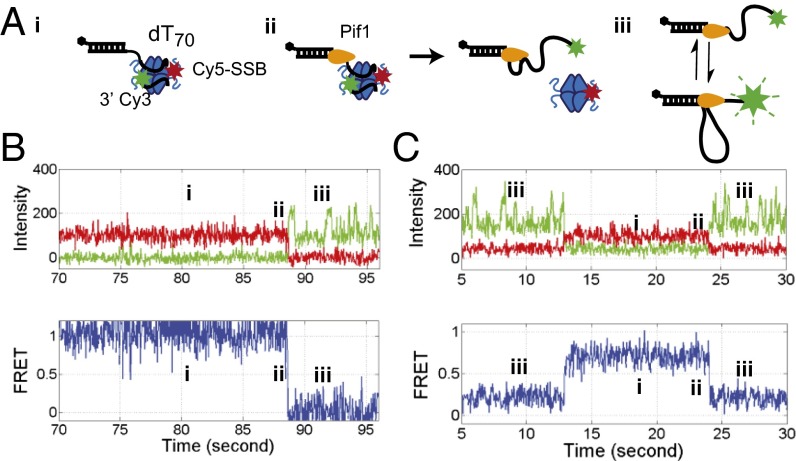
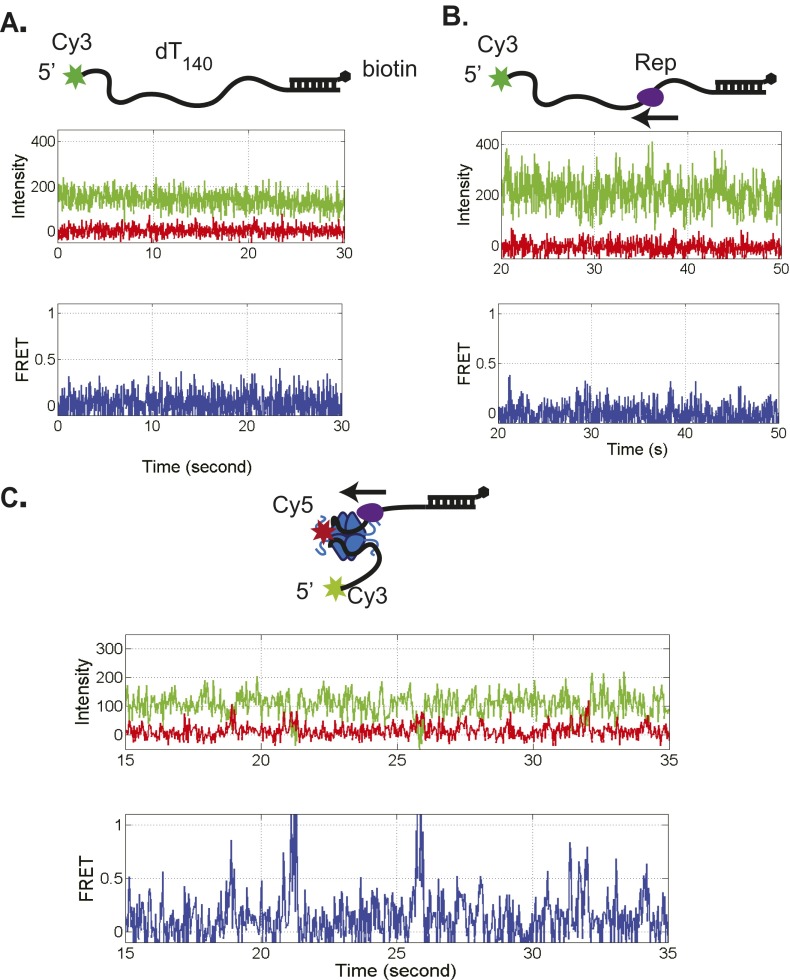
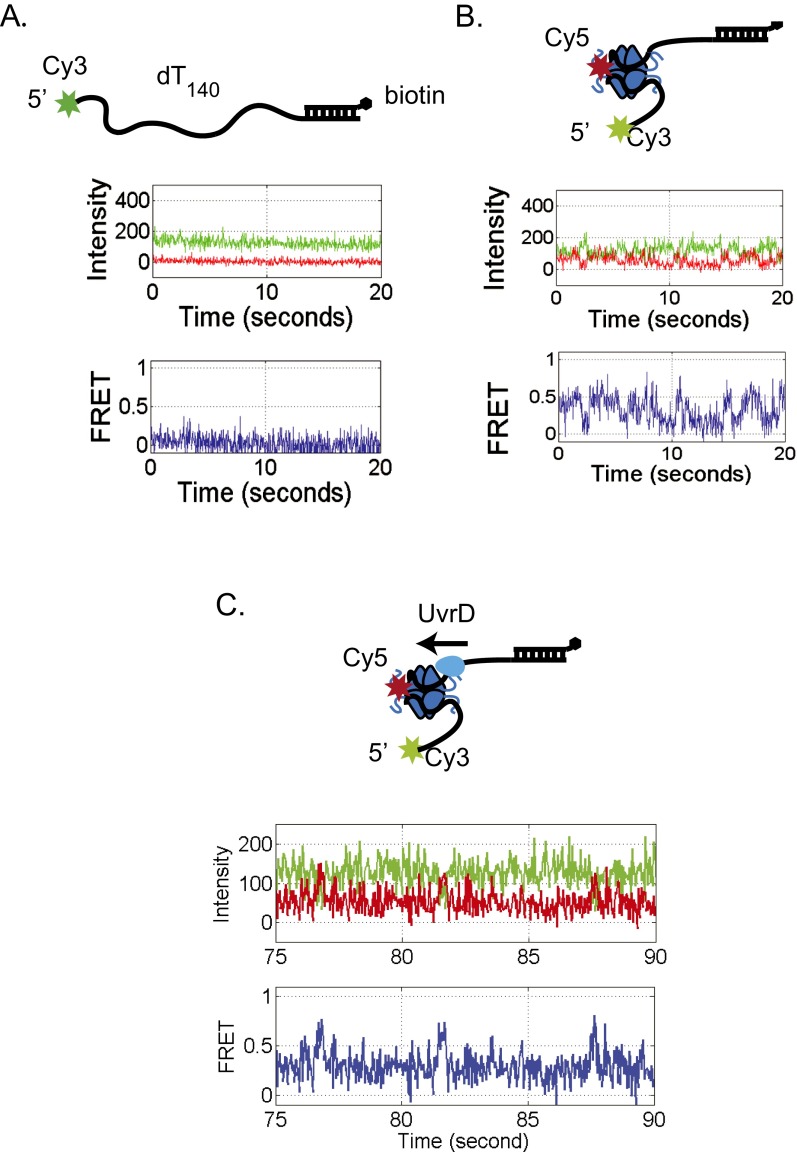
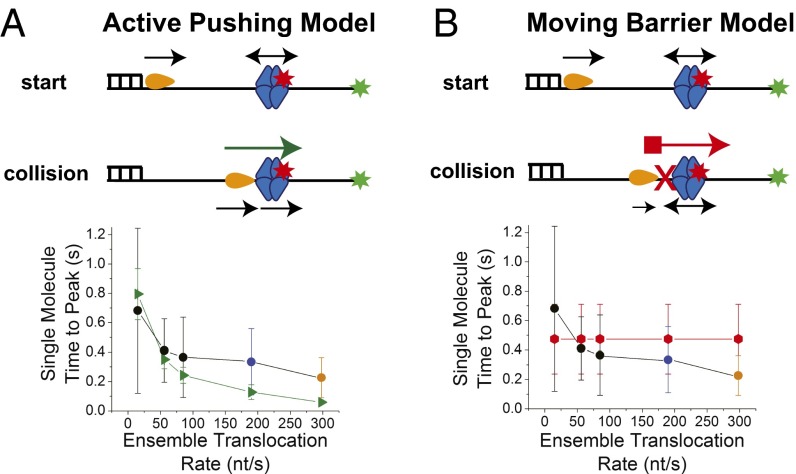
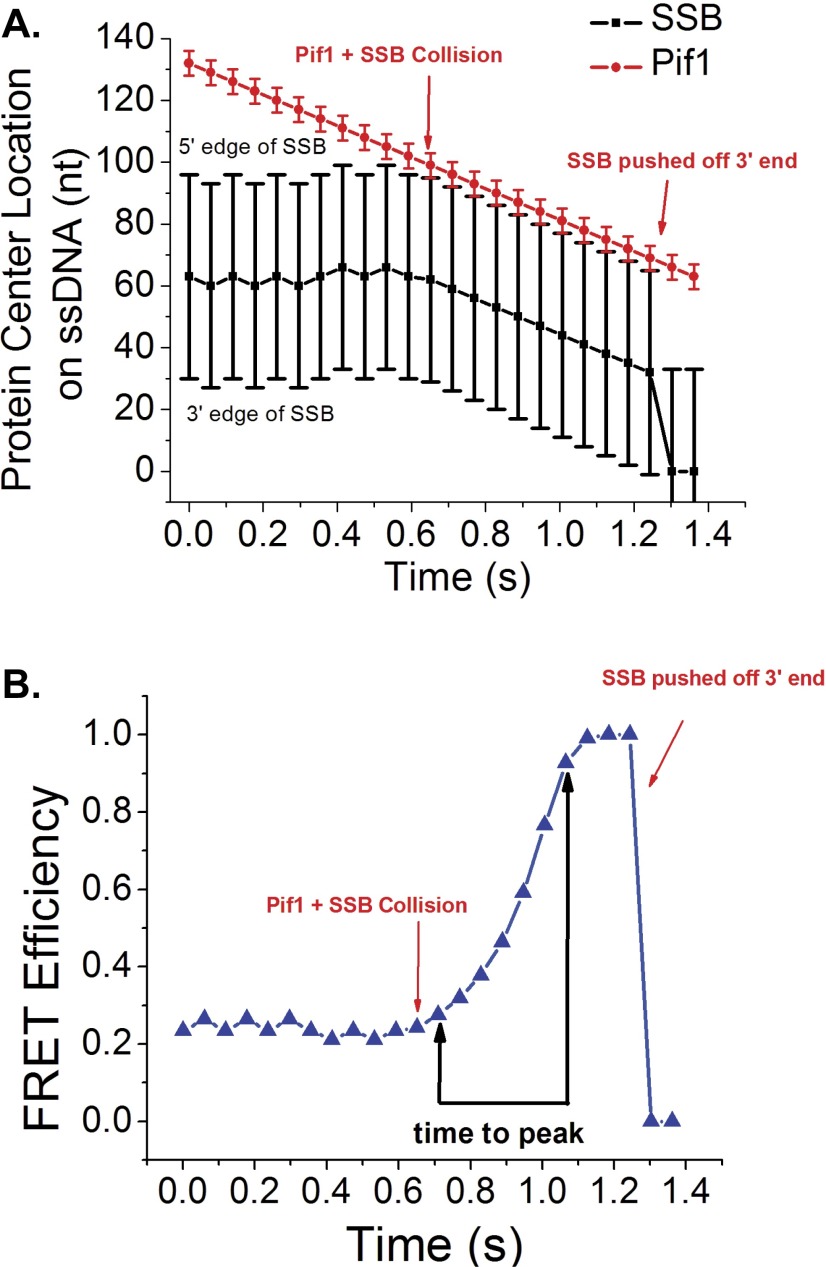
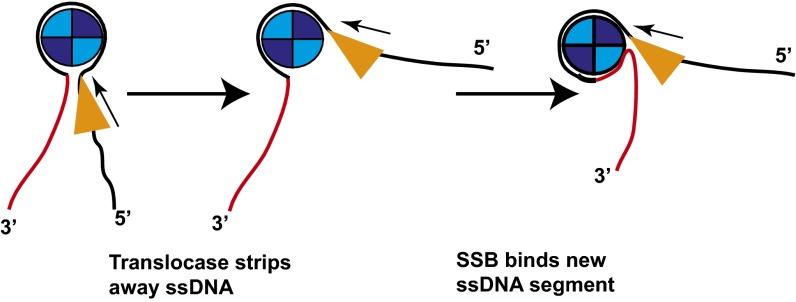
Single-stranded (ss)DNA binding (SSB) proteins bind with high affinity to ssDNA generated during DNA replication, recombination, and repair; however, these SSBs must eventually be displaced from or reorganized along the ssDNA. One potential mechanism for reorganization is for an ssDNA translocase (ATP-dependent motor) to push the SSB along ssDNA. Here we use single molecule total internal reflection fluorescence microscopy to detect such pushing events. When Cy5-labeled Escherichia coli (Ec) SSB is bound to surface-immobilized 3'-Cy3-labeled ssDNA, a fluctuating FRET signal is observed, consistent with random diffusion of SSB along the ssDNA. Addition of Saccharomyces cerevisiae Pif1, a 5' to 3' ssDNA translocase, results in the appearance of isolated, irregularly spaced saw-tooth FRET spikes only in the presence of ATP. These FRET spikes result from translocase-induced directional (5' to 3') pushing of the SSB toward the 3' ssDNA end, followed by displacement of the SSB from the DNA end. Similar ATP-dependent pushing events, but in the opposite (3' to 5') direction, are observed with EcRep and EcUvrD (both 3' to 5' ssDNA translocases). Simulations indicate that these events reflect active pushing by the translocase. The ability of translocases to chemo-mechanically push heterologous SSB proteins along ssDNA provides a potential mechanism for reorganization and clearance of tightly bound SSBs from ssDNA.

Keywords: DNA motors; SF1 translocases; SSB proteins; dynamics.


Conflict of interest statement

The authors declare no conflict of interest.

Figures

Fig. 1.
Fig. 1.
Single molecule TIRF time trajectories showing SSB pushing by Pif1. (A) 3′dT-Cy3-(dT)140 DNA immobilized on the slide surface via a biotin-Neutravidin-biotin linkage displays only Cy3 fluorescence. (B) On addition of Cy5-SSB(A122C) (1 mM) and washing out free protein, anticorrelated Cy3 and Cy5 fluorescence fluctuations are observed indicating SSB diffusion along the ssDNA. (C) Addition of Pif1 (100 nM) to the 3′dT-Cy3-(dT)140 DNA, followed by ATP (5 mM) and washing out free protein, results in repetitive Cy3 enhancement (PIFE) spikes. (D) Addition of Pif1 (100 nM) with ATP (5 mM) to the 3′dT-Cy3-(dT)140 DNA prebound with Cy5-SSB results in a replacement of SSB diffusing FRET signals with Pif1 translocating PIFE signals and intermittent asymmetric FRET spikes reflecting Pif1 pushing of SSB in a 5′ to 3′ direction. Green, Cy3 fluorescence; red, Cy5 fluorescence; blue, FRET efficiency calculated from the Cy3 and Cy5 signals. Solution conditions: 30 mM Tris⋅HCl, pH 8.1, 100 mM NaCl, 5 mM MgCl2, 1 mM DTT, 0.1 mg/mL BSA, 0.5% (wt/vol) dextrose, 3 mM Trolox, 1 mg/mL glucose oxidase, and 0.4 mg/mL catalase, 25 °C.
Fig. S1.
Fig. S1.
Characteristics of FRET trajectories when one vs. two Cy5-SSB tetramers are bound to 3′dT-Cy-(dT)140 DNA. (A) Histogram of FRET states from Cy3-DNA molecules bound with Cy5-SSB (n = 83). The DNA was incubated with 4 nM Cy5-SSB(A122C) tetramer for 5 min and then washed with 10 column volumes of buffer. (B) Example single molecule trace showing the transition from two Cy5-SSB tetramers bound to a single DNA to one Cy5-SSB tetramers bound. The first 38 s of the trace shows a persistent high FRET state with no fluctuations when two Cy5-SSB tetramers are bound, whereas the second half shows the expected fluctuating FRET signal when a single Cy5-SSB is bound and can diffuse. Solution conditions: 30 mM Tris⋅HCl, pH 8.1, 100 mM NaCl, 5 mM MgCl2, 1 mM DTT, 0.1 mg/mL BSA, 0.5% (wt/vol) dextrose, 3 mM Trolox, 1 mg/mL glucose oxidase, and 0.4 mg/mL catalase, 25 °C.
Fig. S2.
Fig. S2.
ScPif1 repetitive translocation on (dT)140. (A) A segment of the repetitive Cy3 enhancement (PIFE) signal observed when ATP is added to a surface immobilized 3′-dT-Cy3-(dT)140 DNA previously incubated with 100 nM Pif1 and subsequently washed with buffer to remove unbound Pif1. The peak interval is defined as the time between the maximum of two Cy3 emission peaks. An example of a complete translocation event where the Pif1 reaches the 3′ end of the ssDNA is marked by c. The Pif1 then releases the ssDNA while remaining bound at the junction so that it can undergo another translocation event. An example of an incomplete translocation event where the Pif1 does not reach the 3′ end before releasing the ssDNA is marked by i. In the absence of ATP, no repetitive Cy3 enhancement is observed. (B) Histogram of peak intervals for Pif1 translocation at 50 μM ATP. The average peak interval was 2.0 ± 1.7 s and the median peak interval was 1.440 s (567 events collected from 54 molecules). (C) Histogram of peak intervals for Pif1 translocation at 5 mM ATP. The average peak interval was 1.1 ± 0.7 s and the median peak interval was 0.892 s (517 events collected from 33 molecules). Solutions conditions: 30 mM Tris⋅HCl, pH 8.1, 100 mM NaCl, 5 mM MgCl2, 1 mM DTT, 0.1 mg/mL BSA, 0.5% (wt/vol) dextrose, 3 mM Trolox, 1 mg/mL glucose oxidase, and 0.4 mg/mL catalase, 25 °C.
Fig. S3.
Fig. S3.
Observed signal distributions for each step in a translocase-SSB pushing assay. (A) Percentage of each type of single molecule behavior observed for each condition for Pif1 pushing and displacement of Cy5-SSB: surface immobilized 3′-Cy3-(dT)140 DNA: n = 419; 3′-Cy3-(dT)140 DNA postincubation with 1 nM Cy5-SSBtet, N = 1,124 ; 3′-Cy3-(dT)140 DNA/Cy5-SSB within 1 min of addition of 100 nM Pif1 and 50 μM ATP, n = 127. (B) Percentage of each type of single molecule behavior observed for each condition for Rep pushing and displacement of Cy5-SSB: surface immobilized 5′-Cy3-(dT)140 DNA, n = 281; 5′-Cy3 (dT)140 DNA postincubation with 1 nM Cy5-SSB, N = 466; 5′-Cy3-(dT)140 DNA/Cy5-SSB within 1 min of addition of 100 nM Rep and 5 mM ATP, n = 288. Cy3 DNA emission only (black columns) had only stable Cy3 emission with no enhancement spikes or Cy5 emission observed. Cy5-SSB/Cy3-DNA FRET (red columns) displayed anticorrelated Cy3 and Cy5 emission. The Cy3 enhancement event (green columns) exhibited saw-tooth spikes of enhanced Cy3 emission (PIFE). Pushing event (blue column) indicates molecules that show a high FRET signal that disappears in a near step function and is replaced by repetitive Cy3 enhancement (PIFE).
Fig. S4.
Fig. S4.
Pif1-induced displacement of Cy5-SSB from 3′-dT-Cy3-(dT)70 DNA is ATP dependent. (A) FRET histograms for 3′-dT-Cy3-(dT)70 DNA only (green line), after incubation with 1 nM Cy5-SSB and subsequent washing away of unbound protein (red line), addition of 100 nM ScPif1 to Cy5-SSB/3′-dT-Cy3-(dT)70 DNA (black line), and addition of 100 nM ScPif1 with 50 μM ATP to Cy5-SSB/3′-dT-Cy3-(dT)70 DNA (blue line). n = 200 molecules for each condition. (B) Percentage of each type of single molecule behavior observed for each condition described in A. Cy3 DNA emission only (black columns) had only stable Cy3 emission with no enhancement spikes or Cy5 emission observed. Cy5-SSB/Cy3-DNA FRET (red columns) displayed anticorrelated Cy3 and Cy5 emission. The repetitive Cy3 enhancement (green columns) exhibited regularly spaced saw-tooth spikes of enhanced Cy3 emission (PIFE). Push-off event (blue column) indicates molecules that show a high FRET signal that disappears in a near step function and is replaced by repetitive Cy3 enhancement (PIFE).
Fig. S5.
Fig. S5.
The observation of a FRET spike reflecting SSB pushing by Pif1 does not depend on order of addition or sodium chloride concentration. (A) Representative trace of SSB-Pif1 collisions resulting in SSB pushing that occurs when 0.8 nM SSB with 5 mM ATP is added to previously formed Pif1/ 3′-dT-Cy3-(dT)140 DNA complexes. (B) Comparison of time to peak values for Pif1 pushing of SSB at 25, 120, and 220 mM NaCl.
Fig. 2.
Fig. 2.
Analysis of the translocase-induced FRET spikes reflecting SSB pushing. (A) Asymmetric FRET spikes identified as a gradual increase in FRET followed by a sharp decrease in FRET. The spike is preceded and followed by spikes in Cy3 fluorescence due to Pif1 translocation. The time-to-peak is determined from the time, t1, at which the signal increases above the baseline average to the time, t2, where the FRET value reaches its maximum. (Left) Raw Cy3 and Cy5 fluorescence emission time trajectories. (Right) Corresponding FRET signal. (B) Histogram of time-to-peak values for Pif1-SSB collisions at 5 mM ATP. The median value for the distribution (vertical black line) is 0.272 s; mean value = 0.4 s; SD = 0.3 s (n = 112 events). (C) Histogram of time-to-peak values for Pif1-SSB collisions at 50 μM ATP. Median value for the distribution is 0.512 s; mean value = 0.7 s; SD = 0.6 s (n = 136 events). (D) Histogram of time-to-peak values for Rep-SSB collisions at 5 mM ATP. The median value for the distribution is 0.192 s; mean value = 0.2 s; SD = 0.1 s (n = 42 events). (E) Histogram for time-to-peak values for UvrD-SSB collisions at 5 mM ATP. The median value for the distribution is 0.256 s; mean value = 0.3 s; SD = 0.2 s (n = 45 events).
Fig. S6.
Fig. S6.
Examples of Cy5-SSB being pushed by ssDNA translocases and diffusing freely on (dT)140. (A) Sample pushing FRET peaks for Pif1 pushing Cy5-SSB on 3′dT-Cy3-(dT)140 at 5 mM ATP. (B) Sample pushing FRET peaks for Pif1 pushing Cy5-SSB on 3′dT-Cy3-(dT)140 at 50 μM ATP. (C) Sample pushing FRET peaks for Rep pushing Cy5-SSB on 5′dT-Cy3-(dT)140 at 5 mM ATP. (D) Sample pushing FRET peaks for UvrD pushing Cy5-SSB on 5′dT-Cy3-(dT)140 at 5 mM ATP. (E) Sample FRET fluctuations for Cy5-SSB diffusing on 3′dT-Cy3-(dT)140. Solution conditions: 30 mM Tris⋅HCl, pH 8.1, 100 mM NaCl, 5 mM MgCl2, 1 mM DTT, 0.1 mg/mL BSA, 0.5% (wt/vol) dextrose, 3 mM Trolox, 1 mg/mL glucose oxidase, and 0.4 mg/mL catalase, 25 °C. Green, Cy3 fluorescence; red, Cy5 fluorescence; blue, FRET efficiency calculated from Cy3 and Cy5 emission intensities.
Fig. S6.
Fig. S6.
Examples of Cy5-SSB being pushed by ssDNA translocases and diffusing freely on (dT)140. (A) Sample pushing FRET peaks for Pif1 pushing Cy5-SSB on 3′dT-Cy3-(dT)140 at 5 mM ATP. (B) Sample pushing FRET peaks for Pif1 pushing Cy5-SSB on 3′dT-Cy3-(dT)140 at 50 μM ATP. (C) Sample pushing FRET peaks for Rep pushing Cy5-SSB on 5′dT-Cy3-(dT)140 at 5 mM ATP. (D) Sample pushing FRET peaks for UvrD pushing Cy5-SSB on 5′dT-Cy3-(dT)140 at 5 mM ATP. (E) Sample FRET fluctuations for Cy5-SSB diffusing on 3′dT-Cy3-(dT)140. Solution conditions: 30 mM Tris⋅HCl, pH 8.1, 100 mM NaCl, 5 mM MgCl2, 1 mM DTT, 0.1 mg/mL BSA, 0.5% (wt/vol) dextrose, 3 mM Trolox, 1 mg/mL glucose oxidase, and 0.4 mg/mL catalase, 25 °C. Green, Cy3 fluorescence; red, Cy5 fluorescence; blue, FRET efficiency calculated from Cy3 and Cy5 emission intensities.
Fig. 3.
Fig. 3.
Pif1 can push SSB off the end of 3′-dT-Cy3-(dT)70 DNA. (A) Cartoons representing the three states of the DNA after Pif1 and ATP are added to 3′-dT-Cy3-(dT)70 DNA prebound with Cy5-SSB: (i) Cy5-SSB bound to 3′-dT-Cy3-(dT)70. (ii) Pif1 binds at the ss/dsDNA junction and pushes SSB off the 3′-DNA end using its ATP driven 5′ to 3′ translocation. (iii) Repetitive 5′ to 3′ translocation of Pif1 along the ssDNA. (B) Representative time trajectory showing the Cy3, Cy5 and FRET signals resulting from each of the three states depicted in A. The region marked ii shows the ATP-dependent displacement of Cy5-SSB from the ssDNA end by Pif1 translocation indicated by a stable, high FRET signal that is replaced by repetitive Cy3 enhancement with no Cy5 emission. (C) Representative time trajectory showing (iii) repetitive Pif1 translocation along 3′-dT-Cy3-(dT)70 DNA, followed by (i) binding of Cy5-SSB to the DNA and (ii) subsequent displacement of Cy5-SSB from the DNA by another Pif1. Green, Cy3 fluorescence; red, Cy5 fluorescence; blue, FRET efficiency. Solution conditions as in Fig. 1.
Fig. S7.
Fig. S7.
Representative smTIRF time trajectories for SSB pushing by Rep. (A) 5′-Cy3-dT140 DNA immobilized on the slide surface via a biotin-Neutravidin-biotin linkage displays only Cy3 fluorescence similar to the 3′-Cy3 DNA substrate. (B) Introduction of 100 nM Rep and 5 mM ATP results in repetitive Cy3 PIFE fluctuations. (C) Introduction of 100 nM Rep with 5 mM ATP to a surface with Cy5-SSB bound to 5′-Cy3-dT140 DNA results in the loss of fluctuating FRET signals reflecting random SSB diffusion with only fluctuating Cy3 PIFE signals reflecting Rep translocation. Asymmetric saw-toothed anticorrelated FRET spikes are observed in 22% of molecules still displaying Cy5 emission. Green, Cy3 fluorescence; red, Cy5 fluorescence; blue, FRET efficiency calculated from the Cy3 and Cy5 signals. Solution conditions: 30 mM Tris⋅HCl, pH 8.1, 20 mM NaCl, 5 mM MgCl2, 1 mM DTT, 0.1 mg/mL BSA, 0.5% (wt/vol) dextrose, 3 mM Trolox, 1 mg/mL glucose oxidase, and 0.4 mg/mL catalase, 25 °C.
Fig. S8.
Fig. S8.
UvrD induced pushing of Cy5-SSB on 5′dT-Cy3-(dT)140. (A) Representative smTIRF time trajectory for 5′-Cy3-dT140 immobilized on the slide surface shows only Cy3 fluorescence (green). (B) Addition of 2.5 nM Cy5-labeled SSB, incubated for 5 min, followed by washing out of free protein results in the appearance of fluctuating Cy5 fluorescence (red) reflecting bound and diffusing SSB. (C) Addition of 100 nM UvrD with 1 mM ATP results in the appearance of saw-tooth-shaped FRET spikes (blue). Solution conditions: 10 mM Tris, pH 8.1,10% glycerol, 100 mM NaCl, and 5 mM MgCl2, 25 °C.
Fig. 4.
Fig. 4.
Translocases actively push SSB along ssDNA. (A) Active pushing model: The translocase initiates at the ds/ss DNA junction, whereas the SSB can bind randomly between the translocase and the DNA end-labeled with the Cy3 donor. On collision, the translocase can push the SSB along the ssDNA. Comparison of time-to-peak values as a function of translocation rate obtained from active pushing simulations (green triangles) with experimental single molecule median time-to-peak values: black circles, Pif1 pushing SSB at 5 mM, 500 μM, and 50 μM ATP; blue circle, UvrD pushing SSB at 5 mM ATP; orange circle, Rep pushing SSB at saturating 5 mM ATP. (B) Moving barrier model: On collision, the translocase cannot push the SSB, but presents a continuously advancing barrier only allowing SSB diffusion toward the Cy3 DNA end. Comparison of time-to-peak values as a function of translocation rate obtained from moving barrier simulations (red octagons) with experimental single molecule median time-to-peak values: black circles, Pif1 pushing SSB at 5 mM, 500 μM, and 50 μM ATP; blue circle, UvrD pushing SSB at 5 mM ATP; orange circle, Rep pushing SSB at saturating 5 mM ATP.
Fig. S9.
Fig. S9.
Results of a simulation of Pif1 pushing SSB along ssDNA via active pushing. (A) Simulated protein positions on the ssDNA lattice during a single simulation. Black squares represent the center of mass position for EcSSB and the bars represent the position of the 5′ and 3′ edges of the bound protein. Red circles represent the center of mass position for ScPif1 and the bars represent the 5′ and 3′ edges of the translocase. In the simulation, the Pif1 translocase motor starts at the extreme 5′ end of the DNA lattice and advances in the 3′ direction, whereas the SSB undergoes a random walk along the DNA. A collision occurs when the 3′ edge of the Pif1 overlaps with the 5′ edge of the SSB. After the collision, the Pif1 and SSB move as a single unit toward the 3′ end of the DNA. The active displacement of SSB from the DNA end is represented as the SSB position going to 0. (B) The corresponding FRET efficiency predicted for the simulation in A determined from the distance between the 3′ edge of the SSB and the 3′ end of the DNA. The 3D distance was estimated by modeling the ssDNA between the SSB edge and the 3′ end as a modified worm-like chain and the FRET efficiency was calculated using a Fӧrster distance of 56 Å.
Fig. 5.
Fig. 5.
Rolling model for motor-induced pushing of SSB. The translocating motor (triangle) collides with the SSB (blue circle) (in this case from the 5′ side) and strips a portion of the ssDNA from the SSB creating an unoccupied ssDNA binding site. The newly available ssDNA binding site is then bound by ssDNA from the 3′ side, replacing the ssDNA displaced by the translocase. This results in a net directional movement of the SSB toward the 3′ end of the ssDNA by a rolling mechanism.

Similar articles

Cited by

References

    1. Shereda RD, Kozlov AG, Lohman TM, Cox MM, Keck JL. SSB as an organizer/mobilizer of genome maintenance complexes. Crit Rev Biochem Mol Biol. 2008;43(5):289–318. - PMC - PubMed
    1. Roy R, Kozlov AG, Lohman TM, Ha T. SSB protein diffusion on single-stranded DNA stimulates RecA filament formation. Nature. 2009;461(7267):1092–1097. - PMC - PubMed
    1. Hobbs MD, Sakai A, Cox MM. SSB protein limits RecOR binding onto single-stranded DNA. J Biol Chem. 2007;282(15):11058–11067. - PubMed
    1. Shereda RD, Bernstein DA, Keck JL. A central role for SSB in Escherichia coli RecQ DNA helicase function. J Biol Chem. 2007;282(26):19247–19258. - PubMed
    1. Kozlov AG, Jezewska MJ, Bujalowski W, Lohman TM. Binding specificity of Escherichia coli single-stranded DNA binding protein for the chi subunit of DNA pol III holoenzyme and PriA helicase. Biochemistry. 2010;49(17):3555–3566. - PMC - PubMed

Publication types

MeSH terms

LinkOut - more resources