. 2016 May 16:6:25895.
doi: 10.1038/srep25895.

α-Amanitin Restrains Cancer Relapse from Drug-Tolerant Cell Subpopulations via TAF15

Affiliations

α-Amanitin Restrains Cancer Relapse from Drug-Tolerant Cell Subpopulations via TAF15

Kohei Kume et al. Sci Rep. .

Abstract

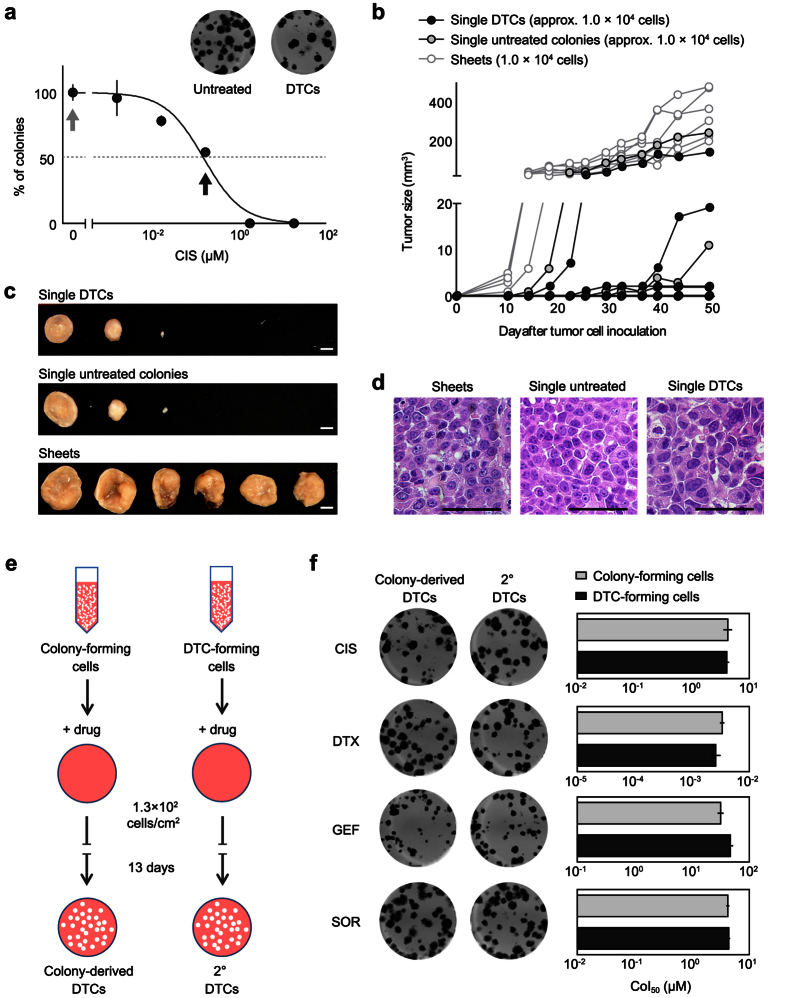
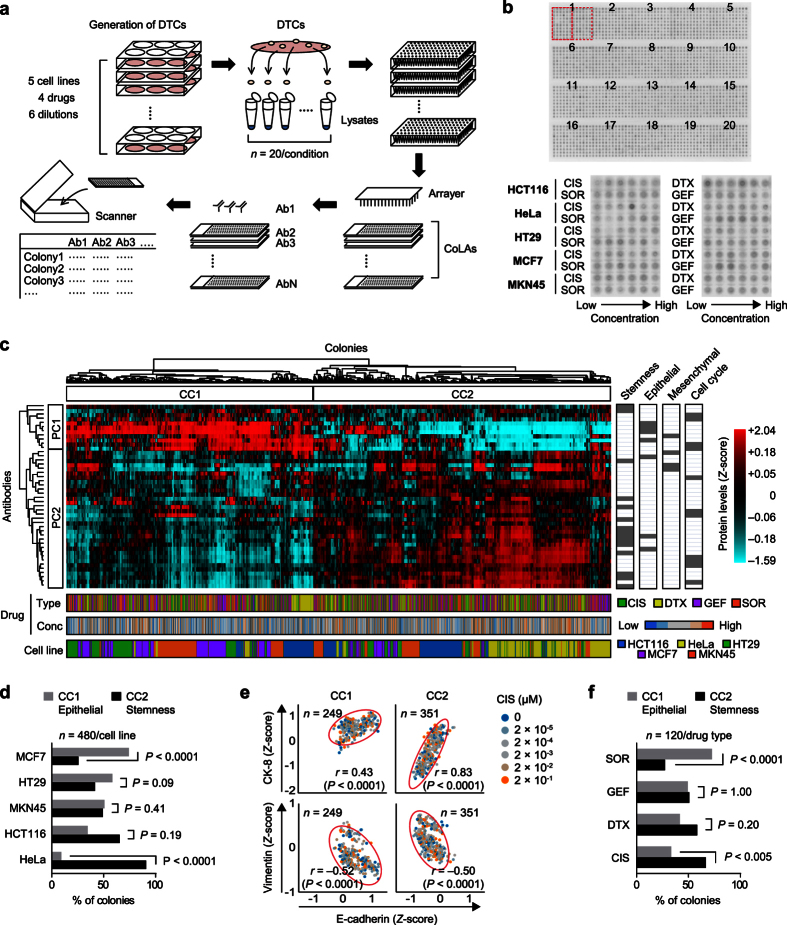
Cancer relapse occurs with substantial frequency even after treatment with curative intent. Here we studied drug-tolerant colonies (DTCs), which are subpopulations of cancer cells that survive in the presence of drugs. Proteomic characterization of DTCs identified stemness- and epithelial-dominant subpopulations, but functional screening suggested that DTC formation was regulated at the transcriptional level independent from protein expression patterns. We consistently found that α-amanitin, an RNA polymerase II (RNAPII) inhibitor, effectively inhibited DTCs by suppressing TAF15 expression, which binds to RNA to modulate transcription and RNA processing. Sequential administration of α-amanitin and cisplatin extended overall survival in a cancer-relapse mouse model, namely peritonitis carcinomatosa. Therefore, post-treatment cancer relapse may occur through non-distinct subpopulations and may be effectively prevented by α-amanitin to disrupt transcriptional machinery, including TAF15.


Conflict of interest statement

The authors declare no competing financial interests.

Figures

Figure 1
Figure 1. Distinct biological and properties of cancer cell sheets and colonies.
(a) Representative images of sheet and colony morphology of the indicated cell lines. Scale bars = 100 μm. (b) Drug sensitivities of cells in sheets and colonies. GI50 and CoI50 concentrations for each cell line were determined by a growth suppression assay and colony formation assay, respectively. Asterisks indicate no inhibition. All experiments were performed in triplicate. Error bars represent s.e.m. (c) GI50/CoI50 ratios of each drug were calculated using data in Fig. 1b. Asterisks indicate the ratio is more than 40-fold. (d) Cell cycle state of HeLa.S-Fucci2 cells in sheets and colonies. Top panels show fluorescent images of mCherry-hCdt1 (red) and mVenus-hGeminin (green) expression. Hoechst 33342 (blue) was used to stain nuclear DNA. Scale bars = 100 μm. Corresponding density scatter plots with the threshold of red, green, yellow and no color cells are shown (bottom panels). Numbers indicate percentages of each fraction.
Figure 2
Figure 2. Functional heterogeneity of cancer cell colonies.
(a) MKN45-derived untreated colonies and DTCs. CIS concentrations for the emergence of the colonies in a dose-response curve are shown. Untreated colonies were obtained in absence of CIS (light gray arrow) and DTCs were obtained after treatment with CIS at CoI50 (black arrow). Each experiment was performed in triplicate. Error bars represent s.e.m. (b) Tumor-forming capacity of individual DTCs and untreated colonies derived from MKN45. A single, one mm-diameter DTC and untreated colony (containing approximately 1.0 × 104 cells) were randomly picked and individually inoculated subcutaneously (n = 6). Sheet-derived 1.0 × 104 cells were used as a control. Tumor size was measured twice weekly. (c) Tumors were removed at 7 weeks after inoculation. Scale bar = 5 mm. (d) Pathological examination of sheet-, untreated colony-, and DTC-derived tumors with H & E staining. Scale bars = 500 μm. (e) An illustration for comparing drug sensitivity between colony-forming cells and DTC-forming cells. Untreated colonies and DTCs were diluted into single cell suspensions and re-seeded into wells with a CoI50 concentration of each drug. (f) Representative wells with colony-derived DTCs and secondary DTCs (left), and drug sensitivities of untreated colony- and DTC-forming cells (right). CoI50 concentrations were determined based on dose-response curves for the number of colonies. Each experiment was performed in triplicate. Error bars represent s.e.m.
Figure 3
Figure 3. Protein levels in individual DTCs.
(a) Schematic overview of CoLA analysis. A total of 2400 colonies including both DTCs and untreated colonies were generated by a colony formation assay. Colonies were then individually isolated, lysed and arranged in 384-well plates. The lysates were spotted onto a glass slide embedded with a nitrocellulose membrane to produce a CoLA. Each CoLA was then stained with a specific primary antibody and scanned to quantify spot intensities. (b) The CoLA platform. Spots were arranged into five columns and four rows for 20 sets of biological replicates (top panel, colloidal gold stain). Each set contains colony lysates from different drug treatment conditions of five cell lines indicated in red boxes (bottom panel). (c) Protein levels of 2400 individual colony lysates were classified by two-way hierarchical clustering. Drug types, concentrations and cell lines are indicated at the bottom. Functional categories of proteins include stemness, epithelial, mesenchymal, and cell cycle markers as indicated on the right. Two major clusters were evident in both the colony axis (CC1 and CC2) and protein axis (PC1 and PC2). Values were normalized by colloidal gold-stained total protein and Z-score transformation was used for analysis. (d) The distribution of cell line in CC1 and CC2. The two-sided P values were obtained with Fisher’s exact test. (e) Correlation of epithelial (E-Cadherin and CK-8) and mesenchymal markers (vimentin) in individual colonies including both DTCs and untreated colonies from CIS condition. Scatter plots of E-Cadherin vs. CK-8 (top panels) or vimentin (bottom panels) are shown with Pearson’s correlation coefficient (r) used to assess the correlations. (f) The distribution of drug type in CC1 and CC2 in MKN45 DTCs. The two-sided P values were obtained with Fisher’s exact test.
Figure 4
Figure 4. Association between DTC formation and transcriptional regulation.
(a) CoLA analysis of the indicated cell surface markers in individual untreated colonies and DTCs of MKN45. MKN45 DTCs emerged in the presence of 0.2 μM CIS. Red lines indicate the mean values of individual colonies for each condition. *P < 0.05, **P < 0.01, Student’s t test. (b) Validation of CoLA data using fluorescence immunocytochemistry. Representative colonies that stained with anti-CD44 antibodies (green), ROS indicator (red), and Hoechst 33342 for DNA (blue) are shown. (c) Corresponding dot plots show the fluorescence intensity of indicated proteins in individual untreated colonies and DTCs. Black to white gradient indicates ROS intensity of individual colonies. (d) CoLA analysis of indicated pluripotency-associated proteins. *P < 0.05, Student’s t test. (e) The abundance of indicated mRNAs was quantified using quantitative (q)RT-PCR (normalized by GAPDH mRNA levels). Red lines indicate the mean values of individual colonies for each condition. *P < 0.05, Student’s t test. (f) Relative methylation levels of CpG regions located at the transcription start sites of pluripotency-inducing genes. GAPDH is shown as a housekeeping gene.
Figure 5
Figure 5. RNAPII-dependent colony-forming capacity.
(a) Schematic overview of molecular targeted fractions in the context of gene expression and protein synthetic processes. (b) Inhibitory compound screening based on GI50 and CoI50. GI50 and CoI50 values of trichostatin A (TSA), actinomycin D (AMD), α-amanitin (α-AMA) and cycloheximide (CHX) are shown. All experiments were performed in triplicate. Error bars represent s.e.m. An asterisk indicates no inhibition. (c) Inhibition of colony formation by temporal treatment (0, 4 and 24 hours) with each compound. Black arrows indicate a concentration that is 50-fold greater than the CoI50 value for each compound, which is the concentration used for colony formation assay with temporal drug treatment. (d) Validating the effect of α-AMA treatment on colony formation in five cancer cell lines. Cells were temporally (4 or 24 hours) treated with each compound prior to cell seeding. Colony numbers relative to those with no treatment are shown as a percentage. (e) Body weights of nude mice after peritoneal injection of MKN45 cells treated with DMSO or α-AMA for 4 hours. Each group of experiments was performed in replicates (n = 3). Error bars represent s.e.m. *P < 0.05, **P < 0.01, Student’s t test. (f) Mesentery with disseminated and mature peritoneal nodules in DMSO or α-AMA treated groups (left). The number of nodules at 28 days after peritoneal injection of MKN45 cells (right). Each group of experiments was performed in a set of six biological replicates. Error bars represent s.e.m. **P < 0.01, Student’s t test. (g) MKN45 cells were temporally (4 hr) treated with two-fold serial dilution of α-AMA, TSA, CHX, and AMD prior to colony formation in the presence of 0.2 μM CIS. Black arrows indicate CoI25 value of CIS-untreated colonies for each compound.
Figure 6
Figure 6. Identification of TAF15 as a mediator of RNAPII activity against DTC formation.
(a) RNA-binding protein-coding genes. The green area shows corresponding gene-term association previously reported (top panel). The expression level of TAF15 mRNAs was quantified using qRT-PCR (relative to GAPDH mRNA levels, bottom panel). *P < 0.05, Student’s t test. (b) Methylation levels of CpG regions at the TAF15 transcription start site. (c) TAF15 protein levels in DTCs and untreated colonies derived from MKN45 cells by Western blot. The band intensities were relative to those of GAPDH. The numerical values are the relative intensity. (d) The expression level of TAF15 mRNAs quantified using qRT-PCR in MKN45 cells treated with DMSO or α-AMA over a time course relative to respective GAPDH mRNA. ***P < 0.001, Student’s t test. (e) TAF15 protein levels of MKN45 cells treated with DMSO or α-AMA over a time course by Western blot. The numerical band intensities were relative to those of respective GAPDH, and then adjusted to 1.0 in DMSO. (f) Both α-AMA treatment and TAF15 siRNA transfection induces morphological changes in MKN45 cells. Scale bars = 20 μm. Corresponding box plots show length of cells (n = 20) in indicated conditions. **P < 0.01, ***P < 0.001, Student’s t test. (g) Colony formation assay of MKN45 cells transfected with two independent TAF15-targeting siRNAs (si-TAF15) or a scramble siRNA (Scr). MKN45 cells were transfected with siRNAs prior to colony formation in the presence (DTCs) and absence (untreated) of 0.2 μM CIS. si-TAF15 #1 and #2 targeted the 3′-untranslated and coding regions, respectively. Each experiment was performed in triplicate. Error bars represent s.e.m.
Figure 7
Figure 7. α-AMA/CIS-combined treatment restraining PC in nude mice.
(a) Body weight changes of PC mice treated with α-AMA alone (α-AMA), CIS alone (CIS), serial administration of α-AMA and CIS (α-AMA/CIS) or no treatment. Each group of experiments was performed in a set of 16 biological replicates. Error bars represent s.e.m. (b) Representative images of disseminated and mature peritoneal nodules in mesentery tissue from no treatment, CIS, α-AMA, and α-AMA/CIS groups. Scale bars = 10 mm. (c) A comparison of the number of nodules in PC mice with no treatment and CIS, α-AMA, and α-AMA/CIS groups 28 days after MKN45 cell inoculation. Each group of experiments was performed in five or six biological replicates. ***P < 0.001, Student’s t test. ns, not significant. (d) Kaplan-Meier plots of PC mice treated with α-AMA and α-AMA/CIS. Each group of experiments was performed in a set of 10 biological replicates. Number of mice at risk P values were determined using the log-rank test. (e) A comparison of the average time to death of the no treatment, CIS, α-AMA, and α-AMA/CIS groups. The α-AMA/CIS group exhibited significantly longer time to death. Error bars represent ± SEM. *P < 0.05, Mann-Whitney U test. ns, not significant. (f) LC-MS analysis of α-AMA from the liver. MS peaks from α-AMA authentic standard and representative liver sample (left). MS peak at m/z 919.3619 was identified as α-AMA. α-AMA levels in liver tissues from the α-AMA and α-AMA/CIS groups (right). Red lines indicate the median values of individual liver samples for each condition. LC-MS, liquid chromatography-mass spectrometry; α-AMA, α-amanitin; CIS, cisplatin.

Similar articles

Cited by

References

    1. Sakuramoto S. et al.. Adjuvant chemotherapy for gastric cancer with S-1, an oral fluoropyrimidine. N Engl J Med 357, 1810–1820 (2007). - PubMed
    1. Paoletti X. et al.. Benefit of adjuvant chemotherapy for resectable gastric cancer: a meta-analysis. JAMA 303, 1729–1737 (2010). - PubMed
    1. Yachida S. et al.. Distant metastasis occurs late during the genetic evolution of pancreatic cancer. Nature 467, 1114–1117 (2010). - PMC - PubMed
    1. Campbell P. J. et al.. The patterns and dynamics of genomic instability in metastatic pancreatic cancer. Nature 467, 1109–1113 (2010). - PMC - PubMed
    1. O’Connell M. J. et al.. Improving adjuvant therapy for rectal cancer by combining protracted-infusion fluorouracil with radiation therapy after curative surgery. N Engl J Med 331, 502–507 (1994). - PubMed

Publication types

MeSH terms