. 2016 Jul;22(7):1026-43.
doi: 10.1261/rna.055871.116. Epub 2016 May 10.

The PUF binding landscape in metazoan germ cells

Affiliations

The PUF binding landscape in metazoan germ cells

Aman Prasad et al. RNA. 2016 Jul.

Abstract

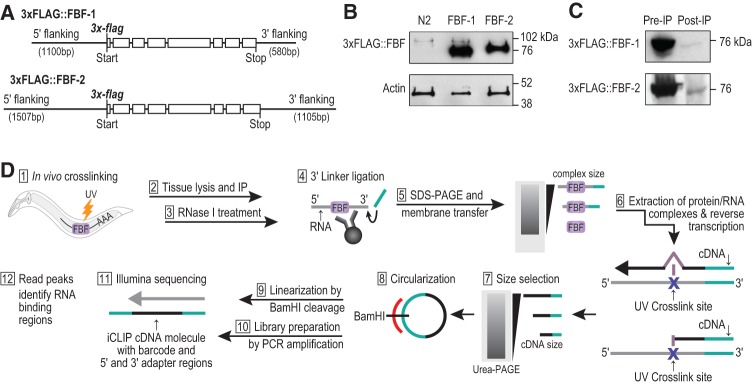
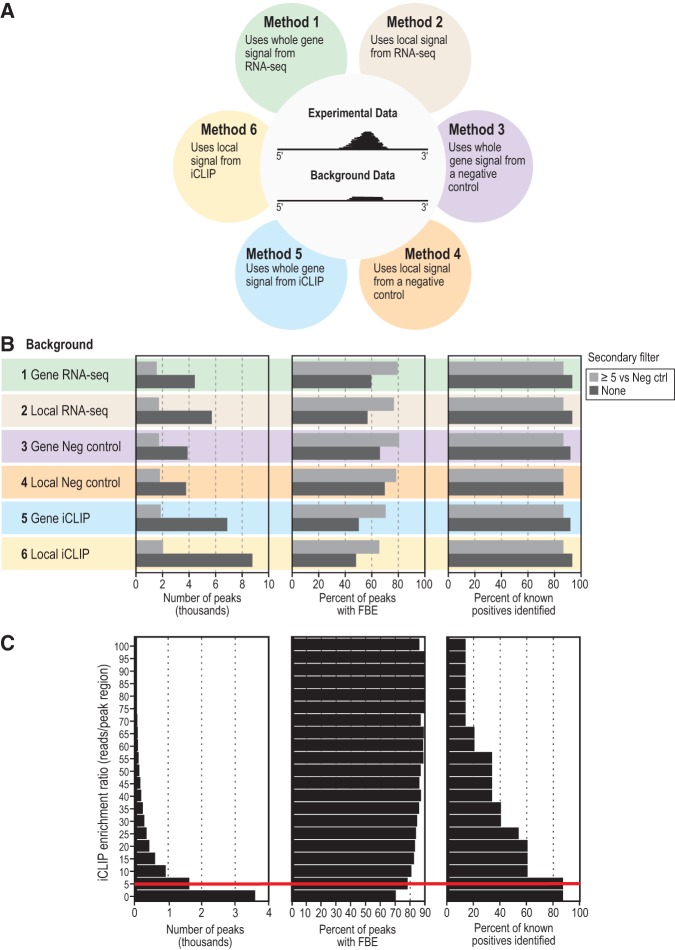
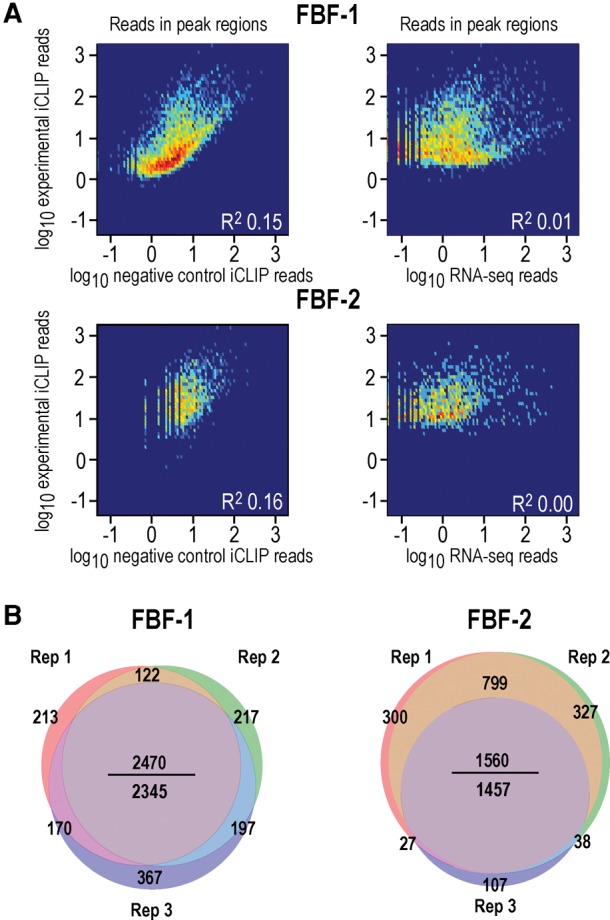
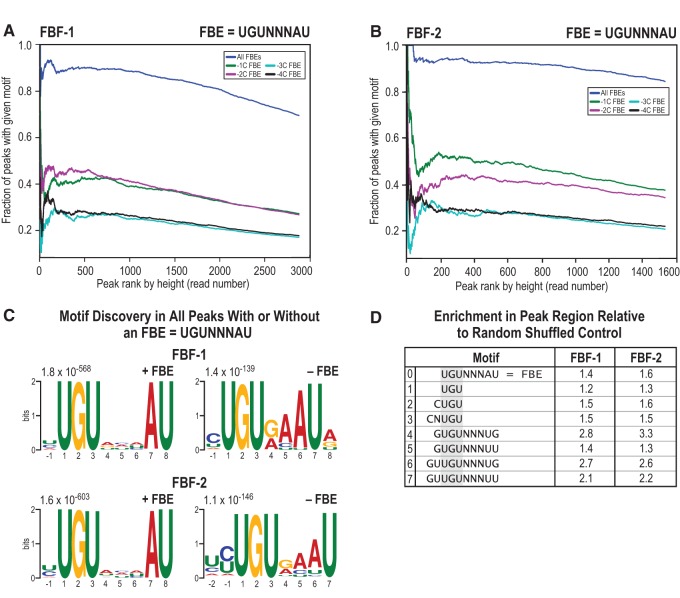
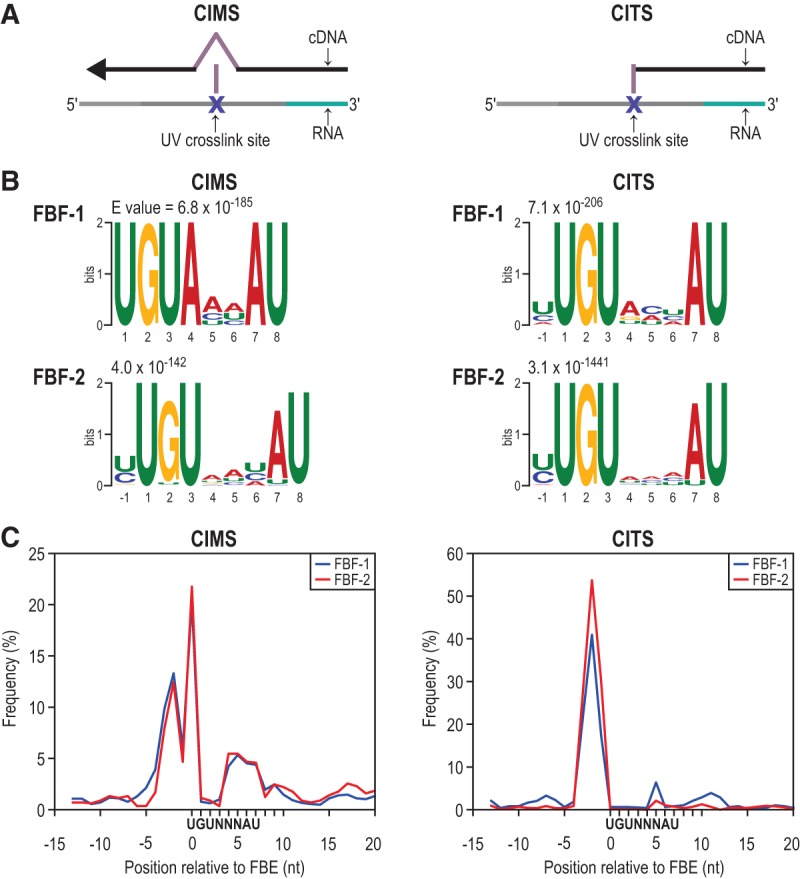
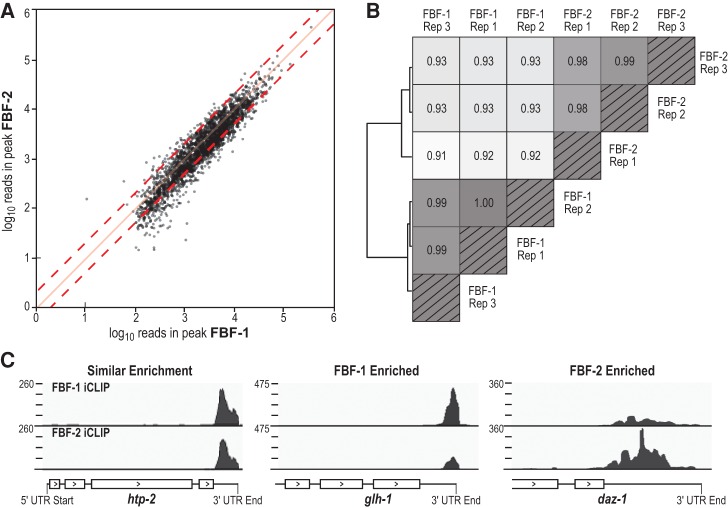
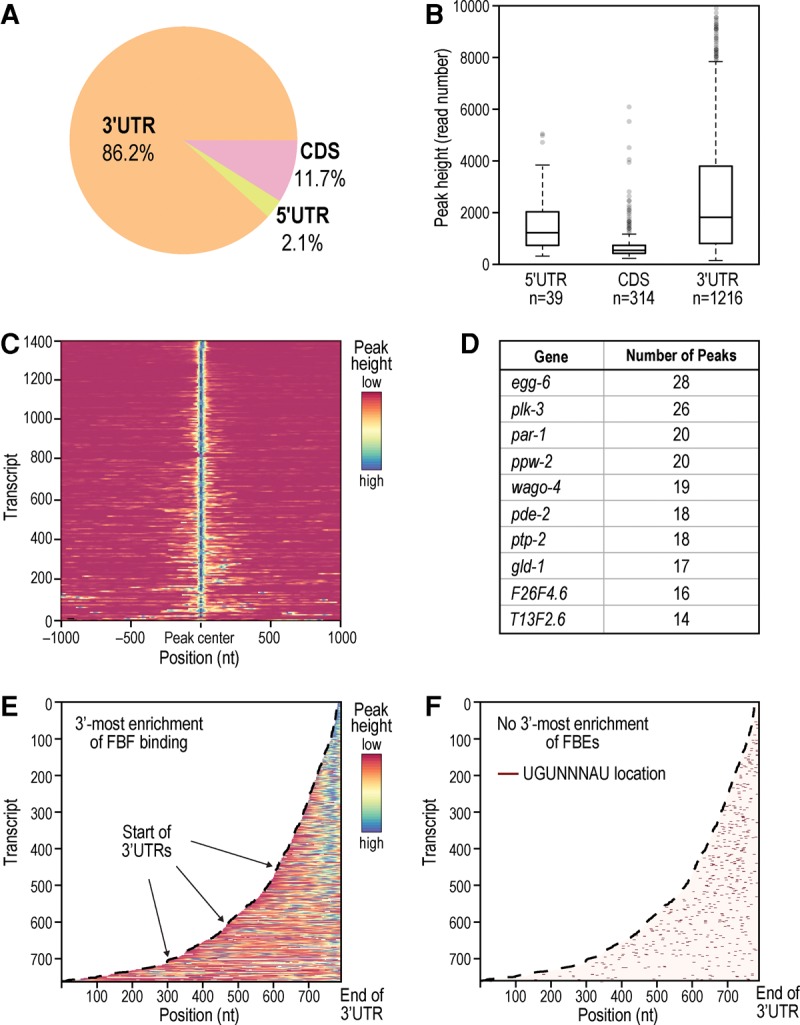
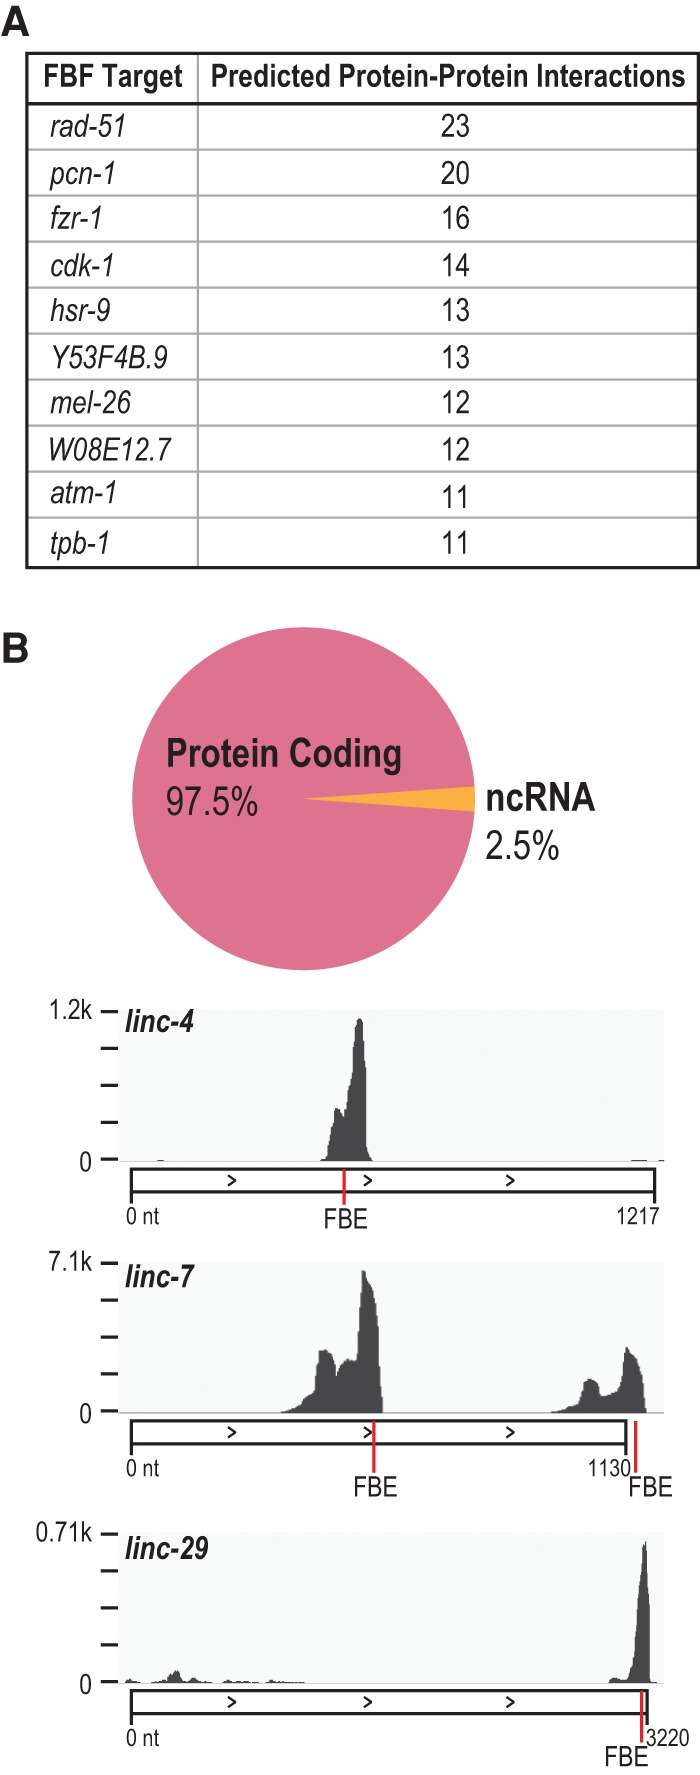
PUF (Pumilio/FBF) proteins are RNA-binding proteins and conserved stem cell regulators. The Caenorhabditis elegans PUF proteins FBF-1 and FBF-2 (collectively FBF) regulate mRNAs in germ cells. Without FBF, adult germlines lose all stem cells. A major gap in our understanding of PUF proteins, including FBF, is a global view of their binding sites in their native context (i.e., their "binding landscape"). To understand the interactions underlying FBF function, we used iCLIP (individual-nucleotide resolution UV crosslinking and immunoprecipitation) to determine binding landscapes of C. elegans FBF-1 and FBF-2 in the germline tissue of intact animals. Multiple iCLIP peak-calling methods were compared to maximize identification of both established FBF binding sites and positive control target mRNAs in our iCLIP data. We discovered that FBF-1 and FBF-2 bind to RNAs through canonical as well as alternate motifs. We also analyzed crosslinking-induced mutations to map binding sites precisely and to identify key nucleotides that may be critical for FBF-RNA interactions. FBF-1 and FBF-2 can bind sites in the 5'UTR, coding region, or 3'UTR, but have a strong bias for the 3' end of transcripts. FBF-1 and FBF-2 have strongly overlapping target profiles, including mRNAs and noncoding RNAs. From a statistically robust list of 1404 common FBF targets, 847 were previously unknown, 154 were related to cell cycle regulation, three were lincRNAs, and 335 were shared with the human PUF protein PUM2.

Keywords: C. elegans; FBF; PUF proteins; RNA; RNA-binding proteins; iCLIP; peak-calling methods; target mRNAs.


Figures

FIGURE 1.
FIGURE 1.
FLAG-tagged FBF-1 and FBF-2 transgenes used for iCLIP in intact animals. (A) Transgenes encoding FLAG-tagged FBF-1 and FBF-2. Depicted gene regions possess wild-type fbf-1 or fbf-2 sequences with the addition of N-terminal triple FLAG tag. These constructs were incorporated into the C. elegans genome as single copies (see Materials and Methods). (B) Approximate abundance of FLAG-tagged FBF-1 and FBF-2, assayed by Western blot stained with anti-FLAG antibody. Lysates were prepared from UV crosslinked transgenic animals [FBF-1: fbf-1(0) 3xflag::fbf-1 and FBF-2: fbf-2(0) 3xflag::fbf-2] or from control animals treated identically (wild-type N2). (C) Depletion of FLAG-tagged FBF-1 and FBF-2 after IP, assayed by Western blot from transgenic animals as in B. (D) iCLIP workflow begins with live animals and ends with high-throughput sequencing to elucidate the genome-wide targets of FBF-1 and FBF-2.
FIGURE 2.
FIGURE 2.
Comparative analysis of six peak calling methods. (A) Six methods for peak calling in iCLIP data. Methods were generated using one of three backgrounds, each within one of two genomic regions. The two genomic regions tested were (i) all exons of the target transcript (termed “whole gene signal”) and (ii) the 500-bp genomic region around the putative peak (termed “local signal”). The three types of background coverage were RNA-seq (Methods 1 and 2), parallel iCLIP from a negative control strain (Methods 3 and 4), or the FBF iCLIP data itself (Methods 5 and 6). (B) Effects of the six methods of peak calling on number of peaks (left), presence of a canonical FBF binding element (FBE) in the peak (middle), and the fraction of 15 known FBF target mRNAs correctly identified as targets (right). Method numbers and coloring are the same as in Figure 2A. The effect of a secondary filter was also tested, shown as light gray bars. The secondary filter required a minimum enrichment ratio of fivefold more experimental iCLIP reads to negative control iCLIP reads within local (500 bp) peak region. (C) Effect of changing the minimum iCLIP enrichment ratio for the secondary filter on the identification of targets. The iCLIP enrichment ratio refers to the ratio of experimental iCLIP reads to negative control iCLIP reads within local (500 bp) peak region. (Left) Range of iCLIP enrichment ratios queried. (Middle) Percentage of peaks harboring an FBE at each enrichment ratio shown on left. Because FBEs are scored in sequences defined by merging peak regions within and between replicates, increasing the filtering ratio can decrease the width of the consensus peak, resulting in the loss of an FBE. (Right) Percentage of 15 validated FBF target mRNAs identified at each enrichment ratio shown on left. A red line highlights the enrichment ratio cutoff of 5, at which the percentage of peaks harboring an FBE is greatly increased without lowering the number of identified positive control target mRNAs.
FIGURE 3.
FIGURE 3.
FBF-1 and FBF-2 iCLIP is specific and reproducible. (A, left) Heatmaps of FBF iCLIP peak heights (y-axis) versus negative control iCLIP peak heights in the same regions (x-axis). In these heatmaps, the secondary filter of minimum iCLIP enrichment ratio was not applied, so that the full range of experimental and negative control peaks is visible. Overall, the correlations are low (R2 = 0.15–0.16), indicating that experimental peaks are distinct from background reads. (Right) Heatmaps of FBF iCLIP peak heights (y-axis) versus RNA-seq coverage in the same regions (x-axis). FBF iCLIP captured binding over a large range of RNA expression levels. Some iCLIP peaks were positively correlated to RNA abundance. This could reflect that peak heights are a function of both binding affinity and RNA abundance (Kishore et al. 2011). (B) Venn diagrams depict overlap of targets in three biological replicates of FBF-1 iCLIP (left) and three biological replicates of FBF-2 iCLIP (right). Targets are highly reproducible. In the middle of each Venn, the number above the line is total number of overlapping targets in all three replicates and the number below the line is the more stringent total number of overlapping targets after requiring that the same peak region on a target be identified in all the replicates. Our analysis used the more stringent bottom number.
FIGURE 4.
FIGURE 4.
Canonical as well as alternate binding motifs are enriched. (A,B). Most FBF peaks include the FBF binding element (FBE), and the occurrence of the FBE is proportional to peak height (FBE = UGUNNNAU, where N is any ribonucleotide). FBEs with a −1C or −2C, which confer higher affinity to the binding site, are enriched with opposite preference in FBF-1 and FBF-2. FBEs with an upstream cytosine at increasing distance (−3C and −4C) are less enriched. (C) The most significant motifs identified by MEME analysis of FBF peaks, after separating peaks with an FBE from peaks without an FBE. MEME analyses of peaks without an FBE reveal a shorter FBE-like 7-mer sequence. Thirty-one percent of all FBF-1 peaks and 33% of all FBF-2 peaks had a 7-mer. (D) Searching for a subset of alternate motifs exclusive of the canonical FBE (which is shown in line 0 in the table) in all peaks reveals significant enrichment (P < 0.01) relative to randomly shuffled peak sequences. Lines 1, 2, and 3 represent half-mer sequences based on the UGU trinucleotide characteristic of all PUF protein binding sites. Lines 4, 5, 6, and 7 are motifs identified in an in vitro selection study.
FIGURE 5.
FIGURE 5.
Mapping FBF-1 and FBF-2-RNA crosslink sites. (A) Diagrams of CIMS analysis (left) and CITS analysis (right). Both identify protein:RNA crosslink sites by detecting errors made in reverse transcription during cDNA library preparation. (B) The most significant motifs identified by MEME analysis in a 21-nt window centered around significant (P < 0.001) CIMS and CITS sites are the FBEs (UGUNNNAU, where N is any ribonucleotide). There is a variable nucleotide preference at the −1 and 4, 5, and 6 positions. (C) Crosslink site enrichment relative to the FBE for all FBE-containing clusters demonstrates FBF crosslinks predominantly upstream of the FBE.
FIGURE 6.
FIGURE 6.
FBF-1 and FBF-2 have highly similar binding landscapes. (A) FBF-1 and FBF-2 peak heights and peak regions are highly correlated. The FBF-2 data set was normalized to the size of the FBF-1 data set. Red dashed lines mark twofold enrichment and solid red line marks a slope of one. (B) Hierarchal clustering of correlations between and within FBF-1 and FBF-2 replicates. (C) Snapshots of enrichment differences for select targets. Coverage is given in reads per million, with the coverage range shown in the upper left.
FIGURE 7.
FIGURE 7.
Binding locations of FBF. (A) FBF primarily binds in 3′UTRs, but other binding locations are utilized. Only the tallest peak in a gene was included in this pie chart. (B) 3′UTRs also have the highest average peak height among binding locations. All 1569 peaks in mRNA are included. (C) Heatmap of peak signal within target transcripts spanning 1000 bp on either side of the primary (highest) peak. A fraction of targets (especially visible toward the bottom of the heatmap) has multiple peaks at a variable distance to the primary peak. (D) Top 10 targets with the most detected peaks. (E,F) Heatmaps of peak signal in 3′UTRs (E) and canonical FBE distribution (F). For all peaks, FBF binding is biased toward the 3′-most end while FBEs are more scattered.
FIGURE 8.
FIGURE 8.
FBF targets. (A) Top 10 targets that have predicted interactions with other FBF targets by STRING-DB analysis at a high confidence setting. These targets may be hubs in the large FBF-regulated RNA network. (B) FBF primarily targets protein-coding genes but also a small fraction of noncoding RNA (ncRNA). Snapshots of FBF binding to long noncoding RNA (lincRNA) targets are shown, with the combined FBF-1 and FBF-2 raw coverage depth on the y-axis. FBE locations in the peak marked in red.
FIGURE 9.
FIGURE 9.
Model of in vivo FBF-mediated RNA regulation. FBF associates with RNA motifs to repress its targets (especially transcripts that encode cell cycle regulators as depicted here), and thereby promote GSC self-renewal. Our work expands the repertoire of FBF binding (shown with relative peak heights) to locations other than the 3′UTR, to lincRNAs, and to motifs other than the canonical FBE. Enriched crosslinking regions (orange marks) indicate regions of close protein–RNA interaction in vivo. Our model depicts multiple FBFs simultaneously bound on a single RNA, but a caveat from our data is that multiple peaks may represent a population of single binding events.

Similar articles

Cited by

References

    1. Ahringer J, Kimble J. 1991. Control of the sperm-oocyte switch in Caenorhabditis elegans hermaphrodites by the fem-3 3′ untranslated region. Nature 349: 346–348. - PubMed
    1. Anko ML, Muller-McNicoll M, Brandl H, Curk T, Gorup C, Henry I, Ule J, Neugebauer KM. 2012. The RNA-binding landscapes of two SR proteins reveal unique functions and binding to diverse RNA classes. Genome Biol 13: R17. - PMC - PubMed
    1. Bailey TL, Boden M, Buske FA, Frith M, Grant CE, Clementi L, Ren J, Li WW, Noble WS. 2009. MEME SUITE: tools for motif discovery and searching. Nucleic Acids Res 37: W202–W208. - PMC - PubMed
    1. Bernstein D, Hook B, Hajarnavis A, Opperman L, Wickens M. 2005. Binding specificity and mRNA targets of a C. elegans PUF protein, FBF-1. RNA 11: 447–458. - PMC - PubMed
    1. Brenner S. 1974. The genetics of Caenorhabditis elegans. Genetics 77: 71–94. - PMC - PubMed

Publication types

MeSH terms