. 2016 Oct;1858(10):2290-2304.
doi: 10.1016/j.bbamem.2016.04.016. Epub 2016 May 6.

The cellular membrane as a mediator for small molecule interaction with membrane proteins

Affiliations

The cellular membrane as a mediator for small molecule interaction with membrane proteins

Christopher G Mayne et al. Biochim Biophys Acta. 2016 Oct.

Abstract

The cellular membrane constitutes the first element that encounters a wide variety of molecular species to which a cell might be exposed. Hosting a large number of structurally and functionally diverse proteins associated with this key metabolic compartment, the membrane not only directly controls the traffic of various molecules in and out of the cell, it also participates in such diverse and important processes as signal transduction and chemical processing of incoming molecular species. In this article, we present a number of cases where details of interaction of small molecular species such as drugs with the membrane, which are often experimentally inaccessible, have been studied using advanced molecular simulation techniques. We have selected systems in which partitioning of the small molecule with the membrane constitutes a key step for its final biological function, often binding to and interacting with a protein associated with the membrane. These examples demonstrate that membrane partitioning is not only important for the overall distribution of drugs and other small molecules into different compartments of the body, it may also play a key role in determining the efficiency and the mode of interaction of the drug with its target protein. This article is part of a Special Issue entitled: Biosimulations edited by Ilpo Vattulainen and Tomasz Róg.

Keywords: Membrane; Membrane proteins; Molecular dynamics; Small molecules.


Figures

Figure 1
Figure 1
Membrane structure is defined by the chemical structure of lipids. A) The chemical structure of 1-palmitoyl-2-oleoyl-sn-glycero-3-phosphocholine (POPC), a prototypical lipid present in eukaryotic membranes, is comprised of a zwitterionic head group (blue), a polar glycerol group (red), and non-polar carbon tails (black/grey). B) A three-dimensional structure of an isolated phospholipid highlights the flexibility of the carbon tails which engenders the fluid and highly dynamic nature of membranes. C) By color coding the different chemical groups within each lipid, three distinct regions within a fully equilibrated POPC membrane become clear. The chemical details defined by small molecule interactions with the different lipid functional groups are major determinants of how molecules partition into the membrane.
Figure 2
Figure 2
Favorable membrane partitioning of gases. A) Illustration of the partitioning of gas molecules into the membrane from the aqueous solution from an ELS trajectory. This illustration is taken from a flooding simulation of O2 molecules (shown in red) which are initially distributed in the aqueous solution. As time progresses, O2 molecules spontaneously enter the membrane and become steadily distributed in both aqueous and lipid phases. More O2 molecules localize in the membrane than in the aqueous solution. B) Partitioning free energy profiles of O2 and NO gases in a POPC bilayer calculated using ELS trajectories and ILS. Shaded blue boxes in each plot represent the aqueous solution. Shaded green boxes represent the polar head group of the membrane. Shaded orange boxes represent hydrophobic lipid tails region. A shaded yellow box represent the interface between two membrane leaflets.
Figure 3
Figure 3
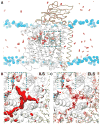
Protein tunnels facilitate the rapid delivery of O2 in CcO ba3. A) A side-view image of an O2 simulation in CcO ba3 illustrates the entry of substrate O2 to CcO ba3 from the membrane. Small red balls represent O2 molecules distributed during the simulations. Dashed green box highlights the catalytic site of O2, consisting of a heme iron (green ball) and a copper ion (orange ball). Cyan spheres represent phosphorus atoms of membrane lipids. B) Top-view image highlight highly favorable O2 binding regions calculated from ILS. The red surfaces correspond to the partitioning ΔG isosurface of −3.0 kcal/mol. C) Top-view image highlights the collection of O2 molecules that partition in the protein during ELS simulations.
Figure 4
Figure 4
Partitioning profiles of inhaled anesthetics into a POPC membrane. A) Snapshot of the POPC membrane used in the simulations. Water and ions are omitted for clarity. The color of the atom groups in this image corresponds to the color of the curves in the density profiles. B) Density profile of the simulated systems used to demarcate the regions of the membrane for analysis of anesthetic–membrane interactions. Here, total POPC density is shown as the black dashed line and water density is shown as the light blue line. POPC density was further subdivided into tail (gray), glycerol (red), phosphate (gold), and choline (blue) density. The colors of the curves correspond to the color of the atoms shown in (a). C) PMF for inserting desflurane (blue), isoflurane (green), sevoflurane (orange), and propofol (red) into the membrane. All anesthetics show a distinct energy minimum at the interfacial region, while there is negligible energy difference between the bulk aqueous environment and midpoint of the lipid bilayer. D) Representative snapshot of (starting on left and moving right) desflurane, isoflurane, sevoflurane, and propofol in the umbrella sampling simulations showing the low energy conformation at the amphipathic boundary of the membrane. Figure reprinted from Arcario et al. [89].
Figure 5
Figure 5
Membrane partitioning of anesthetics facilitates binding to modulation sites of ion channels. A) Simulating high concentrations of desflurane (43 desflurane molecules, 1:5 ratio with lipid) demonstrated partitioning to the amphipathic glycerol region of the membrane within 100 ns. Two different paths of desflurane are shown, colored by simulation time, which exemplify membrane partitioning of inhaled anesthetics. B) Simulations employing high concentrations of desflurane were used to “flood” the GLIC protein embedded in a POPC membrane. Following the rapid partitioning of desflurane molecules into the membrane, several molecules spontaneously bound to the transmembrane domain, revealing an inner and outer binding site. The desflurane molecule forms several non-specific contacts within the inner binding site (top inset). Notably, the binding site near the same location within the membrane where desflurane partitions (bottom inset).
Figure 6
Figure 6
Partitioning profile of estradiol in a POPC membrane. A) Snapshot after 200 ns illustrating multiple copies of estradiol in their preferred locations and orientations. The membrane consisted of POPC lipids and water molecules have been omitted for clarity. Estradiol is shown in stick (licorice) representation (C, cyan; O, red). B) To describe the orientation of the estradiol within the bilayer, an axis was defined pointing from O-17 to O-3, and an angle was measured with respect to the bilayer normal. C) The angle distribution of estradiol is shown in the lipid bilayer (red) or in bulk solution (blue). The angle distribution computed for an isotropic system (green) is shown for reference. D) Dependence of probability function for orientation of estradiol in the bilayer; the probability is shown in 2D plot, where the color changes from red to blue with increasing probability.
Figure 7
Figure 7
Membrane-mediated drug binding mechanism of CYP3A4. The binding pathway of progesterone was reconstructed by combining independent equilibrium simulations of progesterone along the putative access tunnel (shown in green-to-blue colorscale, stick representation), and membrane-partition simulations (shown in dark red-to-gold colosrcale). Heme cofactor, located in the active site of the enzyme, is shown in magenta stick representation.
Figure 8
Figure 8
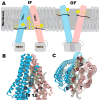
Lipid binding to Pgp in its IF and OF states. a) Schematic representation of IF and OF conformations of Pgp. Half-inserted and fully inserted lipid molecules are shown in broken and solid yellow lines, respectively. b) Lipid binding through both probable drug entry portals (TM4&6 and TM10&12) in IF conformation. c) Lipid binding through both probable drug entry portals (TM1&3 and TM7&9) in OF conformation. TM helices are in cartoon representation while the initial and final conformations of lipid molecules are in white and yellow sticks, respectively. Hydrogen atoms are not shown for clarity.

Similar articles

Cited by

References

    1. Kurihara K, Okura Y, Matsuo M, Toyota T, Suzuki K, Sugawara T. A recursive vesicle-based model protocell with a primitive model cell cycle. Nat Commun. 2015;6:8352. doi: 10.1038/ncomms9352. - DOI - PMC - PubMed
    1. Ichihashi N, Yomo T. Positive roles of compartmentalization in internal reactions. Curr Opin Cell Biol. 2014;22:12–17. doi: 10.1016/j.cbpa.2014.06.011. - DOI - PubMed
    1. Saraste M. Oxidative Phosphorylation at the fin de siécle. Science. 1999;283:1488–1493. - PubMed
    1. Cho W, Stahelin RV. Membrane-protein interactions in cell signaling and membrane trafficking. Annu Rev Biophys Biomol Struct. 2005;34:119–151. - PubMed
    1. Murthy KS. Signaling for Contraction and Relaxation in Smooth Muscle of the Gut. Annu Rev Physiol. 2006;68(1):345–374. doi: 10.1146/annurev.physiol.68.040504.094707. - DOI - PubMed

Publication types

MeSH terms