. 2017 Jan;28(1):260-277.
doi: 10.1681/ASN.2015070731. Epub 2016 May 6.

Natriuretic Peptide Receptor Guanylyl Cyclase-A in Podocytes is Renoprotective but Dispensable for Physiologic Renal Function

Affiliations

Natriuretic Peptide Receptor Guanylyl Cyclase-A in Podocytes is Renoprotective but Dispensable for Physiologic Renal Function

Janina Staffel et al. J Am Soc Nephrol. 2017 Jan.

Abstract

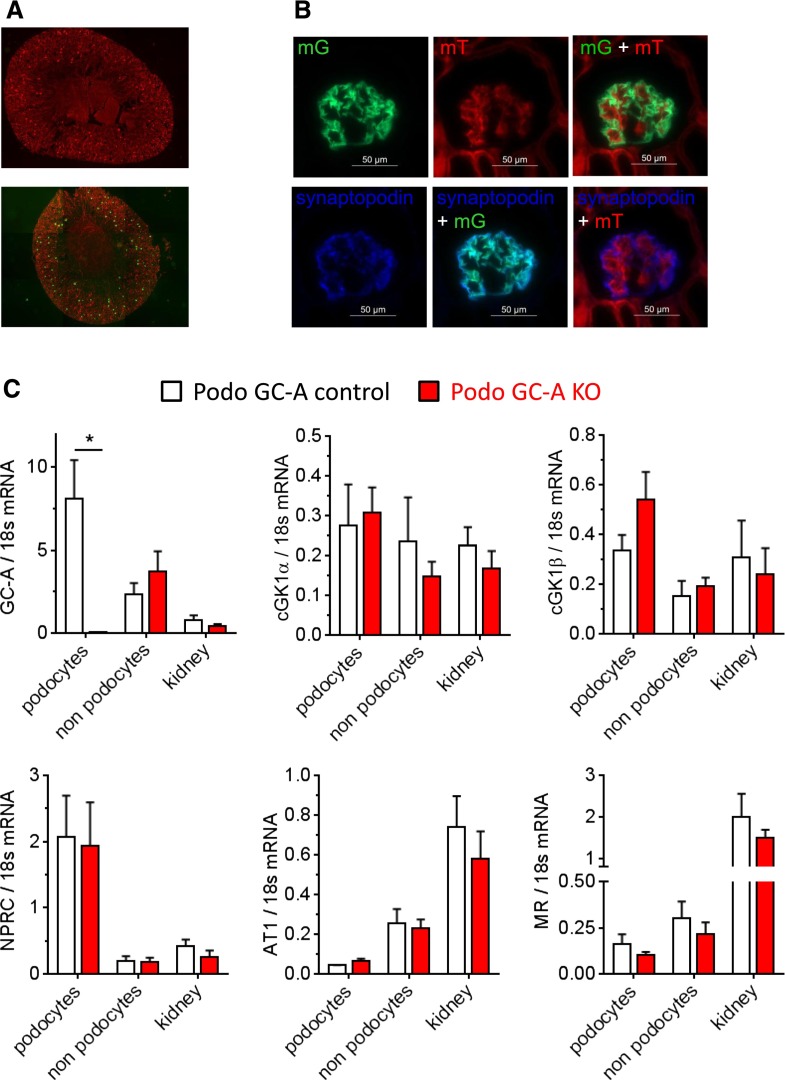
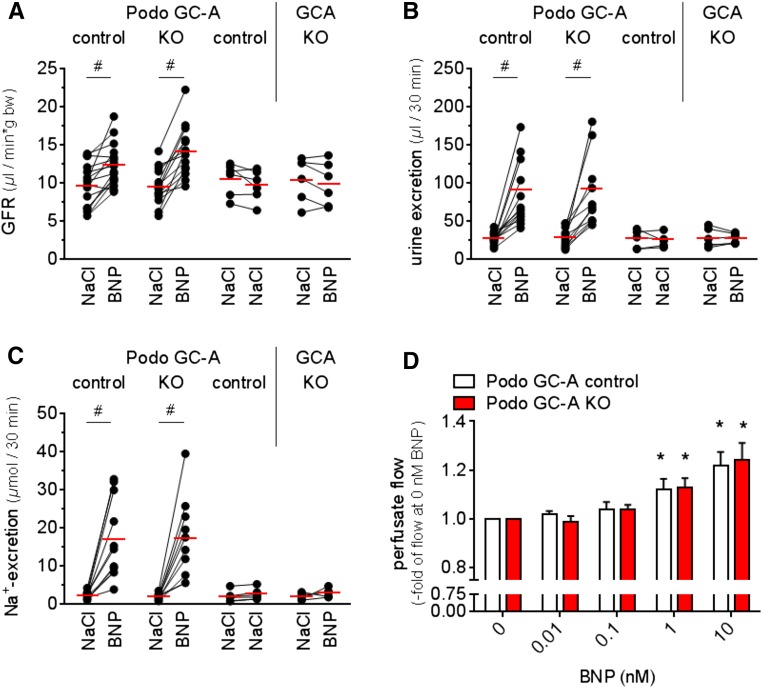
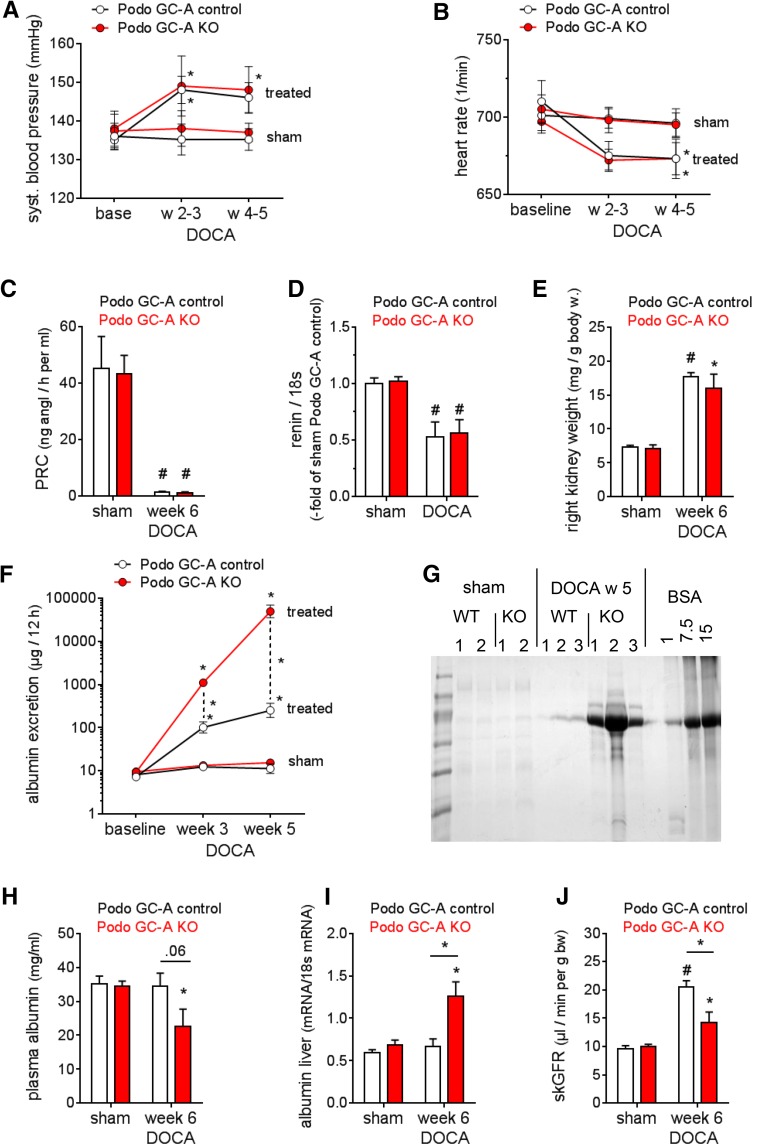
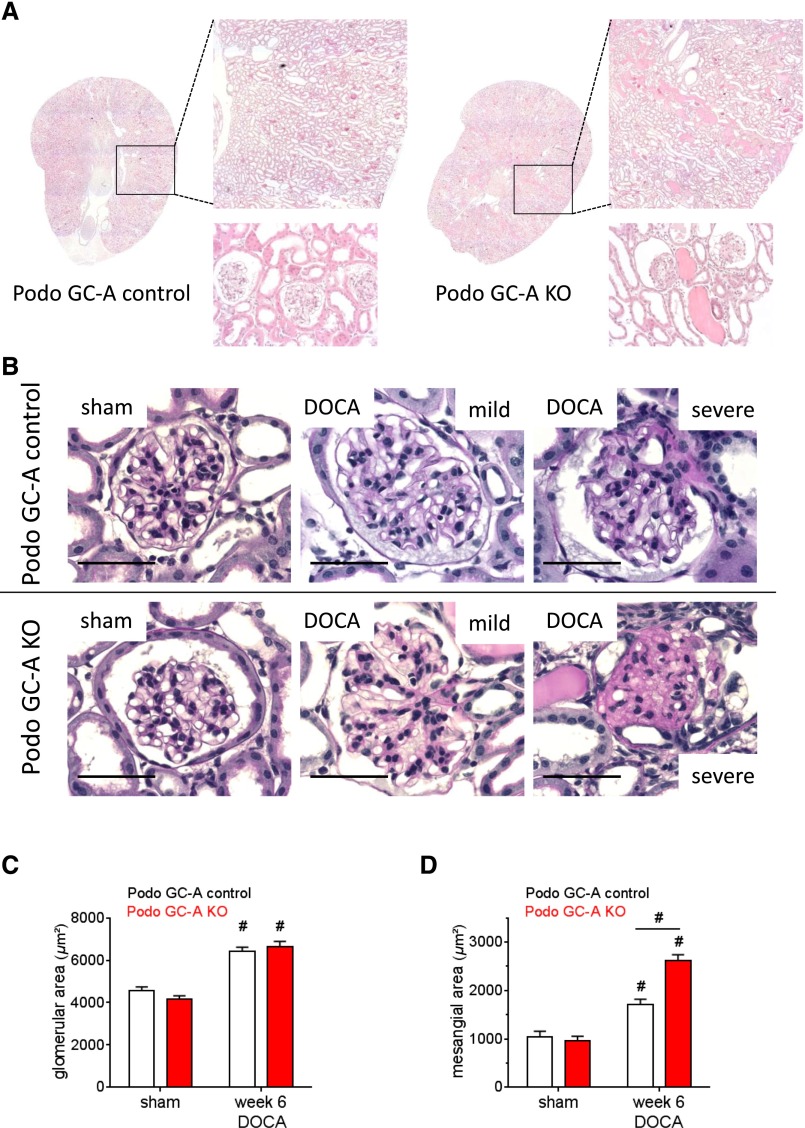
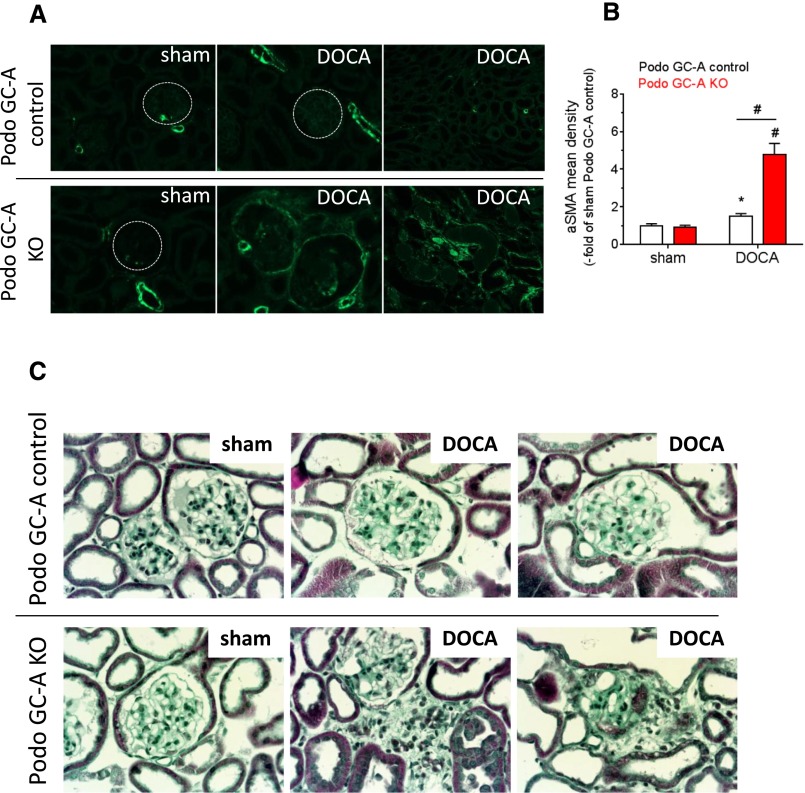
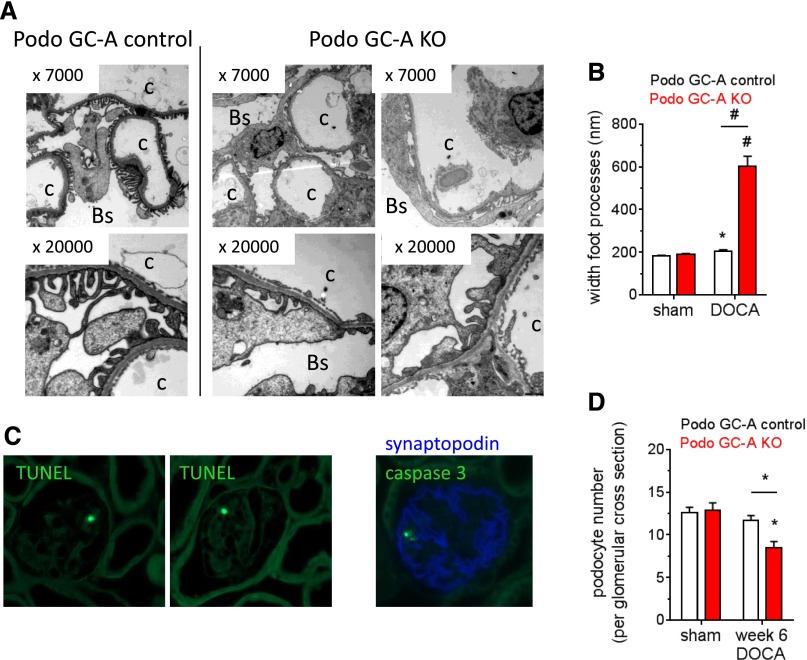
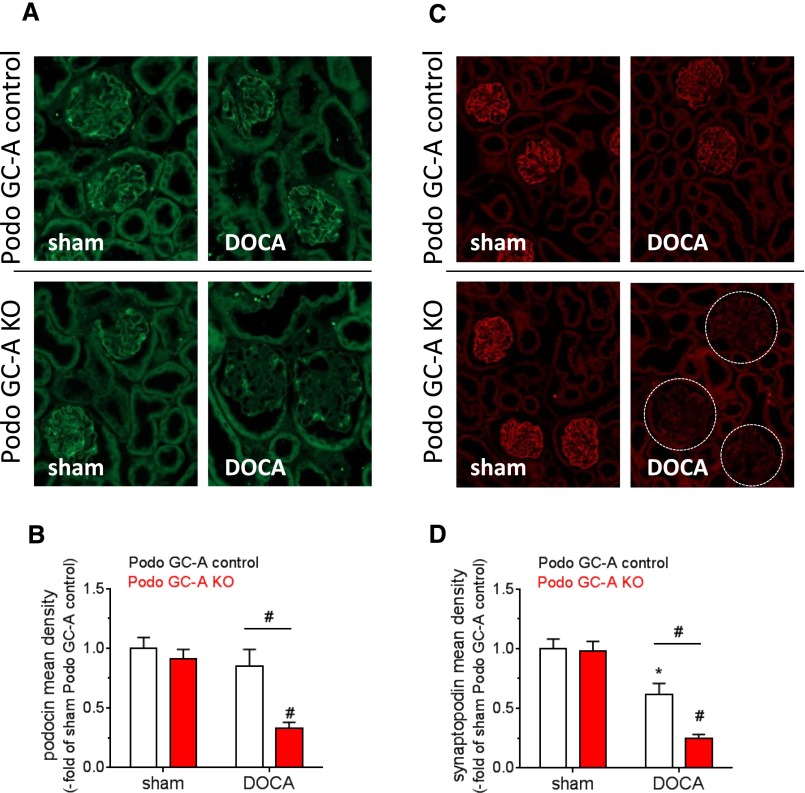
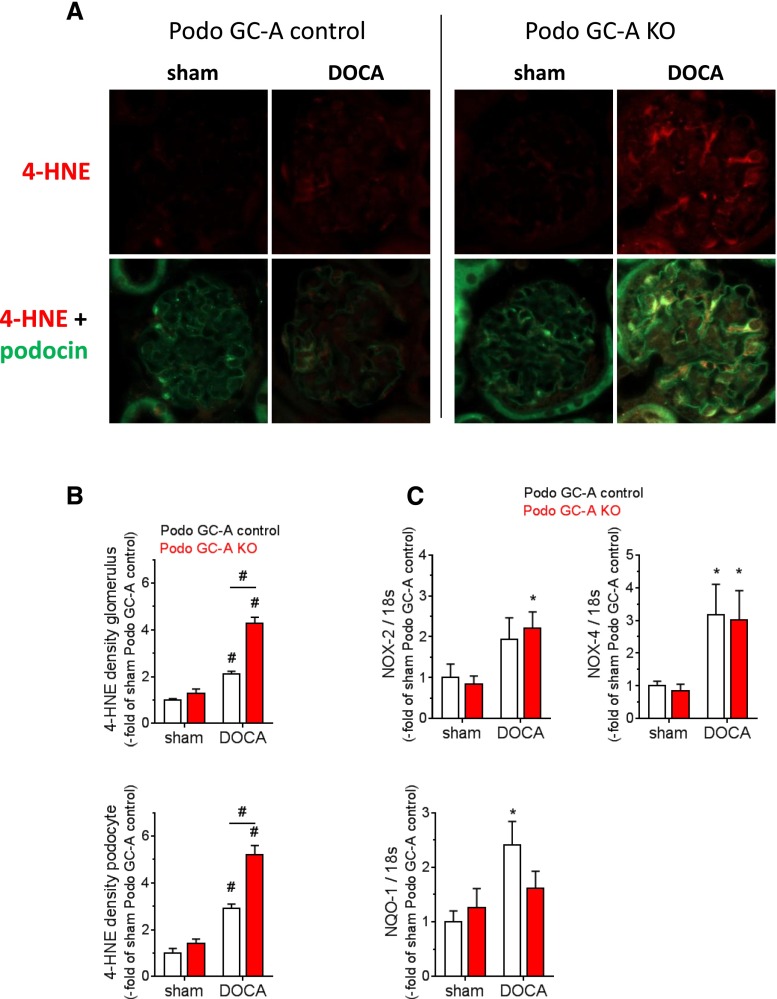
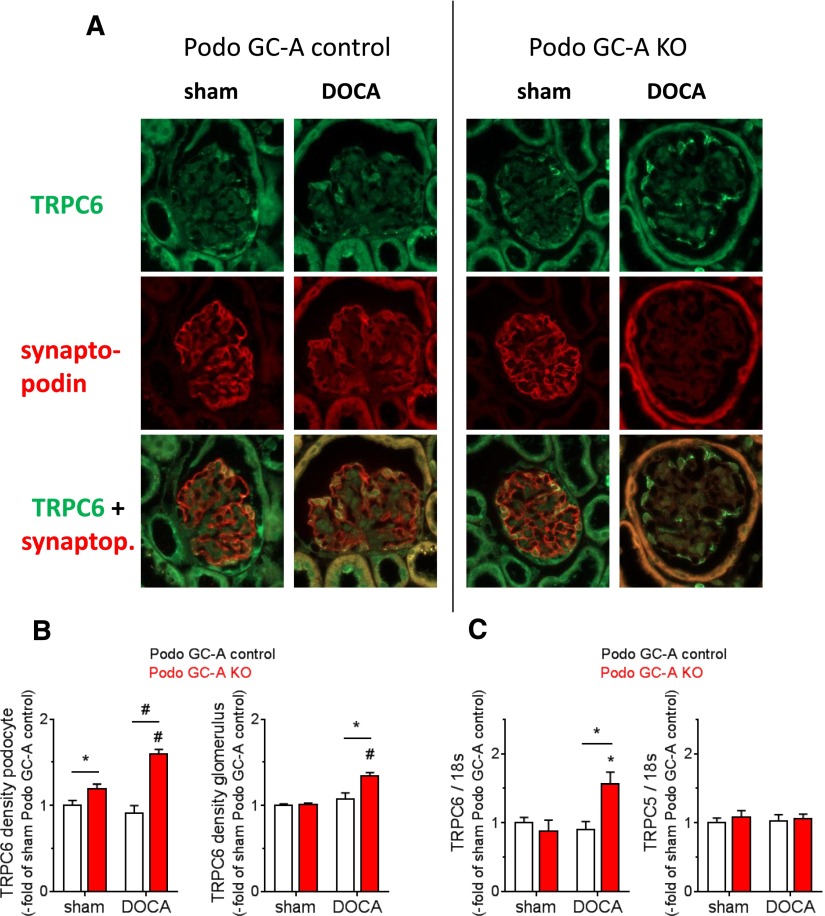
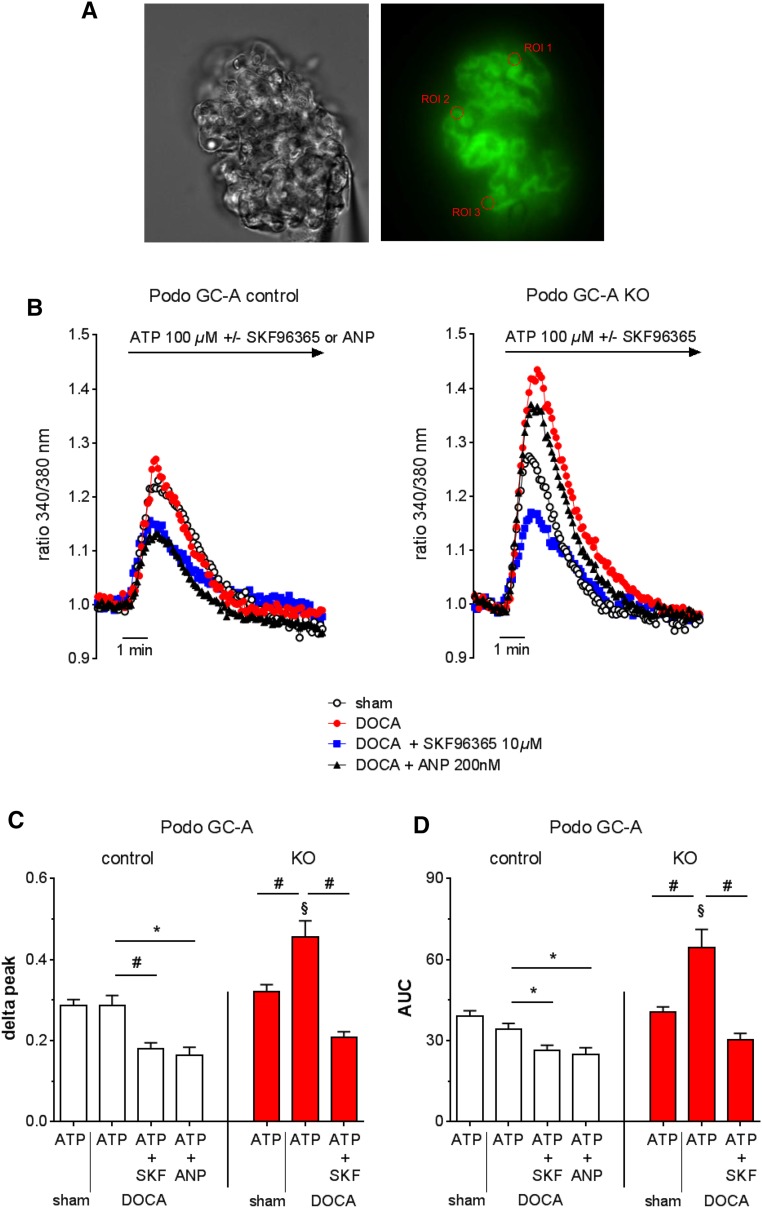
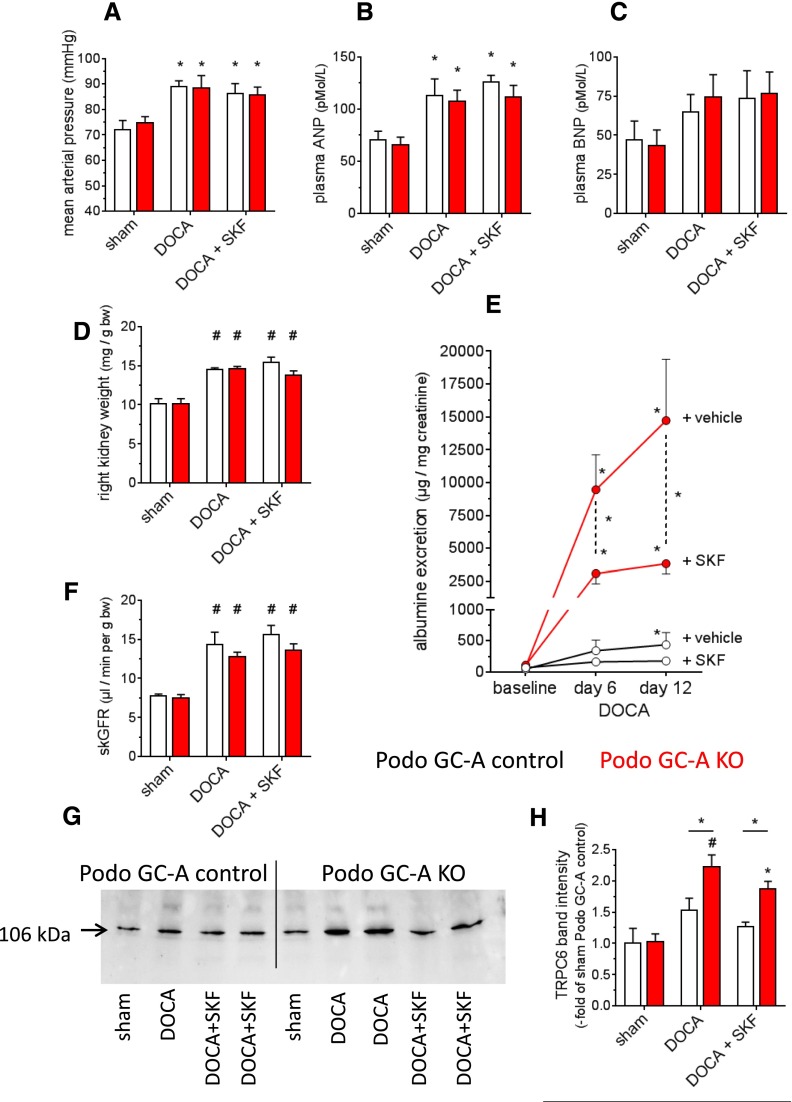
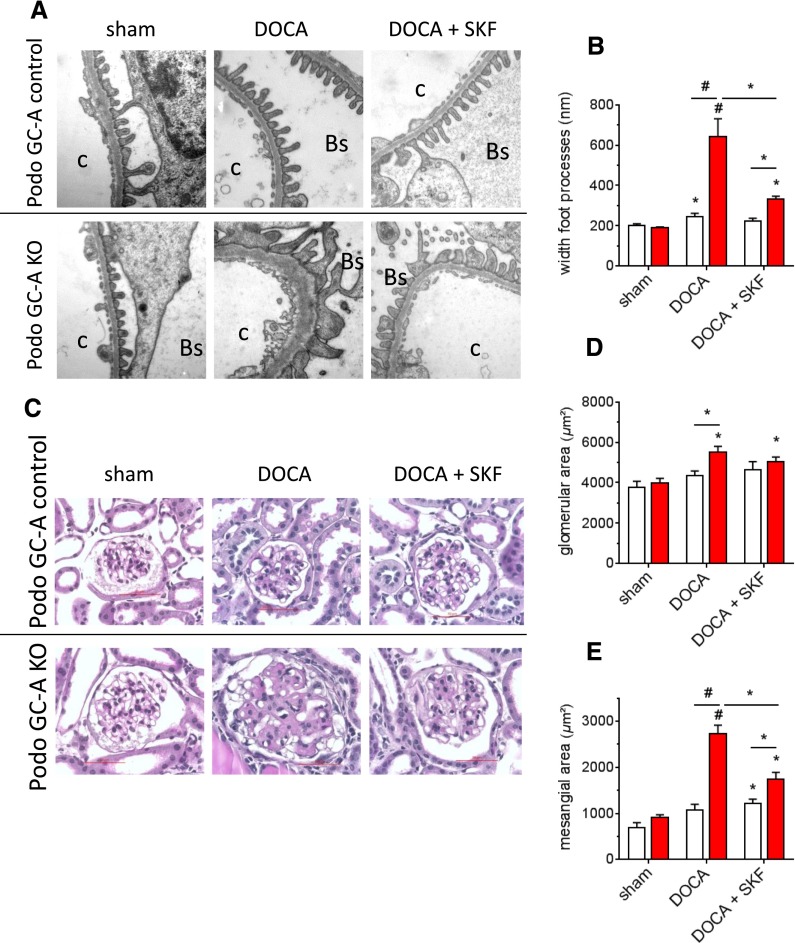
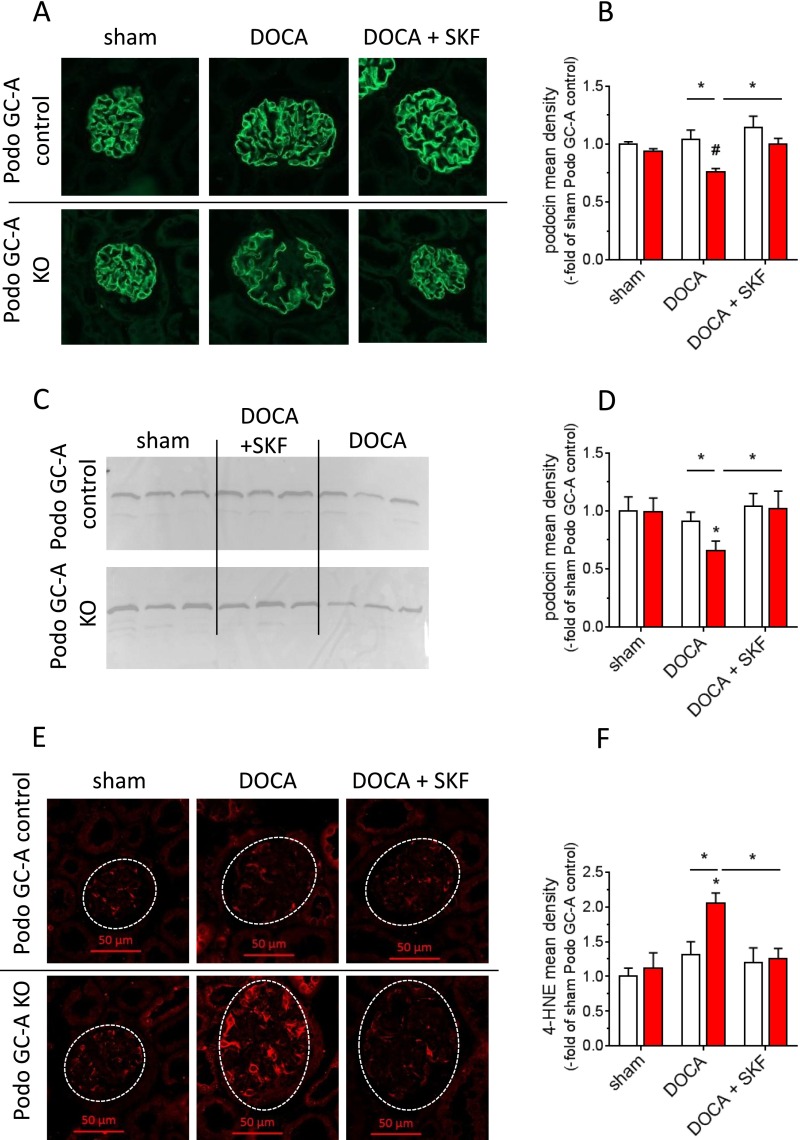
The cardiac natriuretic peptides (NPs), atrial NP and B-type NP, regulate fluid homeostasis and arterial BP through renal actions involving increased GFR and vascular and tubular effects. Guanylyl cyclase-A (GC-A), the transmembrane cGMP-producing receptor shared by these peptides, is expressed in different renal cell types, including podocytes, where its function is unclear. To study the effects of NPs on podocytes, we generated mice with a podocyte-specific knockout of GC-A (Podo-GC-A KO). Despite the marked reduction of GC-A mRNA in GC-A KO podocytes to 1% of the control level, Podo-GC-A KO mice and control littermates did not differ in BP, GFR, or natriuresis under baseline conditions. Moreover, infusion of synthetic NPs similarly increased the GFR and renal perfusion in both genotypes. Administration of the mineralocorticoid deoxycorticosterone-acetate (DOCA) in combination with high salt intake induced arterial hypertension of similar magnitude in Podo-GC-A KO mice and controls. However, only Podo-GC-A KO mice developed massive albuminuria (controls: 35-fold; KO: 5400-fold versus baseline), hypoalbuminemia, reduced GFR, and marked glomerular damage. Furthermore, DOCA treatment led to decreased expression of the slit diaphragm-associated proteins podocin, nephrin, and synaptopodin and to enhanced transient receptor potential canonical 6 (TRPC6) channel expression and ATP-induced calcium influx in podocytes of Podo-GC-A KO mice. Concomitant treatment of Podo-GC-A KO mice with the TRPC channel blocker SKF96365 markedly ameliorated albuminuria and glomerular damage in response to DOCA. In conclusion, the physiologic effects of NPs on GFR and natriuresis do not involve podocytes. However, NP/GC-A/cGMP signaling protects podocyte integrity under pathologic conditions, most likely by suppression of TRPC channels.

Keywords: albuminuria; cardiac natriuretic peptides; podocyte; progression of renal failure.


Figures

Figure 1.
Figure 1.
GC-A is effectively and specifically deleted in podocytes of Podo GC-A KO mice. (A and B) To determine GC-A expression in podocytes, Podo GC-A KO were crossed with reporter mice with global expression of the red fluorescent protein mTomato (mT). Upon Cre-mediated recombination, cells stop expressing mT and instead express GFP (mG) and display green fluorescence. (A) Kidney sections of reporter mice without Cre expression (upper panel) or with podocyte-specific Cre expression (Podo-Cre) (lower panel). Green fluorescence indicates successful recombination in glomeruli. (B) Higher magnification of a Podo-Cre positive kidney section reveals that mG expression is detected exclusively in podocytes (costaining with synaptopodin). No overlap of synaptopodin with red fluorescence (mT) is detectable, indicating that all podocytes underwent successful Cre-mediated recombination. (C) After isolation of glomeruli using magnetic beads and subsequent digestion, the glomerular cell suspension was subjected to FACS sorting, separating podocytes (green fluorescence) from glomerular “nonpodocytes” (red fluorescence) (detailed method in Supplemental Figures 1 and 2). Podocytes isolated from Podo GC-A control mice had the highest GC-A mRNA expression levels of all cell/tissue suspensions investigated (podocytes, “nonpodocytes”: glomerular cells without podocytes, “kidney”: kidney homogenate without glomeruli). GC-A expression was virtually absent in Podo GC-A KO podocytes, but was not reduced in other renal cells. The downstream targets of GC-A/cGMP signaling, protein kinase G isoforms 1 α and 1 β, were both expressed in podocytes but were not regulated by GC-A deletion. Likewise, the expression levels of other membrane receptors, such as the natriuretic peptide clearance receptor (NPRC), the angiotensin II AT1 receptors and the mineralocorticoid receptor (MR), were not altered in podocytes of Podo GC-A KO mice.
Figure 2.
Figure 2.
Acute regulation of kidney function by natriuretic peptides is preserved in Podo GC-A KO mice. Infusion of BNP (30-minute control period (NaCl 0.9%) followed by 1 ng/minute per g body wt for 30 minutes) resulted in increases of similar magnitude in glomerular filtration rate (A), urine excretion rate (B), and natriuresis (C) in Podo GC-A control mice and in Podo GC-A KO mice. These effects on kidney function were not observed in response to vehicle infusion (NaCl 0.9%) or in conventional GC-A knockout mice (GC-A KO) with global deletion of GC-A. (D) Infusion of BNP in isolated perfused kidneys of Podo GC-A control and Podo GC-A KO mice induced concentration-dependent increases in renal perfusion, indicating proper renal and glomerular hemodynamics even under the controlled conditions of the isolated perfused kidney model that is devoid of any potential systemic counter-regulations to GC-A deficiency.
Figure 3.
Figure 3.
DOCA-salt treatment results in massive albuminuria in mice with podocyte-specific deletion of GC-A. Mice were subjected to left sided unilateral nephrectomy and were subsequently treated with DOCA and a high salt diet (4% NaCl) (“DOCA”, n=6–7 each genotype). Sham operated mice did not receive unilateral nephrectomy and DOCA treatment and were maintained on standard chow. (A) DOCA induced moderate increases in systolic BP of comparable magnitude in Podo GC-A KO and Podo GC-A control mice. (B) Heart rates were reduced by DOCA to similar levels in both genotypes. (C and D) PRCs and renin mRNA expression levels in isolated glomeruli were markedly downregulated in response to DOCA treatment in Podo GC-A KO and Podo GC-A control mice. (E) Right kidney weights were markedly higher in the DOCA group in both genotypes compared with untreated controls. (F and G) DOCA resulted in massive albuminuria in Podo GC-A KO mice that was 200-fold higher than in Podo GC-A control mice 5 weeks after the start of DOCA treatment. (F) Urine was collected in metabolic cages and albumin concentration in the urine was determined by EIA, (G) analysis of spot urine (1 µl) by gel electrophoresis. (H) Plasma albumin concentration was reduced in DOCA-treated Podo GC-A KO mice compared with untreated sham mice, and (I) albumin mRNA levels in liver tissue were significantly upregulated. (J) The skGFR was determined in conscious mice after 6 weeks of DOCA treatment. Because sham mice had not undergone uninephrectomy and therefore had two kidneys throughout the study, skGFR of sham mice was calculated by dividing GFR by two. The skGFR was significantly increased by DOCA in both genotypes compared with sham. However, the hyperfiltration was attenuated in Podo GC-A KO mice compared with Podo GC-A controls. *P<0.05 versus baseline/sham or versus other genotype as indicated. #P<0.001 versus sham of same genotype.
Figure 4.
Figure 4.
DOCA-induced glomerular damage is aggravated in mice with podocyte-specific deletion of GC-A. (A) Histologic sections stained with hematoxylin and eosin show protein casts and dilated tubules in kidneys from Podo GC-A KO mice but not in Podo GC-A control mice treated with DOCA for 6 weeks. (B) Representative views of glomeruli from untreated Podo GC-A KO or Podo GC-A control mice (sham) or mice treated with DOCA for 6 weeks. Kidney sections were stained by PAS, bar represents 50 µm. Compared with sham (B, left panel) glomeruli of DOCA-treated mice of both genotypes (B, middle and right panels) had enlarged cross-sectional areas, indicating glomerular hypertrophy (analysis in C). DOCA treatment induced mesangial expansion in both genotypes. Middle panel of (B) shows an example of a mildly affected glomerulus; right panel shows a representative example of a severely affected glomerulus. Glomerulosclerosis with glomerular adhesions was detected in 25% of all glomeruli in Podo GC-A KO mice but not in control mice, and mesangial expansion (analysis in D) was clearly aggravated in Podo GC-A KO mice compared with Podo GC-A controls. #P<0.001 versus sham of same genotype or versus other genotype at same treatment as indicated.
Figure 5.
Figure 5.
DOCA treatment induces periglomerular and peritubular fibrosis in mice with podocyte-specific deletion of GC-A. (A and C) Representative kidney sections from Podo GC-A control mice (upper row) and KO mice (lower row) without treatment (left panels) and with DOCA treatment for 6 weeks. Sections were stained with either an antibody directed against αSMA (panel A) or Masson-Goldner stain (C). (A) To determine the αSMA staining density in glomeruli (results shown in B), blood vessels showing high αSMA expression were omitted from the region of interest. Glomeruli from control mice did not show prominent extravascular αSMA staining, whereas clear αSMA expression was visible in glomeruli (middle panel) and the peritubular interstitium of Podo GC-A KO mice (right panel). Fibrosis was confirmed by Masson-Goldner staining (C), which revealed fibrous tissue in sclerotic glomeruli and in the periglomerular interstitium. #P<0.001 versus sham or versus other genotype at same treatment as indicated. *P<0.05 versus sham.
Figure 6.
Figure 6.
DOCA treatment induces ultrastructural damage in podocytes in Podo GC-A KO mice. (A and B) Electron microscopy showed the normal appearance and only minor widening of podocytes foot processes in Podo GC-A control mice after 6 weeks of DOCA treatment (left panel of A and B). Massive foot process effacement was observed in each of the investigated Podo GC-A KO glomerular capillaries (A, middle and right panels), resulting in a 3-fold increase in foot process width compared with untreated sham or treated Podo GC-A control mice (B). C: capillary lumen; Bs: Bowman’s space. #P<0.001 versus sham or versus other genotype at same treatment as indicated. *P<0.05 versus sham. (C) In Podo GC-A KO mice treated with DOCA for 6 weeks positive TUNEL staining (green fluorescence, left and middle panel) or caspase 3 (green fluorescence, right panel, costaining with synaptopodin in blue) in the periphery of the glomerular tuft is observed in approximately 1% of glomeruli. No TUNEL-positive or caspase 3 positive cells were detected in either untreated sham mice or Podo GC-A control treated with DOCA. D: Podocyte number per glomerular cross-section was significantly reduced in DOCA treated Podo GC-A KO mice. *P<0.05 versus sham.
Figure 7.
Figure 7.
The expression levels of the podocyte proteins podocin and synaptopodin are markedly reduced in Podo GC-A KO mice treated with DOCA. Immunofluorescence staining for podocin (A) and synaptopodin (C) showed a typical podocyte pattern in sham and DOCA-treated Podo GC-A control mice and in sham Podo GC-A KO mice. In contrast, podocin staining was restricted to podocyte cell bodies, and synaptopodin staining was hardly visible in DOCA-treated Podo GC-A KO mice. Analysis of fluorescence density (product of intensity and area) in glomeruli revealed significant downregulation of podocin expression in Podo GC-A KO mice by DOCA treatment (B). Glomerular synaptopodin density was reduced by DOCA in both genotypes, although to lower levels in Podo GC-A KO compared with Podo GC-A control (D). #P<0.001 versus sham or versus other genotype at same treatment as indicated. *P<0.05 versus sham.
Figure 8.
Figure 8.
Oxidative stress is increased in podocytes of Podo GC-A KO mice under DOCA treatment. (A) Kidney sections were stained with an antibody directed against 4-HNE, which is produced by lipid peroxidation and serves as a marker of oxidative stress (red, upper row). For the identification of podocytes, costaining with an antipodocin antibody was performed. Image acquisition parameters for podocin staining had to be adjusted due to different expression intensities between groups (lower row, A). While 4-HNE was hardly visible in sham mice and only faint 4-HNE staining was detected in DOCA-treated Podo GC-A control mice, marked 4-HNE immunofluorescence was evident in the glomeruli of DOCA-treated Podo GC-A KO mice. Enhancement of 4-HNE was not restricted to podocytes but was also visible in both the glomerular mesangium (A) and tubular cells (not shown). Analysis of fluorescence density (product of intensity and area) in both the glomeruli (B, upper panel) and podocytes (B, lower panel) of Podo GC-A control and KO mice. (C) mRNA expression levels of NADPH oxidases NOX-2 and NOX-4 were upregulated by DOCA treatment in the glomeruli of Podo GC-A control and KO glomeruli to similar extents, whereas the expression of the NADPH dehydrogenase NQO-1 was stimulated by DOCA treatment in Podo GC-A control glomeruli but not in Podo GC-A KO glomeruli. #P<0.001 versus sham or versus other genotype at same treatment as indicated. *P<0.05 versus sham.
Figure 9.
Figure 9.
Expression of TRPC6 is upregulated in podocytes of DOCA-treated Podo GC-A KO mice. (A) Kidney sections of sham and of DOCA-treated mice were stained with antibodies directed against TRPC6 and against synaptopodin for the identification of podocytes. Image acquisition for TRPC6 was performed at exactly the same adjustments for all treatments and genotypes (upper row). Because synaptopodin expression was reduced in DOCA-treated mice, acquisition settings were adjusted in order to receive a sufficient fluorescence signal (middle row). However, this approach was not fully successful in Podo GC-A KO mice, so that costaining of TRPC6 and synaptopodin was technically hardly achievable in DOCA treated KO mice (lower row). (B) Analysis of TRPC6 fluorescence density in podocytes (left panel) shows higher values in Podo GC-A KO mice compared with Podo GC-A control mice under sham conditions and after 6 weeks of DOCA treatment. When fluorescence density was determined for the entire glomerular area (right panel) no significant difference between Podo GC-A KO and control was detected in sham mice, whereas TRPC6 upregulation was observed in Podo GC-A KO mice after 6 weeks of DOCA treatment (right panel of B). Likewise, TRPC6 mRNA expression was upregulated in glomeruli from DOCA-treated Podo GC-A KO mice (C). #P<0.001 versus sham or versus other genotype at same treatment as indicated. *P<0.05 versus sham or versus other genotype at same treatment as indicated.
Figure 10.
Figure 10.
Cytosolic calcium influx is enhanced in podocytes from Podo GC-A KO mice. (A) Podo GC-A control and KO mice that had been crossed to a fluorescent Cre-reporter mouse background were uninephrectomized and treated with DOCA-salt for 9–12 days. Glomeruli were freshly isolated and loaded with fura-2 acetoxymethyl ester. Podocytes were identified by their green fluorescence, and regions of interest for the determination of fura-2 fluorescence were placed on podocytes. (B-D) As a measure of the cytosolic calcium concentration [Ca2+]i the fura-2 fluorescence emission ratio at 340/380 nm excitation wave length was determined. Calcium influx into podocytes was stimulated by ATP (100 µM) in the absence or the presence of the TRPC channel blocker SKF96365 (10 µM). ATP induced calcium influxes in podocytes of Podo GC-A control and KO mice (B) that had similar peak heights (C) and areas under the curves (D) in untreated control mice (white dots in B). The ATP-induced increase in [Ca2+]i was augmented by DOCA pretreatment (red dots in B) in both genotypes. However, augmentation was pronounced in Podo GC-A KO compared with Podo GC-A controls such that the delta peak (maximum value–mean baseline value, C) and areas under curves (D) were significantly higher in DOCA treated Podo GC-A KO mice. Concomitant application of SKF96365 (begun 5 minutes before beginning of ATP application) significantly attenuated the ATP-induced calcium influx to comparable levels in both genotypes (blue squares in B). Similarly, the increase in [Ca2+]i in response to ATP was inhibited by ANP (200 nM, ANP application was begun 5 minutes before ATP) (black triangles in B) in Podo GC-A control mice. As expected ANP did not alter [Ca2+]i in podocytes from Podo GC-A KO mice (black triangles in B, n=2 glomeruli, no statistics performed). #P<0.001; *P<0.05 as indicated by bar. §P<0.01 versus Podo GC-A control same treatment.
Figure 11.
Figure 11.
Albuminuria in response to DOCA salt treatment for 2 weeks is markedly improved by blockade of TRPC channels. Mice were subjected to left sided unilateral nephrectomy and were subsequently treated with DOCA and a high salt diet (4% NaCl) for 14 days (“DOCA”, n=5–7 each genotype). In order to block TRPC channels, one group of mice of each genotype was treated with SKF96365 (10 mg/kg body wt, once daily, i.p.) for the entire experimental period. Sham operated mice did not receive unilateral nephrectomy and DOCA treatment and were maintained on standard chow. (A) DOCA induced moderate increases in systolic BP of comparable magnitude in Podo GC-A KO and Podo GC-A control mice which was not altered by SKF96365. (B) Plasma ANP concentration was elevated in response to DOCA treatment in both genotypes. (C) Plasma BNP concentration tended to be higher in treated mice compared with sham controls; however, this difference did not achieve statistical significance. (D) Right kidney weights were markedly higher in the DOCA group in both genotypes compared with untreated controls independent of SKF96365 treatment. (E) Podo GC-A KO mice developed progressive albuminuria starting 6 days after the start of DOCA treatment. SKF96365 markedly reduced albuminuria. (F) The skGFR was determined in conscious mice after 2 weeks of DOCA treatment. Because sham mice had not undergone uninephrectomy and therefore had two kidneys throughout the study, skGFR of sham mice was calculated by dividing GFR by two. The skGFR was increased by DOCA in both genotypes to similar levels and was not changed by SKF96365. (G and H) Western blot analysis of TRPC6 expression in glomeruli. DOCA resulted in a marked upregulation of TRPC6 expression in glomeruli of Podo GC-A KO mice, which was not significantly reduced by SKF96365 treatment. *P<0.05 versus baseline/sham or as indicated by bar. #P<0.001 versus sham.
Figure 12.
Figure 12.
Blockade of TRPC channels by SKF96365 markedly improves podocyte and glomerular damage in response to DOCA treatment for 2 weeks in Podo GC-A KO mice. (A and B) Electron microscopy showed the normal appearance and only minimal widening of podocytes foot processes in Podo GC-A control mice after 2 weeks of DOCA treatment (upper panel of A and B). Massive foot process effacement was observed already 2 weeks after the start of DOCA treatment in Podo GC-A KO (A lower panel, B). These prominent changes were markedly improved by concomitant treatment with SKF96365 (A lower panel, B). C: capillary lumen; Bs: Bowman’s space. (C) PAS staining revealed glomerular hypertrophy of DOCA treated Podo GC-A KO mice (D). Moreover, DOCA induced a marked mesangial expansion in Podo GC-A KO which was significantly ameliorated by SKF96365 (E). Bar represents 50 µm. *P<0.05 versus sham or as indicated by bar; #P<0.001 versus sham or as indicated by bar.
Figure 13.
Figure 13.
Downregulation of podocin and increased oxidative stress in response to 2 weeks of DOCA treatment are prevented by blockade of TRPC channels. (A and B) Immunofluorescence staining for podocin was slightly but significantly reduced after 14 days of DOCA treatment. Downregulation of podocin expression was confirmed by Western blotting (C and D). Treatment of the mice with SKF96365 completely prevented downregulation of podocin expression (A-D). (E) Kidney sections were stained with an antibody directed against 4-HNE, which is produced by lipid peroxidation and serves as a marker of oxidative stress. Prominent 4-HNE immunofluorescence was detected in the glomeruli of DOCA-treated Podo GC-A KO mice compared with sham and Podo GC-A control mice. (E and F) SKF96365 normalized oxidative stress. *P<0.05 versus sham or as indicated by bar. #P<0.001 versus sham or as indicated by bar.

Similar articles

Cited by

References

    1. Boute N, Gribouval O, Roselli S, Benessy F, Lee H, Fuchshuber A, Dahan K, Gubler MC, Niaudet P, Antignac C: NPHS2, encoding the glomerular protein podocin, is mutated in autosomal recessive steroid-resistant nephrotic syndrome. Nat Genet 24: 349–354, 2000 - PubMed
    1. Kestilä M, Lenkkeri U, Männikkö M, Lamerdin J, McCready P, Putaala H, Ruotsalainen V, Morita T, Nissinen M, Herva R, Kashtan CE, Peltonen L, Holmberg C, Olsen A, Tryggvason K: Positionally cloned gene for a novel glomerular protein--nephrin--is mutated in congenital nephrotic syndrome. Mol Cell 1: 575–582, 1998 - PubMed
    1. Shih NY, Li J, Karpitskii V, Nguyen A, Dustin ML, Kanagawa O, Miner JH, Shaw AS: Congenital nephrotic syndrome in mice lacking CD2-associated protein. Science 286: 312–315, 1999 - PubMed
    1. Reiser J, Polu KR, Möller CC, Kenlan P, Altintas MM, Wei C, Faul C, Herbert S, Villegas I, Avila-Casado C, McGee M, Sugimoto H, Brown D, Kalluri R, Mundel P, Smith PL, Clapham DE, Pollak MR: TRPC6 is a glomerular slit diaphragm-associated channel required for normal renal function. Nat Genet 37: 739–744, 2005 - PMC - PubMed
    1. de Bold AJ, Borenstein HB, Veress AT, Sonnenberg H: A rapid and potent natriuretic response to intravenous injection of atrial myocardial extract in rats. Life Sci 28: 89–94, 1981 - PubMed

Substances

LinkOut - more resources