. 2016 May 1;30(9):1070-85.
doi: 10.1101/gad.277392.116.

A widespread sequence-specific mRNA decay pathway mediated by hnRNPs A1 and A2/B1

Affiliations

A widespread sequence-specific mRNA decay pathway mediated by hnRNPs A1 and A2/B1

Rene Geissler et al. Genes Dev. .

Abstract

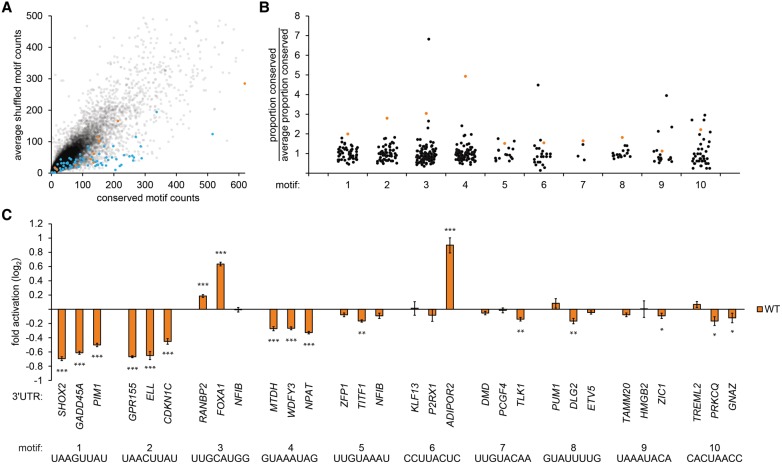
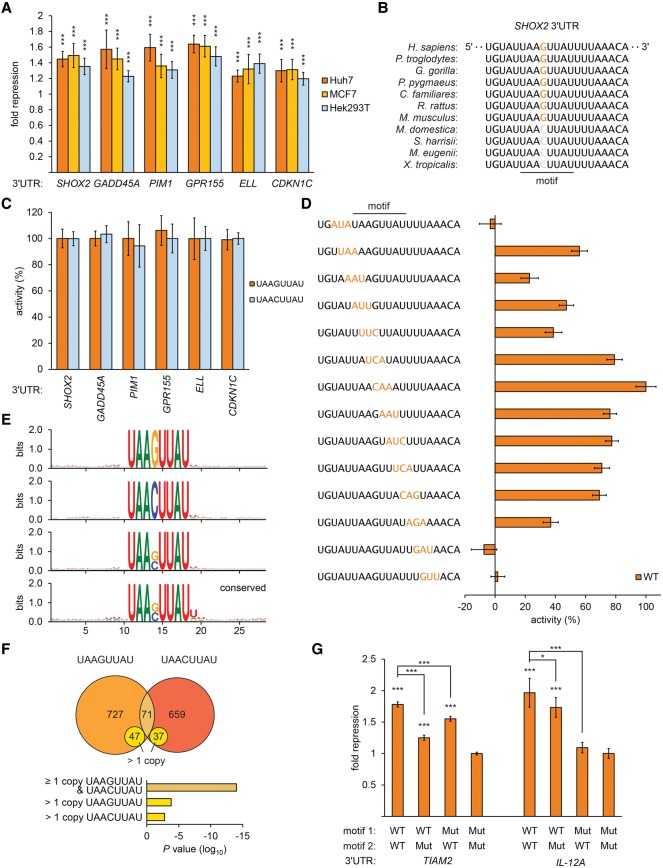
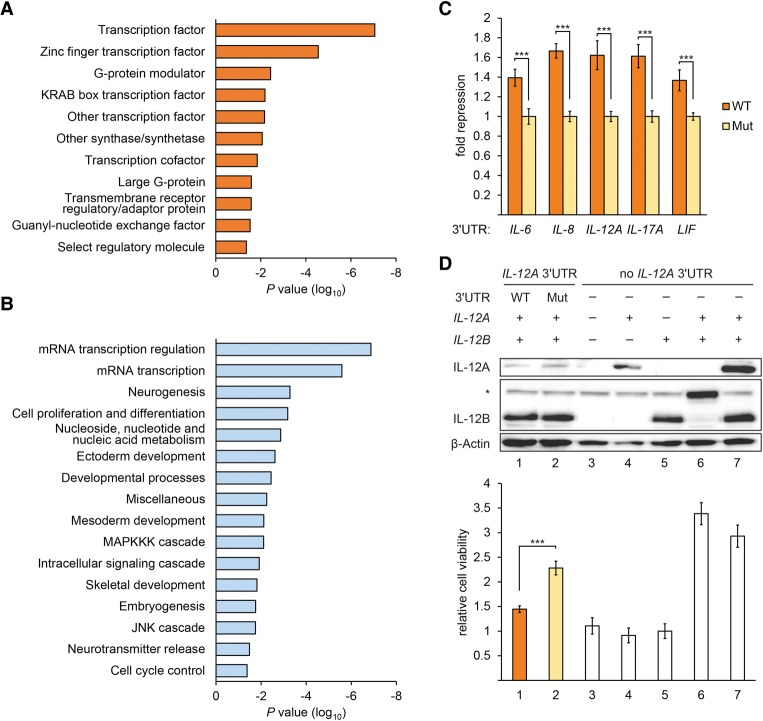
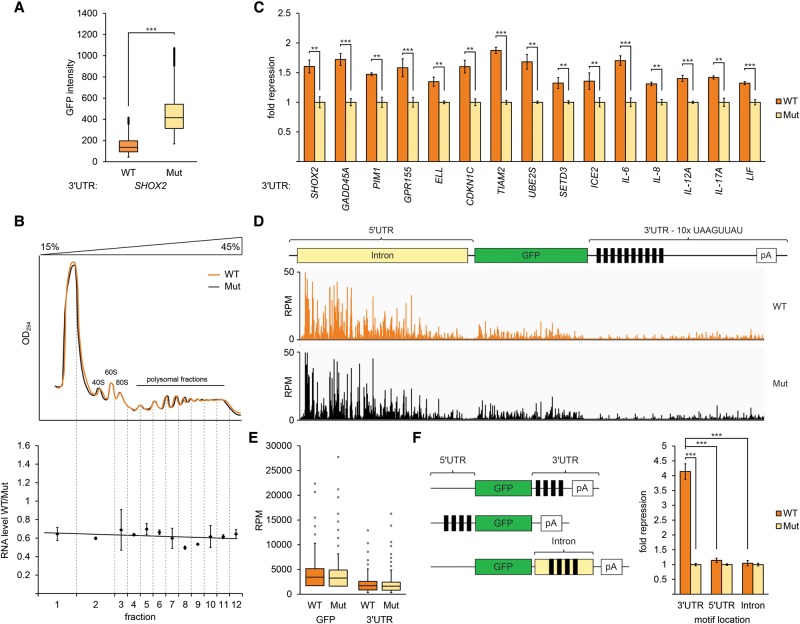
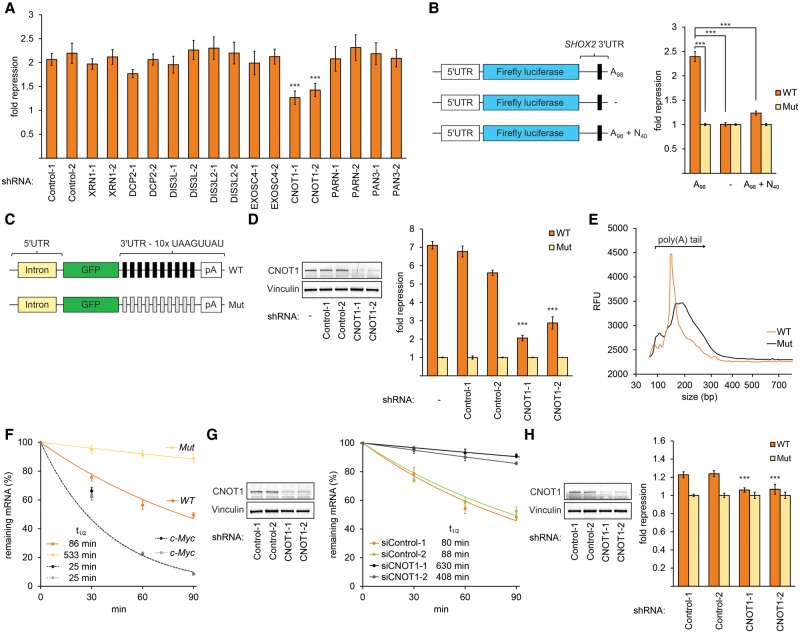
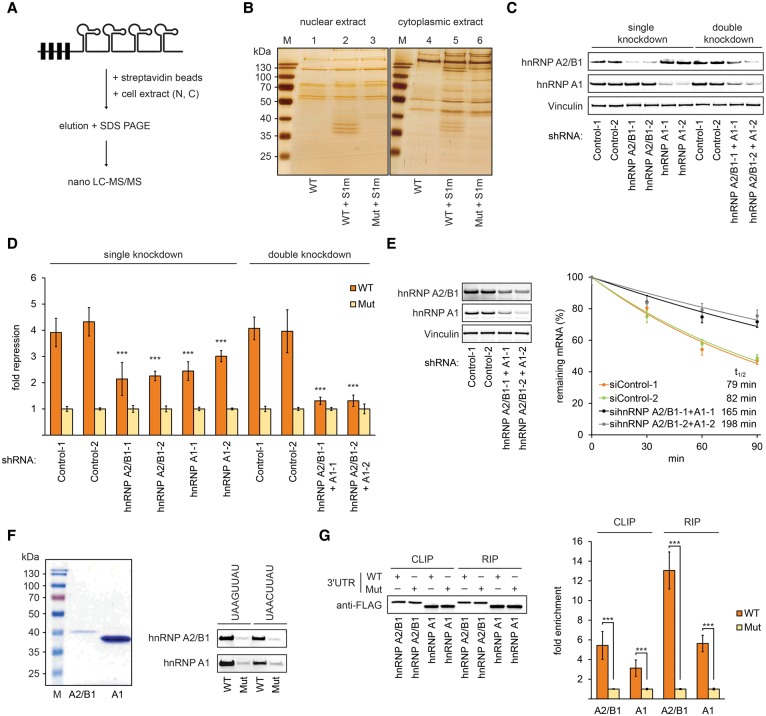
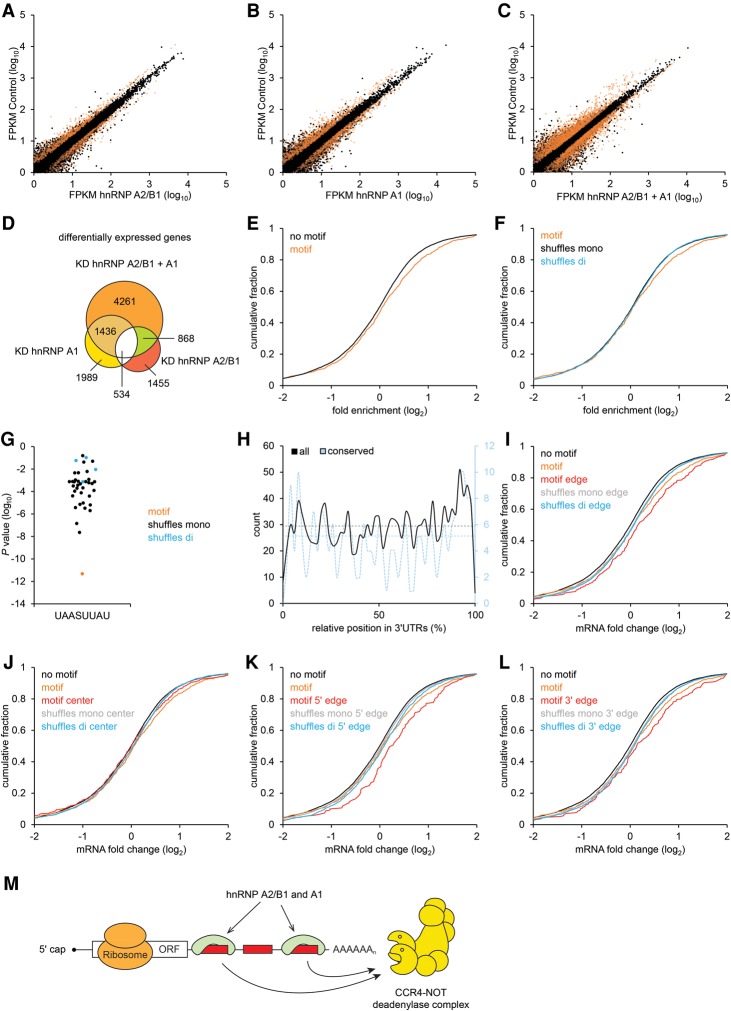
3'-untranslated regions (UTRs) specify post-transcriptional fates of mammalian messenger RNAs (mRNAs), yet knowledge of the underlying sequences and mechanisms is largely incomplete. Here, we identify two related novel 3' UTR motifs in mammals that specify transcript degradation. These motifs are interchangeable and active only within 3' UTRs, where they are often preferentially conserved; furthermore, they are found in hundreds of transcripts, many encoding regulatory proteins. We found that degradation occurs via mRNA deadenylation, mediated by the CCR4-NOT complex. We purified trans factors that recognize the motifs and identified heterogeneous nuclear ribonucleoproteins (hnRNPs) A1 and A2/B1, which are required for transcript degradation, acting in a previously unknown manner. We used RNA sequencing (RNA-seq) to confirm hnRNP A1 and A2/B1 motif-dependent roles genome-wide, profiling cells depleted of these factors singly and in combination. Interestingly, the motifs are most active within the distal portion of 3' UTRs, suggesting that their role in gene regulation can be modulated by alternative processing, resulting in shorter 3' UTRs.

Keywords: 3′ UTR; CCR4–NOT deadenylase complex; cis-regulatory element; hnRNPs A2/B1 and A1; mRNA decay; post-transcriptional gene regulation.


Figures

Figure 1.
Figure 1.
Identification of cis-regulatory elements in mammalian 3′ UTRs. (A) Count of conserved instances in human, mouse, rat, and dog 3′ UTRs for each 8-nt sequence (X-axis) compared with the average count of corresponding shuffled sequences (Y-axis). Target sites for conserved miRNAs (blue dots) and selected novel motifs (orange dots) are indicated. (B) Counts of conserved instances for each of 10 novel 3′ UTR sequence motifs (orange dots) compared with conserved counts of corresponding shuffled motifs (black dots); counts were normalized to the average count of each set of shuffles. (C) Validation of candidate regulatory elements in luciferase reporter assays. Each group of bars displays reporter activities for a 3′ UTR sequence motif assayed in three exemplar contexts. Luciferase activity of constructs with intact motifs (orange bars) was normalized to otherwise identical constructs with mutated elements. Error bars indicate standard errors. n = 9. (***) P < 0.001; (**) P < 0.01; (*) P < 0.05, Wilcoxon rank-sum test.
Figure 2.
Figure 2.
Characterization of a prevalent 3′ UTR regulatory element. (A) Motif-mediated repression across a range of cell types. Reporter assays of exemplar 3′ UTRs containing the UAASUUAU motif, normalized to otherwise identical mutated reporters, plotting fold repression; otherwise as described in Figure 1C. (B) Sequence alignment of the motif in SHOX2 3′ UTRs. (C) Reporter assays exchanging UAAGUUAU and UAACUUAU; otherwise as described in A. (D) Mutational analysis of the motif in SHOX2 3′ UTRs. Luciferase reporter assays of a series of constructs containing sequence changes (indicated in orange) flanking and within the motif. Fold repression was calculated for reporters containing the wild-type sequence and each mutant; repressive activity of each mutant, relative to wild type, is shown; otherwise as described in A. (E) Web logos of 3′ UTR sequences centered on all instances of the motif (top three panels for UAAGUUAU, UAACUUAU, and UAASUUAU) and all conserved instances (bottom panel for UAASUUAU). (F, top) Venn diagram illustrating the number and overlap of 3′ UTRs containing the motif. (Bottom) Hypergeometric tests indicating that more 3′ UTRs contain multiple copies of the motif than expected if co-occurrence were random. (G) Multiple copies of the motif are functional in 3′ UTRs. Luciferase activities of constructs containing two copies of the motif were compared with otherwise identical constructs with either or both elements mutated; otherwise as described in A.
Figure 3.
Figure 3.
The motif is enriched in 3′ UTRs of transcripts encoding regulatory proteins. (A,B) Gene ontology analysis of mRNAs whose 3′ UTRs contain the motif, reporting significantly enriched terms (P < 0.05) within molecular function (A) and biological process (B) categories. (C) Reporter assays indicating functional instances of the motif within interleukin gene 3′ UTRs; otherwise as described in Figure 1C. (D) IL-12 cell viability assay. (Top panel) Western blot probed for IL-12A, IL-12B (the asterisk denotes an unspecific band recognized by IL-12B antibody), and β-actin using protein extracts from COS-7 cells transfected with the indicated combinations of constructs expressing IL-12B, IL-12A with and without native 3′ UTR, and an IL-12A-12B fusion construct (lane 6; comigrates with unspecific band). (Bottom panel) Cell viability assay using Ba/F3 cells expressing IL-12 receptors. Ba/F3 cells were treated with supernatants of COS-7 cells transfected with the constructs described above, and cell viability was normalized to lane 5. n = 5. (***) P < 0.001, Student's t-test. Error bars denote standard deviation.
Figure 4.
Figure 4.
The 3′ UTR motif UAASUUAU destabilizes host mRNAs. (A) Box plot of GFP intensities from A549 cells containing stably integrated GFP reporters with the wild-type SHOX2 3′ UTR or with the motif mutated (Mut) (P < 0.001). (B) RNA steady-state levels, and not translation, are regulated by the motif. (Top) Polysome gradient fractionation of cells stably expressing wild-type (orange) and Mut (black) GFP reporters described in A. RNA quantification of wild-type compared with Mut reporters (Y-axis) assessed by quantitative RT–PCR (qRT–PCR) on each fraction (X-axis). n = 2. Error bars denote standard deviation. (C) The motifs are functional within diverse 3′ UTRs. RNA levels, assessed by qRT–PCR, from stably integrated GFP constructs containing the indicated 3′ UTRs, compared between 3′ UTRs containing intact and mutated copies of the motif. n = 3. (***) P < 0.001; (**) P < 0.01, determined with Student's t-test. Error bars denote standard deviation. (D) The motif does not regulate transcription. PRO-seq (precise nuclear run-on and sequencing) analysis of GFP constructs containing 10 copies of the wild-type motif or mutated (Mut) copies showing reads per million mapped reads (Y-axis) values across the transcript (X-axis) together with a transcript schematic. (E) Box plot of reads per million expression values from D mapped to the coding sequence and 3′ UTR downstream from the motif. (F) Activity of the motif is restricted to the 3′ UTR. Illustration of reporter constructs; black rectangles denote the motif. qRT–PCR of RNA levels from the illustrated constructs. n = 3. (***) P < 0.001, determined with Student's t-test. Error bars indicate standard deviation.
Figure 5.
Figure 5.
The motif promotes deadenylation by recruitment of the CCR4–NOT complex. (A) CNOT1 is required for motif activity. Luciferase assays performed on transfected RNAs containing the SHOX2 3′ UTR with a poly(A)98 tail performed in A549 cells depleted for the indicated mRNA decay factors. n = 9. (***) P < 0.001, Wilcoxon rank-sum test. Error bars denote standard deviation. (B) A functional poly(A) tail is necessary for motif activity. (Left) Illustration of luciferase reporter mRNAs; black rectangles denote the motif, A98 denotes a poly(A) tail of 98 adenine nucleotides, and N40 denotes a tail of 40 non-A nucleotides. (Right) Firefly luciferase activities of the illustrated constructs (orange) compared with activities of otherwise identical RNAs containing a mutation disrupting the motif (yellow). Reporters were transfected into A549 cells, and activities were normalized to cotransfected Renilla luciferase mRNAs. n = 9. (***) P < 0.001, Wilcoxon rank-sum test. Error bars denote standard deviation. (C) Schematic of GFP constructs containing 10 copies of wild-type (black rectangles) and mutated (gray rectangles) motifs. (D, right panel) qRT–PCR analysis of GFP RNA levels expressed from constructs presented in C in CNOT1- and control-depleted A549 cells. n = 6. (***) P < 0.001, Student's t-test. Error bars display standard deviations. (Left panel) Validation of shRNA knockdown efficacy. Western blots probed with antibodies recognizing CNOT1 and vinculin using CNOT1-depleted extracts and control extracts; CNOT1 protein levels were reduced to 17%–26%, respectively. Vinculin was probed as a loading control. (E) Poly(A) tail length analysis of GFP reporters described in C. Poly(A) tails were RT–PCR-amplified and assessed for size (X-axis) and intensity (Y-axis, relative fluorescence intensity) using a fragment analyzer. (F) RNA decay analysis of mRNAs expressed from GFP constructs shown in C. Decay kinetics of reporter transcripts analyzed by qRT–PCR after treatment with actinomycin D (orange and yellow lines). Dashed lines indicate endogenous c-myc RNA decay in cell lines expressing the wild-type and mutated GFP reporters (black and gray dashed lines, respectively), indicating that c-myc stability is comparable between reporter cell lines. Error bars represent standard errors. n = 6. Data were fit using exponential regression; inferred transcript half-lives are indicated. (G, right panel) RNA decay experiment as described in F with GFP constructs expressing the wild-type motif in CNOT1- and control-depleted cells. (Left panel) Validation of shRNA knockdown efficacy as described in D. (H) Autoregulation of CNOT1. (Right panel) Luciferase reporter activities of mRNAs containing the CNOT1 3′ UTR, which carries two copies of the motif, in CNOT1 depleted cells. Luciferase experiments were performed as described in B. (Left panel) Validation of shRNA knockdown efficacy as described in D.
Figure 6.
Figure 6.
hnRNPs A2/B1 and A1 are trans-acting factors required for motif-mediated repression. (A) Schematic of pull-down experiments. RNAs were in vitro transcribed from constructs containing four copies of the motif derived from 48 nt of the SHOX2 3′ UTR and four copies of the S1m aptamer. After incubation with cell extracts, eluted proteins were identified by MS. (B) Pull-down experiments with constructs and the strategy described in A. Eluted proteins were separated by SDS-PAGE and silver-stained. (C) Validation of shRNA knockdown efficacy. Western blots probed with indicated antibodies using hnRNP A2/B1- and A1-depleted extracts; vinculin was probed as a loading control. (D) Luciferase assays of reporters containing four copies of the motif in hnRNP A2/B1- and A1-depleted A549 cells, as shown in C. n = 9. (***) P < 0.001, Wilcoxon rank-sum test. Error bars denote standard deviations. (E, left panel) Validation of shRNA knockdown efficacy as described in C; hnRNP A2/B1 and A1 protein levels were reduced to 33%–37% and 15%–24% in single-knockdown cells and 26% and 10%–15% in double-knockdown cells, respectively. (Right panel) RNA decay analysis of wild-type mRNAs expressed from GFP 3′ UTR constructs described in Figure 5C in hnRNP A2/B1+A1-depleted cells; otherwise as described in Figure 5F. (F, left panel) Purification of recombinant hnRNPs A2/B1 and A1 from HEK293T cells. Purified proteins were separated by SDS-PAGE and Coomassie-stained. (Right panel) Pull-down experiments with recombinant hnRNPs A2/B1 and A1 with constructs as described in A. (G, left panel) Western blot analysis of immunoprecipitated hnRNPs A2/B1 and A1 using CLIP (cross-linking and immunoprecipitation) and RIP (RNA immunoprecipitation) approaches. (Right panel) qRT–PCR analysis of immunoprecipitated GFP RNA levels (using reporters described in Fig. 5C) from HEK293T cells expressing Flag-tagged versions of hnRNPs A2/B1 and A1. n = 3. (***) P < 0.001, Student's t-test. Error bars display standard deviations.
Figure 7.
Figure 7.
Impact of hnRNPs A2/B1 and A1 on the transcriptome. (AC) Expression (average FPKM [fragments per kilobase of transcript per million mapped reads] of replicates) of transcripts detected by RNA-seq from cells depleted (X-axis) in hnRNP A2/B1 (A), hnRNP A1 (B), or both A2/B1+A1 (C), each compared with control-treated cells (Y-axis), indicating (in orange) transcripts with significant (P < 0.05) differences in expression. Transcripts with the motif in their 3′ UTRs were significantly enriched in up-regulated transcripts (P < 10−7, P < 10−3, and P < 10−8, number of cases of up-regulated transcripts with the motif = 69, 77, and 171, for AC, respectively, hypergeometric test) and not enriched in down-regulated transcripts. (D) Venn diagram illustrating the overlap between differentially expressed transcripts shown in AC. (E) Cumulative distributions of mRNA fold changes for mRNAs containing the 3′ UTR motif (orange) to all other expressed genes (black) in hnRNP A2/B1+A1-depleted A549 cells. (P < 0.001, one-sided Kolmogorov-Smirnov test). (F) As in E but comparing mRNAs with the motif within their 3′ UTRs with those containing a mononucleotide (black; P < 0.05) or dinucleotide shuffled motif sequence (blue; P < 0.05). (G) Enrichment (Y-axis; P-values by hypergeometric test) of 3′ UTRs containing the motif (orange dot) in transcripts up-regulated (Q < 0.05) in hnRNP A2/B1+A1-depleted cells compared with enrichment of transcripts containing shuffled sequences (mononucleotide and dinucleotide shuffles shown in black and blue, respectively). (H) Binned counts of total (black) and conserved (blue) instances of the motif (left and right X-axes, respectively) with respect to their relative 3′ UTR positions (Y-axis). Dashed lines indicate average counts if occurrence were uniformly distributed. (IL) Assessment of motif activity at different 3′ UTR positions. Cumulative distributions of changes in mRNA levels, as described in E, but restricting analysis to instances of the motif (or control sequences) located within (I; P < 5 × 10⁻⁵; P < 0.01, compared with shuffles) and without (J; not significant) the first and last 300 nt of 3′ UTRs, the first 300 nt (K; P < 0.001; P < 0.05, compared with shuffles,) and the last 300 nt (L; P < 0.001; P < 0.05, compared with shuffles), respectively. (M) Model of UAASUUAU-mediated mRNA decay. hnRNPs A2/B1 and A1 bind to UAASUUAU (red rectangles) preferentially at distal sites of 3′ UTRs and recruit the CCR4–NOT complex to mRNAs to promote deadenylation.

Similar articles

Cited by

References

    1. Alarcon CR, Goodarzi H, Lee H, Liu X, Tavazoie S, Tavazoie SF. 2015. HNRNPA2B1 is a mediator of m6A-dependent nuclear RNA processing events. Cell 162: 1299–1308. - PMC - PubMed
    1. Baltz AG, Munschauer M, Schwanhausser B, Vasile A, Murakawa Y, Schueler M, Youngs N, Penfold-Brown D, Drew K, Milek M, et al. 2012. The mRNA-bound proteome and its global occupancy profile on protein-coding transcripts. Mol Cell 46: 674–690. - PubMed
    1. Barreau C, Paillard L, Osborne HB. 2005. AU-rich elements and associated factors: are there unifying principles? Nucleic Acids Res 33: 7138–7150. - PMC - PubMed
    1. Barrett LW, Fletcher S, Wilton SD. 2012. Regulation of eukaryotic gene expression by the untranslated gene regions and other non-coding elements. Cell Mol Life Sci 69: 3613–3634. - PMC - PubMed
    1. Bartel DP. 2009. MicroRNAs: target recognition and regulatory functions. Cell 136: 215–233. - PMC - PubMed

Substances