Evaluation of the appropriateness of using glucometers for measuring the blood glucose levels in mice
- PMID: 27151424
- PMCID: PMC4858715
- DOI: 10.1038/srep25465
Evaluation of the appropriateness of using glucometers for measuring the blood glucose levels in mice
Abstract
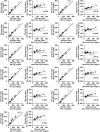
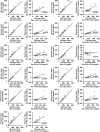
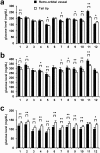
Glucometers are also widely used in diabetes research conducted using animal models. However, the appropriateness of measuring blood glucose levels using glucometers in animal models remains unclear. In this study, we evaluated the consistency between the blood glucose levels measured by 11 models of glucometers and plasma glucose levels measured by a laboratory biochemical test in blood samples collected by retro-orbital sinus puncture or tail-tip amputation. In both blood samples obtained by retro-orbital sinus puncture and those obtained by tail-tip amputation, 10 of the 11 models of glucometers yielded higher glucose values, while 1 yielded lower glucose values, than the plasma glucose values yielded by the laboratory test, the differences being in direct proportion to the plasma glucose values. Most glucometers recorded higher blood glucose levels after glucose loading and lower blood glucose levels after insulin loading in retro-orbital sinus blood as compared to tail vein blood. Our data suggest that the blood glucose levels measured by glucometers in mice tended to be higher than the plasma glucose levels yielded by the biochemical test under the hyperglycemic state, and that differences in the measured levels were observed according to the blood collection method depending on the glycemia status.
Figures


Similar articles
-
Comparison of several point-of-care testing (POCT) glucometers with an established laboratory procedure for the diagnosis of type 2 diabetes using the discordance rate. A new statistical approach.Clin Chem Lab Med. 2003 Jun;41(6):809-20. doi: 10.1515/CCLM.2003.123. Clin Chem Lab Med. 2003. PMID: 12880146
-
Effect of hematocrit on accuracy of two point-of-care glucometers for use in dogs.Am J Vet Res. 2011 Sep;72(9):1204-8. doi: 10.2460/ajvr.72.9.1204. Am J Vet Res. 2011. PMID: 21879978
-
Evaluation of four point-of-care glucose meters in alpacas.J Vet Intern Med. 2013 Jul-Aug;27(4):990-5. doi: 10.1111/jvim.12115. Epub 2013 Jun 4. J Vet Intern Med. 2013. PMID: 23734626 Clinical Trial.
-
Clinical review: Intensive insulin therapy in critically ill patients: NICE-SUGAR or Leuven blood glucose target?J Clin Endocrinol Metab. 2009 Sep;94(9):3163-70. doi: 10.1210/jc.2009-0663. Epub 2009 Jun 16. J Clin Endocrinol Metab. 2009. PMID: 19531590 Review.
-
[Hyperglycemia in critically ill patients. Sample of choice, controls and values: literature review].Enferm Intensiva. 2014 Oct-Dec;25(4):146-63. doi: 10.1016/j.enfi.2014.09.002. Enferm Intensiva. 2014. PMID: 25457697 Review. Spanish.
Cited by
-
Mice Condition Cephalic-Phase Insulin Release to Flavors Associated with Postoral Actions of Concentrated Glucose.Nutrients. 2024 Jul 12;16(14):2250. doi: 10.3390/nu16142250. Nutrients. 2024. PMID: 39064693 Free PMC article.
-
Guidelines for assessing maternal cardiovascular physiology during pregnancy and postpartum.Am J Physiol Heart Circ Physiol. 2024 Jul 1;327(1):H191-H220. doi: 10.1152/ajpheart.00055.2024. Epub 2024 May 17. Am J Physiol Heart Circ Physiol. 2024. PMID: 38758127 Review.
-
In vivo techniques for assessment of insulin sensitivity and glucose metabolism.J Endocrinol. 2024 Jan 31;260(3):e230308. doi: 10.1530/JOE-23-0308. Print 2024 Mar 1. J Endocrinol. 2024. PMID: 38198372 Free PMC article. Review.
-
Okra [Abelmoschus esculentus (L.) Moench] improved blood glucose and restored histopathological alterations in splenic tissues in a rat model with streptozotocin-induced type 1 diabetes through CD8+ T cells and NF-kβ expression.Front Vet Sci. 2023 Nov 16;10:1268968. doi: 10.3389/fvets.2023.1268968. eCollection 2023. Front Vet Sci. 2023. PMID: 38046568 Free PMC article.
-
Melatonin downregulates the increased hepatic alpha-fetoprotein expression and restores pancreatic beta cells in a streptozotocin-induced diabetic rat model: a clinical, biochemical, immunohistochemical, and descriptive histopathological study.Front Vet Sci. 2023 Aug 16;10:1214533. doi: 10.3389/fvets.2023.1214533. eCollection 2023. Front Vet Sci. 2023. PMID: 37655263 Free PMC article.
References
-
- Diehl K. H. et al. A good practice guide to the administration of substances and removal of blood, including routes and volumes. J Appl Toxicol 21, 15–23 (2001). - PubMed
-
- Christensen S. D., Mikkelsen L. F., Fels J. J., Bodvarsdottir T. B. & Hansen A. K. Quality of plasma sampled by different methods for multiple blood sampling in mice. Lab Anim 43, 65–71 (2009). - PubMed
-
- Arnold M. & Langhans W. Effects of anesthesia and blood sampling techniques on plasma metabolites and corticosterone in the rat. Physiol Behav 99, 592–598 (2010). - PubMed
Publication types
MeSH terms
Substances
LinkOut - more resources
Full Text Sources
Other Literature Sources
Medical

