. 2016 Jun 24;90(14):6475-88.
doi: 10.1128/JVI.00613-16. Print 2016 Jul 15.

NF-κB Signaling Regulates Expression of Epstein-Barr Virus BART MicroRNAs and Long Noncoding RNAs in Nasopharyngeal Carcinoma

Affiliations

NF-κB Signaling Regulates Expression of Epstein-Barr Virus BART MicroRNAs and Long Noncoding RNAs in Nasopharyngeal Carcinoma

Rob J A Verhoeven et al. J Virol. .

Abstract

Epstein-Barr virus (EBV) expresses few viral proteins in nasopharyngeal carcinoma (NPC) but high levels of BamHI-A rightward transcripts (BARTs), which include long noncoding RNAs (lncRNAs) and BART microRNAs (miRNAs). It is hypothesized that the mechanism for regulation of BARTs may relate to EBV pathogenesis in NPC. We showed that nuclear factor-κB (NF-κB) activates the BART promoters and modulates the expression of BARTs in EBV-infected NPC cells but that introduction of mutations into the putative NF-κB binding sites abolished activation of BART promoters by NF-κB. Binding of p50 subunits to NF-κB sites in the BART promoters was confirmed in electrophoretic mobility shift assays (EMSA) and further demonstrated in vivo using chromatin immunoprecipitation (ChIP) analysis. Expression of BART miRNAs and lncRNAs correlated with NF-κB activity in EBV-infected epithelial cells, while treatment of EBV-harboring NPC C666-1 cells with aspirin (acetylsalicylic acid [ASA]) and the IκB kinase inhibitor PS-1145 inhibited NF-κB activity, resulting in downregulation of BART expression. Expression of EBV LMP1 activates BART promoters, whereas an LMP1 mutant which cannot induce NF-κB activation does not activate BART promoters, further supporting the idea that expression of BARTs is regulated by NF-κB signaling. Expression of LMP1 is tightly regulated in NPC cells, and this study confirmed that miR-BART5-5p downregulates LMP1 expression, suggesting a feedback loop between BART miRNA and LMP1-mediated NF-κB activation in the NPC setting. These findings provide new insights into the mechanism underlying the deregulation of BARTs in NPC and identify a regulatory loop through which BARTs support EBV latency in NPC.

Importance: Nasopharyngeal carcinoma (NPC) cells are ubiquitously infected with Epstein-Barr virus (EBV). Notably, EBV expresses very few viral proteins in NPC cells, presumably to avoid triggering an immune response, but high levels of EBV BART miRNAs and lncRNAs which exhibit complex functions associated with EBV pathogenesis. The mechanism for regulation of BARTs is critical for understanding NPC oncogenesis. This study provides multiple lines of evidence to show that expression of BARTs is subject to regulation by NF-κB signaling. EBV LMP1 is a potent activator of NF-κB signaling, and we demonstrate that LMP1 can upregulate expression of BARTs through NF-κB signaling and that BART miRNAs are also able to downregulate LMP1 expression. It appears that aberrant NF-κB signaling and expression of BARTs form an autoregulatory loop for maintaining EBV latency in NPC cells. Further exploration of how targeting NF-κB signaling interrupts EBV latency in NPC cells may reveal new options for NPC treatment.


Figures

FIG 1
FIG 1
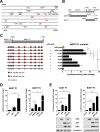
NF-κB activates EBV BART promoters. (A) Sequence of the BART promoter region showing the locations of previously identified transcription factor binding sites (underlined), putative NF-κB binding sites (bold and underlined, with p65 and p50 sites within the region included in the BART P1 reporter shown in red and blue, respectively), and P1 and P2 RNA initiation sites (arrows). The nucleotide coordinates, 150150 to 150709, are based on the EBV B95-8 genome. (B) Illustration of P1 and P2 reporter constructs (solid black). (C) Location of mutations introduced into the P1 reporter at putative NF-κB p50 (blue) and p65 (red) half-sites. HEK 293T cells were cotransfected with p50 and p65 expression vectors together with the BART P1 promoter reporter with and without mutations. Relative luciferase activity is expressed as the fold change compared to the level of wild-type reporter activity, which was set to 1. (D) HEK 293T cells were cotransfected with empty vector or expression vectors for either p50 and p65, IRF-7, C/EBPβ, or c-Myc, together with either the BART P1 or P2 promoter reporter, as indicated. Relative reporter activity was estimated and expressed as the fold change compared to the vector control. (E) HEK 293T cells were transfected with either p50, p65, or p50 and p65 expression vectors together or with a control empty vector, together with the BART P1 or P2 promoter reporter. Relative reporter activity was estimated and expressed as the fold change over that of the vector control. The expression of p50, p65, IκBα, and β-tubulin was confirmed by immunoblotting using specific antibodies. Relative luciferase activities are expressed as the fold change in luciferase activity, calculated by normalizing firefly/Renilla ratios to those of the vector control. Experiments were performed in triplicate, and the results presented are the averages and standard errors of the means from three independent experiments. P values were calculated using a two-tailed Student's t test (*, P < 0.05; **, P < 0.01).
FIG 2
FIG 2
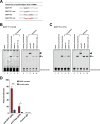
NF-κB binds to NF-κB elements in the BART promoters. (A) Nucleotide sequences of the double-stranded probes and oligonucleotides used in the competition experiments shown below. The NF-κB binding sites in the BART P1 and P2 promoters, consisting of NF-κB half-site sequence(s), are shown in bold uppercase letters, and the mutated nucleotides are in red bold lowercase letters and underlined. (B and C) IRDye 700-labeled double-stranded synthetic oligonucleotides corresponding to the BART P1 region from position −73 to −54 or the BART P2 region from position −17 to +2, as indicated, of the B95-8 sequence were incubated with nuclear extract from HEK 293T cells transfected with plasmids expressing EGFP-tagged p50 and Flag-tagged p65 and subjected to EMSA. The black arrow indicates the NF-κB/probe complex on the gel. Lanes 2 and 6 show the binding pattern of nuclear extract from untransfected cells, while lanes 3 and 7 show the binding pattern of nuclear extract from p50/p65 transfected cells. Lanes 4 and 5 show the binding of the probe when an excess (300-fold) of unlabeled wild-type or mutant competitor oligonucleotide was added to the binding reaction mixture. Supershift experiments with antibodies were performed as indicated above the gels, with supershifted complexes indicated by an arrowhead in lanes 8 of panels B and C. (D) ChIP assay of NF-κB p50 and p65 with the BART promoter. HEK 293T cells were transfected with a plasmid containing the BART P1 promoter sequence and EGFP-tagged p50 and Flag-tagged p65. Results of real-time PCR analysis and ChIP assays with antibodies specific for GFP or Flag or rabbit control IgG are shown. The results are expressed as fold enrichment, where the value for the rabbit control IgG was set to 1. A genomic region ∼5 kb upstream of the IL-8 promoter was used as a negative control. The averages and standard errors of the means from three independent experiments are shown, with all samples being analyzed in triplicate. P values were obtained from a two-tailed Student's t test (*, P < 0.05; ***, P < 0.001).
FIG 3
FIG 3
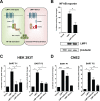
LMP1 expression activates BART P1 and P2 reporters through NF-κB signaling. (A) Illustration of wild-type LMP1 and the mutated LMP1 showing amino acid changes in CTAR2 from YYD to ID, resulting in reduced NF-κB activation by LMP1, as described in a previous study (38). (B) HEK 293T cells were transfected with an NF-κB-responsive reporter, together with an empty vector or an LMP1 (wild-type or mutant) expression vector, and reporter activities were determined 24 h after transfection. The expression of LMP1 and β-tubulin was detected by immunoblotting using specific antibodies. (C and D) HEK 293T and CNE2 cells were transfected with an empty vector or an LMP1 (wild-type or mutant) expression vector, with or without an IκBα-AA expression vector, together with the BART P2 or P1 promoter reporter. Luciferase activities are expressed as the fold change in luciferase activity, calculated by normalizing firefly/Renilla ratios to those of the vector control. Experiments were performed in triplicate, and the results are the averages and standard errors of the means from at least three independent experiments. P values were calculated by two-tailed Student's t test (*, P < 0.05; **, P < 0.01; ****, P < 0.0001).
FIG 4
FIG 4
Stable expression of LMP1 in EBV-infected epithelial cell lines upregulates BART expression. (A) LMP1 protein expression from the AGS-Bx1-LMP1, HeLa-Bx1-LMP1, and C666-1-LMP1 stable cell lines was examined by immunoblotting to demonstrate the overexpression of LMP1. (B to D) Levels of BART miRNA expression in control and LMP1-expressing stable cell lines were determined by real-time PCR. BART miRNA expression was normalized to that of a host miRNA, miR-Hsa-16, and is presented as fold change, with the expression levels of the control cell line being set to 1. (E) Levels of BART RPMS1 RNA expression in control and LMP1-expressing stable cell lines were determined by real-time PCR using primers described in Table 1. RPMS1 RNA expression was normalized to that of GAPDH and is presented as fold change, where the expression of the negative-control cell line was set to 1. Real-time PCR experiments were performed in triplicate, and the results are the averages and standard errors of the means from at least three independent experiments. P values were calculated using a two-tailed Student's t test (*, P < 0.05; ****, P < 0.0001).
FIG 5
FIG 5
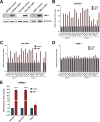
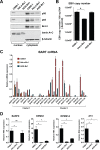
NF-κB activation and BART RNA and miRNA expression in EBV-infected epithelial cell lines. (A) Immunoblot analysis of nuclear and cytoplasmic fractions from the cell lines C666-1, HeLa-Bx1, and AGS-Bx1, using specific antibodies. Antibodies against lamin A+C were used to verify preparation of nuclear and cytoplasmic fractions. (B) EBV copy numbers in the cell lines C666-1, HeLa-Bx1, and AGS-Bx1 were determined by amplifying a fragment of the BamH-W region using qPCR. (C) Relative levels of BART miRNA in the EBV-infected epithelial cell lines C666-1, HeLa-Bx1, and AGS-Bx1 were determined by real-time PCR. BART miRNA expression was normalized to that of miR-Hsa-16. (D) Relative levels of the alternatively spliced BART RNAs BARF0, RPMS1, RPMS1A, and A73 in the EBV-infected epithelial cell lines C666-1, HeLa-Bx1, and AGS-Bx1 were determined by real-time PCR. BART RNA expression was normalized to that of GAPDH. Real-time PCR experiments were performed in triplicate, and the results are the averages and standard errors of the means from three independent RNA extractions. P values were calculated using a two-tailed Student's t test (*, P < 0.05; ns, not significant).
FIG 6
FIG 6
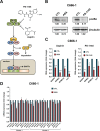
Inhibition of NF-κB signaling using acetylsalicylic acid (ASA) and the IκB kinase inhibitor PS-1145 downregulates BART expression in C666-1 cells. (A) Schematic showing the process of inhibition of NF-κB signaling by ASA and PS-1145. (B) Immunoblot analysis of levels of phosphorylated IκBα protein from C666-1 cells treated with either an ethanol (for ASA) or dimethyl sulfoxide (for PS-1145) control (CTL), 4 mM ASA, or 0.2 mM PS-1145 for 48 h. The protein levels were quantified using Image Studio Lite software (Li-Cor) and normalized against the solvent control treatment. (C) Levels of BART lncRNAs from spliced forms of BARF0, RPMS1, RPMS1A, and A73 RNA in C666-1 cells after treatment with either ASA, PS-1145, or solvent control for 48 h were determined by real-time PCR. BART RNA expression was normalized to that of GAPDH and is presented as fold change, where the value for the solvent control was set to 1. (D) Expression of BART miRNA in C666-1 cells after treatment with either ASA or solvent for 48 h was determined by real-time PCR. BART miRNA expression was normalized to that of miR-Hsa-16 and is presented as fold change, with the value for the ethanol control set to 1. Real-time PCR experiments were performed in triplicate, and the results are the averages and standard errors of the means from three independent experiments. P values were calculated from a two-tailed Student's t test comparison of results from NF-κB inhibitor treatment to those with control treatment (*, P < 0.05; ***, P < 0.001; ****, P < 0.0001).
FIG 7
FIG 7
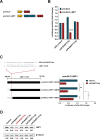
EBV-encoded miR-BART5-5p modulates LMP1 expression. (A) The pmirGLO reporter plasmid constructs used to assess the effect of miR-BART5-5p on the LMP1 3′ UTR. (B) HEK 293T cells were transfected with pmirGLO-LMP1 or empty pmirGLO reporter, together with 50 nM total synthetic miRNA (miR-control), miR-BART5-5p, or miR-BART13-3p duplexes. Reporter activity was determined 24 h after transfection. Firefly/Renilla ratios were normalized against the same reporter transfected with the negative-control miRNA, and results are expressed as fold change in luciferase activity. (C) Sequence alignment of miR-BART5-5p and the predicted binding site on the LMP1 3′ UTR (35). HEK 293T cells were cotransfected with a pmirGLO-LMP1 or pmirGLO-truncated LMP1 3′ UTR reporter and either 50 nM miR-CTL or miR-BART5-5p. Firefly/Renilla ratios were normalized to levels of the same reporter transfected with miR-CTL and expressed as fold change in luciferase activity. The results are the averages and standard errors of the means from three independent experiments. P values are from a two-tailed Student's t test comparison of results with the BART miRNA to those with the control miRNA (*, P < 0.05; **, P < 0.01; ***, P < 0.001; ns, not significant). (D) HEK 293T cells stably expressing LMP1, including its 3′ UTR, were transfected with 50 nM synthetic miRNA (control), miR-BART3-3p, miR-BART5-5p, miR-BART7-3p, miR-BART13-3p, or miR-BART14-3p duplexes. Expression of LMP1 was detected by immunoblotting using specific antibodies, and the intensities of bands were determined using Image Studio Lite software. Levels of β-tubulin were determined as a loading control. The intensities of the bands were normalized to the level of the negative-control miRNA and are expressed as fold change in protein expression.
FIG 8
FIG 8
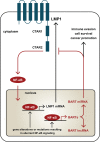
Working model showing a regulatory loop between NF-κB, LMP1, and BART miRNA in NPC cells. Constitutively active NF-κB, together with LMP1 produced through NF-κB signaling, upregulates LMP1 and BART miRNA and lncRNA expression in EBV-infected NPC cells. BART miRNA can downregulate LMP1 expression by targeting its 3′ UTR and thereby forms a negative feedback loop to modulate the level of LMP1 in cancer cells. The aberrant NF-κB activity in EBV-infected NPC cells ensures high-level expression of BART miRNAs and lncRNAs, which may contribute to immune evasion, cell survival, and cancer promotion.

Similar articles

Cited by

References

    1. Henle G, Henle W, Clifford P, Diehl V, Kafuko GW, Kirya BG, Klein G, Morrow RH, Munube GM, Pike P, Tukei PM, Ziegler JL. 1969. Antibodies to Epstein-Barr virus in Burkitt's lymphoma and control groups. J Natl Cancer Inst 43:1147–1157. - PubMed
    1. Henle W, Henle G. 1970. Evidence for a relation of Epstein-Barr virus to Burkitt's lymphoma and nasopharyngeal carcinoma. Bibl Haematol 36:706–713. - PubMed
    1. Young LS, Rowe M. 1992. Epstein-Barr virus, lymphomas and Hodgkin's disease. Semin Cancer Biol 3:273–284. - PubMed
    1. Harabuchi Y, Yamanaka N, Kataura A, Imai S, Kinoshita T, Mizuno F, Osato T. 1990. Epstein-Barr virus in nasal T-cell lymphomas in patients with lethal midline granuloma. Lancet 335:128–130. doi:10.1016/0140-6736(90)90002-M. - DOI - PubMed
    1. Jones JF, Shurin S, Abramowsky C, Tubbs RR, Sciotto CG, Wahl R, Sands J, Gottman D, Katz BZ, Sklar J. 1988. T-cell lymphomas containing Epstein-Barr viral DNA in patients with chronic Epstein-Barr virus infections. N Engl J Med 318:733–741. doi:10.1056/NEJM198803243181203. - DOI - PubMed

MeSH terms

Grants and funding

The funders had no role in study design, data collection and interpretation, or the decision to submit the work for publication.

LinkOut - more resources