. 2016 May 4:17:334.
doi: 10.1186/s12864-016-2638-x.

Temporal Dysynchrony in brain connectivity gene expression following hypoxia

Affiliations

Temporal Dysynchrony in brain connectivity gene expression following hypoxia

Brett Milash et al. BMC Genomics. .

Abstract

Background: Despite the fundamental biological importance and clinical relevance of characterizing the effects of chronic hypoxia exposure on central nervous system (CNS) development, the changes in gene expression from hypoxia are unknown. It is not known if there are unifying principles, properties, or logic in the response of the developing CNS to hypoxic exposure. Here, we use the small vertebrate zebrafish (Danio rerio) to study the effects of hypoxia on connectivity gene expression across development. We perform transcriptional profiling at high temporal resolution to systematically determine and then experimentally validate the response of CNS connectivity genes to hypoxia exposure.

Results: We characterized mRNA changes during development, comparing the effects of chronic hypoxia exposure at different time-points. We focused on changes in expression levels of a subset of 1270 genes selected for their roles in development of CNS connectivity, including axon pathfinding and synapse formation. We found that the majority of CNS connectivity genes were unaffected by hypoxia. However, for a small subset of genes hypoxia significantly affected their gene expression profiles. In particular, hypoxia appeared to affect both the timing and levels of expression, including altering expression of interacting gene pairs in a fashion that would potentially disrupt normal function.

Conclusions: Overall, our study identifies the response of CNS connectivity genes to hypoxia exposure during development. While for most genes hypoxia did not significantly affect expression, for a subset of genes hypoxia changed both levels and timing of expression. Importantly, we identified that some genes with interacting proteins, for example receptor/ligand pairs, had dissimilar responses to hypoxia that would be expected to interfere with their function. The observed dysynchrony of gene expression could impair the development of normal CNS connectivity maps.

Keywords: Axon pathfinding; Connectivity; Hypoxia; Synapse; Zebrafish.


Figures
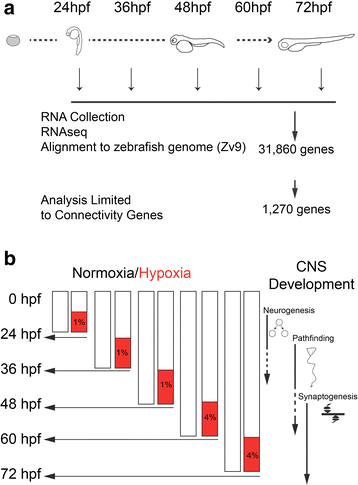
Fig. 1
Fig. 1
Schematic illustrations of experiments. a Diagram of zebrafish developmental stages (hpf, hours post-fertilization) and timing of RNA sample collection. Following collection, RNAseq, and alignment to the zebrafish reference genome, subsequent analysis was based on 1270 genes with roles in CNS connectivity development. b Illustration of timing of hypoxia exposure and RNA sample collection; and comparison to key events in CNS connectivity development. Percent oxygen for hypoxia shown in red boxes
Fig. 2
Fig. 2
Principal Component Analysis of Gene Expression. Principal component analysis of entire data set (n = 31,860 transcripts) shows closer clustering at later time stages (60 and 72 hpf), but more spread at earlier time points. Separate analysis of normoxic-only or hypoxic-only data sets displays similar findings
Fig. 3
Fig. 3
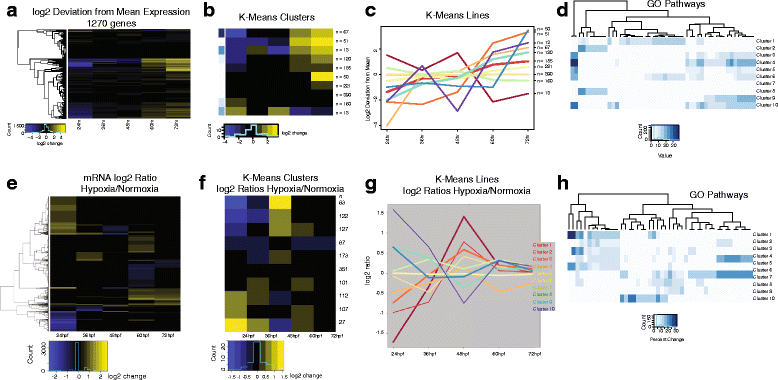
Genome-wide temporal profiles of connectivity development mRNA expression. a Developmental profiles of connectivity genes (n = 1270), displayed as a heat-map profile of groups of genes showing similar expression pattern profiles across development. b K-means cluster heat-map display of connectivity genes across development. c K clusters shown graphically as lines; relative log2 fold expression on y-axis; developmental time-points on x-axis. d GO pathway analysis of K clusters (see GO terms in Additional file 4: Figure S1). e-h, Gene expression profiles comparing hypoxia to normoxia expression profiles of connectivity genes. e Developmental profiles of connectivity genes (n = 1270), displayed as a heat-map profile. f K cluster heat-map display of connectivity genes. g K clusters shown graphically as lines; relative log2 fold expression on y-axis. h GO pathway analysis of K clusters (see GO terms in Additional file 4: Figure S1)
Fig. 4
Fig. 4
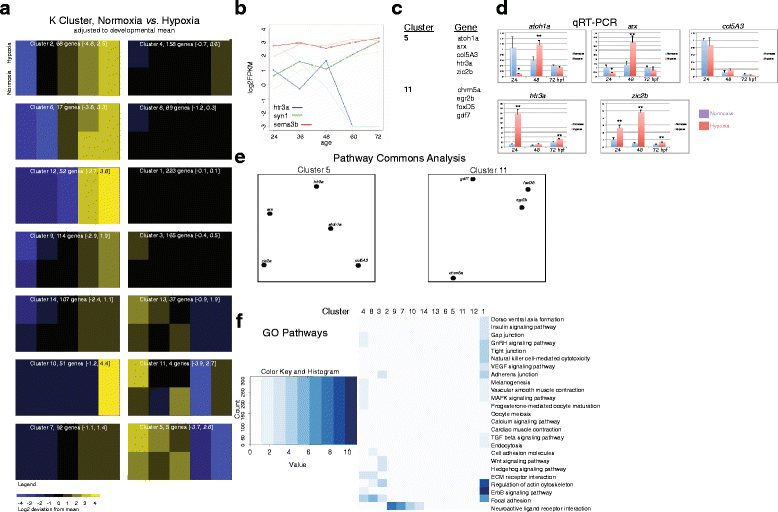
Normalized K cluster analysis demonstrates altered timing of expression caused by hypoxia. a K cluster groups shown as heat maps, in which gene expression is averaged across development, and deviations both from the developmental average, and hypoxia versus normoxia, are shown. Values in parentheses indicate the range of log2 fold change of genes in the cluster. b Expression analysis of three representative gene expression changes from hypoxia across development shown as lines; lighter shade indicates expression in hypoxia. X-axis developmental age, y-axis log2FPKM. c Genes in clusters 5 and 11; transcription factors are disproportionately represented. d qRT-PCR of genes from cluster 5; error bars standard deviation; two-tailed t test; * p < 0.05; ** p < 0.01. e Pathway Commons Network analysis, displayed with PCViz, shows no shared paths between the genes in cluster 5 or 13. f KEGG analysis of K clusters. GO categories are only loosely organized into clusters, indicating that the effects of hypoxia on gene expression are not based on gene type/category
Fig. 5
Fig. 5
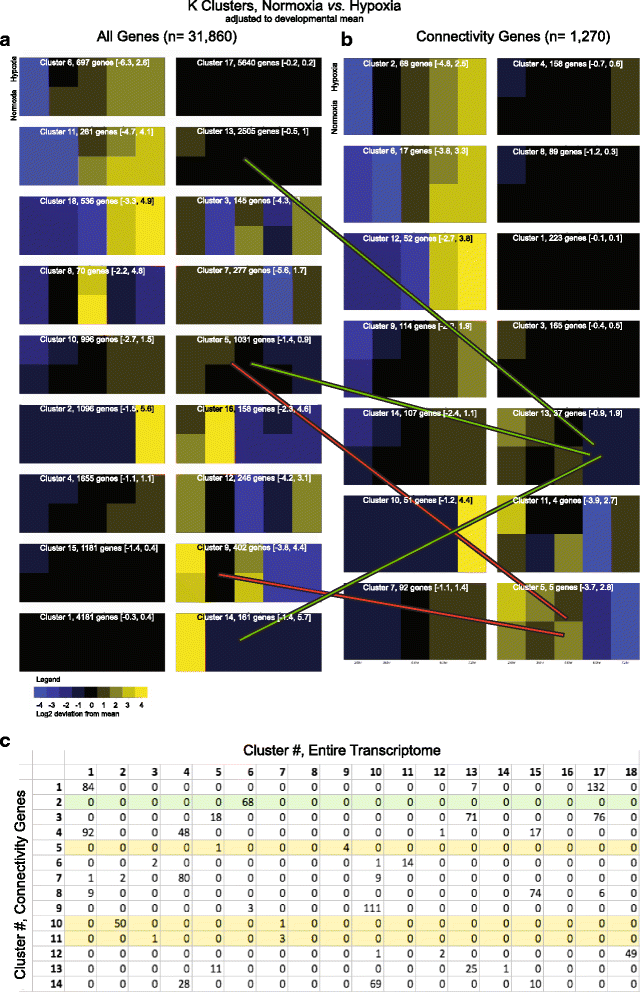
Normalized K cluster analysis of all genes compared to connectivity genes only shows improved resolution of expression differences. a Analysis of all genes (n = 31,860), K cluster groups shown as heat maps, in which gene expression is averaged across development, and deviations both from the developmental average, and hypoxia versus normoxia, are shown. Values in parentheses indicate log2 range fold change of genes in the cluster. b Examples of differential assignment of genes to different clusters (heat-maps of connectivity genes is from Fig. 4a). Green lines show different groups of genes assigned to different clusters in the two analyses for cluster 13. Red lines show differential assignment for cluster 5. c Table representation of differences in gene assignment to K clusters, comparing all genes (columns) to connectivity genes only (rows)
Fig. 6
Fig. 6
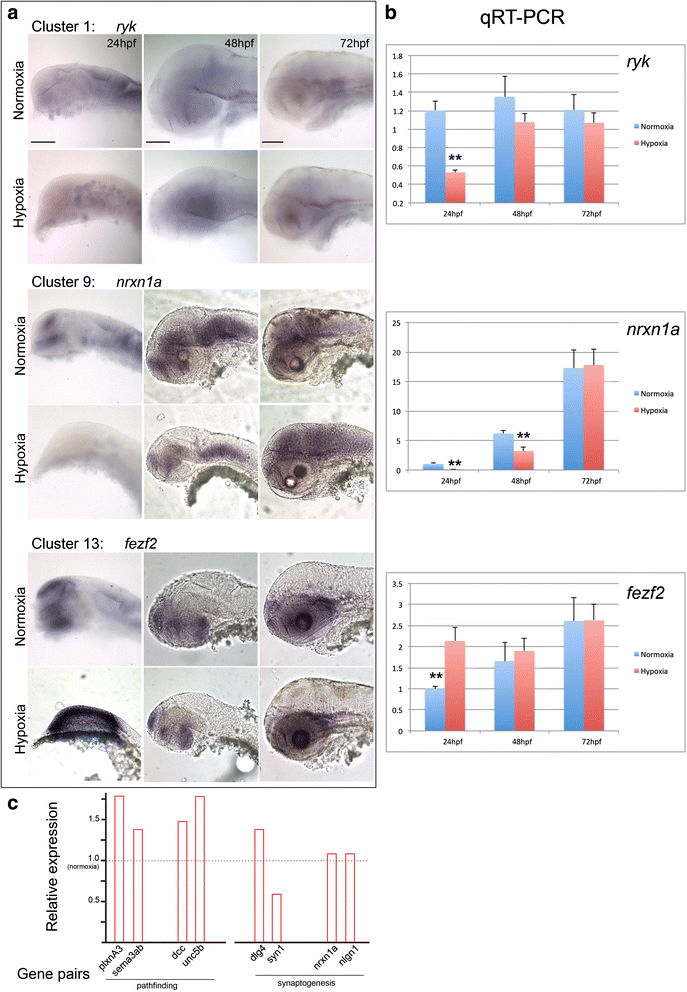
in situ validation of RNAseq results, and schematic of hypoxia-associated dysynchrony. a Examples of gene expression changes across development, and hypoxia compared to normoxia. Clusters refer to K analysis, Fig. 4. Whole-mount in situ images for ryk, nrxn1a, and fezf2; lateral views, dorsal to top, rostral to left. Scale bar 50 μm. ryk expression is decreased in hypoxia at 24 hpf, but then is otherwise relatively invariant across development and in hypoxia compared to normoxia. nrxn1a and fezf2 also demonstrate dynamic changes in expression at different developmental stages, and in hypoxia/normoxia. b qRT-PCR results for ryk, nrxn1a, and fezf2; normalized to elfa with relative value set to “1” for 24 hpf normoxia. Error bars, standard deviation; two-way t test; ** p < 0.01. c Schematic of effects of hypoxia on disrupting normal connectivity gene expression interactions. Relative expression at 24 hpf is shown for axon pathfinding and at 72hpf for synaptogenesis. Normal/normoxic expression level is set at “1”; fold-change of gene expression following hypoxia is shown by the red bars. Two examples each of ligand/receptor gene pairs are shown for axon guidance; and two pairs of pre-/post-synaptic genes for synaptogenesis
Fig. 7
Fig. 7
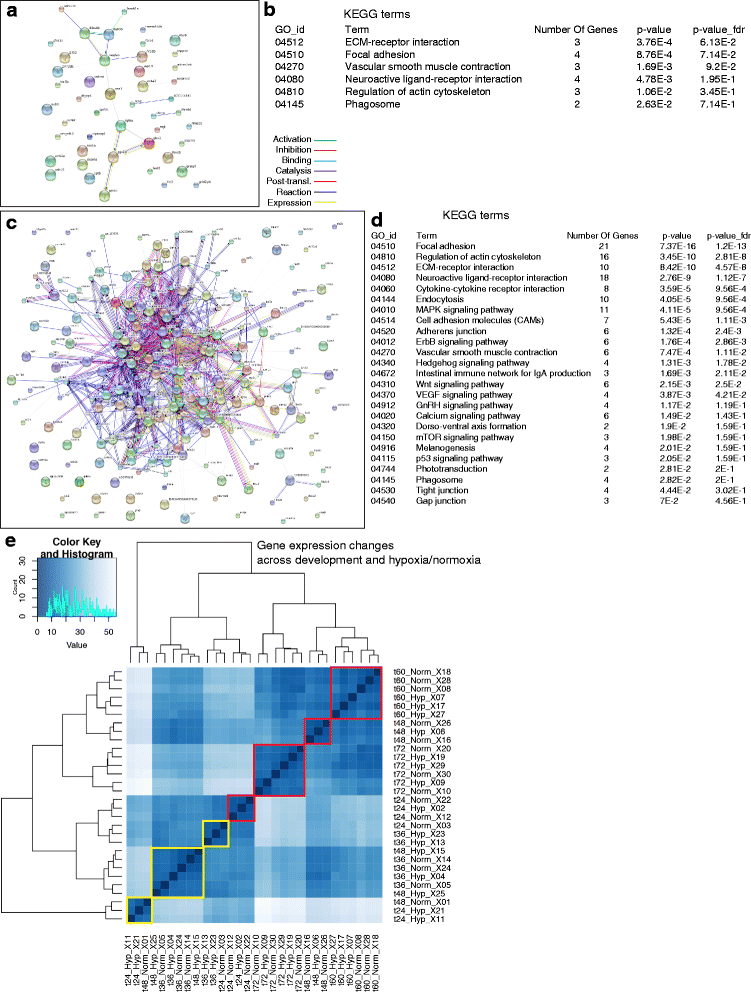
Protein-Protein Interactions Network. a STRING analysis of most significant (adjusted p < 0.05) genes interactions, n = 57; color key for interaction type is shown to the right (Additional file 10: Figure S2 shows enlarged picture and fonts). b KEGG analysis of the most common pathways for pathways with 2 or more genes. c STRING analysis with relaxed criteria (unadjusted p < 0.05), n = 244 (Additional file 10: Figure S2 shows enlarged picture and fonts). d KEGG analysis of pathways using relaxed criteria for pathways with 2 or more genes. e Heat-map profile of gene expression changes across development and experimental conditions. Red boxes show clusters in which all the groups had the same age but had both hypoxic and normoxic samples. Yellow boxes show clusters in which both the age and the experimental condition varied. At younger ages hypoxia is noted to have a larger effect by causing differential clustering based on the presence of hypoxia/normoxia (yellow boxes) rather than based solely on age (the red boxes)

Similar articles

Cited by

References

    1. Bass JL, Corwin M, Gozal D, Moore C, Nishida H, Parker S, et al. The effect of chronic or intermittent hypoxia on cognition in childhood: a review of the evidence. Pediatrics. 2004;114(3):805–16. doi: 10.1542/peds.2004-0227. - DOI - PubMed
    1. Gozzo Y, Vohr B, Lacadie C, Hampson M, Katz KH, Maller-Kesselman J, et al. Alterations in neural connectivity in preterm children at school age. Neuroimage. 2009;48(2):458–63. doi: 10.1016/j.neuroimage.2009.06.046. - DOI - PMC - PubMed
    1. Mullen KM, Vohr BR, Katz KH, Schneider KC, Lacadie C, Hampson M, et al. Preterm birth results in alterations in neural connectivity at age 16 years. Neuroimage. 2011;54(4):2563–70. doi: 10.1016/j.neuroimage.2010.11.019. - DOI - PMC - PubMed
    1. Haynes RL, Borenstein NS, Desilva TM, Folkerth RD, Liu LG, Volpe JJ, et al. Axonal development in the cerebral white matter of the human fetus and infant. J Comp Neurol. 2005;484(2):156–67. doi: 10.1002/cne.20453. - DOI - PubMed
    1. ten Donkelaar HJ. Major events in the development of the forebrain. Eur J Morphol. 2000;38(5):301–8. doi: 10.1076/ejom.38.5.0301. - DOI - PubMed

Publication types

Substances

LinkOut - more resources