. 2016 May 4;5(5):e003342.
doi: 10.1161/JAHA.116.003342.

C-C Motif Chemokine Receptor 9 Exacerbates Pressure Overload-Induced Cardiac Hypertrophy and Dysfunction

Affiliations

C-C Motif Chemokine Receptor 9 Exacerbates Pressure Overload-Induced Cardiac Hypertrophy and Dysfunction

Zhengxi Xu et al. J Am Heart Assoc. .

Abstract

Background: Maladaptive cardiac hypertrophy is a major risk factor for heart failure, which is the leading cause of death worldwide. C-C motif chemokine receptor 9 (CCR9), a subfamily of the G protein-coupled receptor supergene family, has been highlighted as an immunologic regulator in the development and homing of immune cells and in immune-related diseases. Recently, CCR9 was found to be involved in the pathogenesis of other diseases such as cardiovascular diseases; however, the effects that CCR9 exerts in cardiac hypertrophy remain elusive.

Methods and results: We observed significantly increased CCR9 protein levels in failing human hearts and in a mouse or cardiomyocyte hypertrophy model. In loss- and gain-of-function experiments, we found that pressure overload-induced hypertrophy was greatly attenuated by CCR9 deficiency in cardiac-specific CCR9 knockout mice, whereas CCR9 overexpression in cardiac-specific transgenic mice strikingly enhanced cardiac hypertrophy. The prohypertrophic effects of CCR9 were also tested in vitro, and a similar phenomenon was observed. Consequently, we identified a causal role for CCR9 in pathological cardiac hypertrophy. Mechanistically, we revealed a lack of difference in the expression levels of mitogen-activated protein kinases between groups, whereas the phosphorylation of AKT/protein kinase B and downstream effectors significantly decreased in CCR9 knockout mice and increased in CCR9 transgenic mice after aortic binding surgery.

Conclusions: The prohypertrophic effects of CCR9 were not attributable to the mitogen-activated protein kinase signaling pathway but rather to the AKT-mammalian target of rapamycin-glycogen synthase kinase 3β signaling cascade.

Keywords: AKT; C‐C motif chemokine receptor 9; cardiac dysfunction; cardiac hypertrophy; cardiovascular disease; cardiovascular research; heart failure; hypertrophy.


Figures

Figure 1
Figure 1
Cardiac CCR9 expression is increased in human hearts with DCM and HCM, mouse models of cardiac hypertrophy, and NRCMs treated with Ang II. A and B, Western blot and quantitative results for hypertrophic markers and CCR9 expression levels in the LVs of normal controls and DCM and HCM patients (n=6 per group; *P<0.05 vs donor hearts). C, Western blot and quantification of hypertrophic markers and CCR9 expression levels in the hearts of mice 4 and 8 weeks after sham or AB surgery (n=6 per group; *P<0.05 vs sham group). D, Western blot analysis and quantification of hypertrophic markers and CCR9 expression levels in primary cultured NRCMs treated with PBS or Ang II for 24 or 48 hours (n=6 per group; *P<0.05 vs PBS‐treated group). AB indicates aortic banding; Ang II, angiotensin II; ANP, atrial natriuretic peptide; β‐MHC, β‐myosin heavy chain; CCR9, C‐C motif chemokine receptor 9; DCM, dilated cardiomyopathy; h, hours; HCM, hypertrophic cardiomyopathy; NRCM, neonatal rat cardiomyocyte; W, weeks.
Figure 2
Figure 2
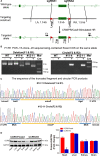
Schematic representation of the generation of cardiac‐specific conditional CCR9‐KO mice and their identification. A, Schematic illustration of cardiac‐specific conditional CCR9‐KO generation. B, Amplification of the entire region covering the floxed exon 1, exon 2, and homology arm using the F1/R1 primer (left) and the circle excised by Cre using the F2/R2 primer (right). C, DNA sequence of the truncated fragment amplified by the F1/R1 primer (upper) and the circular PCR products amplified by the F2/R2 primer (lower). D, Western blot and quantitative results for CCR9 expression levels in different tissues of CCR9‐KO and CCR9‐floxed/MEM‐Cre mice (n=6 per group; *P<0.05 vs CCR9‐floxed group). CCR9, C‐C motif chemokine receptor 9; CDS, coding sequence; HR, heart rate; KO, knockout; LA, left atrium; MCS, multiple cloning site; PCR, polymerase chain reaction; RA, right atrium; sgRNA, single‐guide RNA; UTR, untranslated region; WT, wild type.
Figure 3
Figure 3
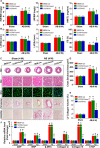
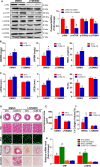
Cardiac CCR9 deficiency attenuates AB‐induced hypertrophy. A, Statistical results for HW/BW, LW/BW, and HW/TL ratios (n=8–12 per group). B, Statistical results for the echocardiographic parameters LVEDd, LVESd, and FS in the indicated groups (n=8–11 per group). C, Representative images of the histological analysis of cardiac hypertrophy, as indicated by whole‐heart short‐axis cross sections, H&E staining, and WGA staining, and representative images of cardiac interstitial fibrosis, as indicated by picrosirius red staining of the perivascular and interstitial area (scale bar=50 μm; n=5 or 6 per group). D, Statistical results for the individual cardiomyocyte cross‐sectional area (n=5 or 6 per group; at least 140 cells were measured per mouse). E, Statistical results for cardiac interstitial fibrosis (n=5 or 6 per group; at least 45 high‐power fields were counted per group). F, Quantification results for hypertrophic and fibrotic marker mRNA levels in the indicated groups (n=12 per group). *P<0.05 vs MEM‐Cre/sham or CCR9‐floxed/sham group; # P<0.05 vs CCR9‐KO/sham group; P<0.05 vs MEM‐Cre/AB or CCR9‐floxed/AB group. AB indicates aortic banding; ANP, atrial natriuretic peptide; β‐MHC, β‐myosin heavy chain; BNP, B‐type natriuretic peptide; BW indicates body weight; CCR9, C‐C motif chemokine receptor 9; CTGF, connective tissue growth factor; FS, fractional shortening; H&E, hematoxylin and eosin; HW, heart weight; KO, knockout; LV, left ventricle; LVEDd, left ventricle end‐diastolic diameter; LVESd, left ventricle end‐systolic diameter; LW, lung weight; TL, tibia length; W, weeks; WGA, wheat germ agglutinin.
Figure 4
Figure 4
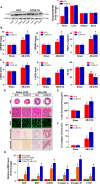
Cardiac CCR9 overexpression exacerbates AB‐induced hypertrophy. A, Representative results for Western blot, and quantification results of CCR9 expression levels in indicated groups (n=6 per group). B, Statistical results for HW/BW, LW/BW, and HW/TL ratios (n=10–12 per group). C, Statistical results for the echocardiographic parameters LVEDd, LVESd, and FS in the indicated groups (n=9–11 per group). D, Representative images of the histological analysis of cardiac hypertrophy, as indicated by the whole‐heart short‐axis cross‐section, H&E staining, WGA staining, and representative images of cardiac interstitial fibrosis as indicated by picrosirius red staining of the perivascular and interstitial area (scale bar=50 μm; n=5 or 6 per group). E, Statistical results for individual cardiomyocyte cross‐sectional area (n=5 or 6 per group; at least 150 cells were measured per mouse). F, Statistical results for cardiac interstitial fibrosis (n=5 or 6 per group; at least 45 high‐power fields were counted per group). G, Quantification results for hypertrophic and fibrotic marker mRNA levels in the indicated groups (n=12 per group). *P<0.05 vs NTG/sham group; # P<0.05 vs NTG/AB group. AB indicates aortic banding; ANP, atrial natriuretic peptide; β‐MHC, β‐myosin heavy chain; BNP, B‐type natriuretic peptide; BW indicates body weight; CCR9, C‐C motif chemokine receptor 9; CTGF, connective tissue growth factor; FS, fractional shortening; H&E, hematoxylin and eosin; HW, heart weight; LV, left ventricle; LVEDd, left ventricle end‐diastolic diameter; LVESd, left ventricle end‐systolic diameter; LW, lung weight; NTG, nontransgenic; TG, transgenic; TL, tibia length; W, weeks; WGA, wheat germ agglutinin.
Figure 5
Figure 5
CCR9 modulates Ang II–induced cardiomyocyte hypertrophy in vitro. A, Western blot analysis and quantification results for CCR9 expression level in each group (*P<0.05 vs AdshRNA group; # P<0.05 vs AdGFP group). B, Representative images of NRCMs infected with AdshCCR9 or AdCCR9 and treated with Ang II (1 μmol/L) or PBS for 48 hours (blue: nuclear; green: α‐actin; scale bar=50 μm; n=6 per group). Cell surface area is assessed and compared in AdshCCR9 and AdCCR9 groups (n=12 per group; at least 55 cells were examined each group; *P<0.05 vs AdshRNA or AdGFP/PBS group; # P<0.05 vs AdshRNA or AdGFP/Ang II group). C, The relative levels of hypertrophic markers mRNAs in NRCMs infected with AdshCCR9 and AdCCR9 (n=12 per group; *P<0.05 vs AdshRNA or AdGFP/PBS group; # P<0.05 vs AdshRNA or AdGFP/Ang II group). AdGFP indicates Adenoviral green fluorescent protein; AdshRNA, Adenoviral short hairpin RNA; Ang II, angiotensin II; ANP, atrial natriuretic peptide; β‐MHC, β‐myosin heavy chain; CCR9, C‐C motif chemokine receptor 9; NRCM, neonatal rat cardiomyocyte.
Figure 6
Figure 6
Mitogen‐activated protein kinase signaling acts downstream of CCR9. A and B, Representative results for Western blot and quantification results of the phosphorylation of MEK, ERK, JNK, and p38 and their basal volumes in the indicated groups (n=6 per group; *P<0.05 vs CCR9‐floxed/sham or NTG/sham group). AB indicates aortic banding; AdGFP indicates Adenoviral green fluorescent protein; AdshRNA, Adenoviral short hairpin RNA; CCR9, C‐C motif chemokine receptor 9; ERK, extracellular regulated protein kinase; JNK, c‐Jun N‐terminal kinase; KO, knockout; MEK, MAPK/ERK kinase; NTG, nontransgenic; p38, protein 38; TG, transgenic; W, weeks.
Figure 7
Figure 7
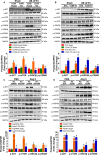
AKT signaling acts downstream of CCR9. A and B, Representative results for Western blot, and quantification results of the phosphorylation of AKT, m‐TOR, GSK3β, and p70S6K and their basal volumes in the indicated groups (n=6 per group; *P<0.05 vs CCR9‐floxed or NTG/sham group; # P<0.05 vs CCR9‐floxed or NTG/AB group). C and D, Representative results for Western blot, and quantification results of the phosphorylation of AKT, m‐TOR, GSK3β, and p70S6K and their basal volumes in the indicated groups (n=6 per group; *P<0.05 vs AdshRNA or AdGFP/PBS group; # P<0.05 vs AdshRNA or AdGFP/Ang II group). AB indicates aortic banding; Ang II, angiotensin II; CCR9, C‐C motif chemokine receptor 9; GSK3β, glycogen synthase kinase 3β; KO, knockout; mTOR, mammalian target of rapamycin; NTG, nontransgenic; TG, transgenic; W, weeks.
Figure 8
Figure 8
AKT inhibition blunted AB‐induced cardiac hypertrophy in vivo. A, After the administration of LY294002 or PBS, Western blot analysis and statistical results of the phosphorylation of AKT, m‐TOR, GSK3β, and p70S6K and their basal volumes in the indicated groups (n=6 per group). B, Statistical results for HW/BW, LW/BW, and HW/TL ratios (n=11 or 12 per group). C, Statistical results for the echocardiographic parameters LVEDd, LVESd, and FS in indicated groups (n=8–11 per group). D, Representative images of the histological analysis of cardiac hypertrophy, as indicated by the whole‐heart short‐axis cross section, H&E staining, WGA staining, and representative images of cardiac interstitial fibrosis as indicated by picrosirius red staining of the perivascular and interstitial area after AB (scale bar=50 μm; n=6 per group). E, Statistical results of individual cardiomyocyte cross‐sectional area (n=6 per group; at least 100 cells were measured per mouse). F, Statistical results of cardiac interstitial fibrosis (n=6 per group; at least 50 high‐power fields were counted per group). G, Quantification results of hypertrophic markers mRNA levels in the indicated groups after AB (n=12 per group). *P<0.05 vs LY294002‐treated NTG/AB group; # P<0.05 vs DMSO‐treated NTG/AB group. AB indicates aortic banding; ANP, atrial natriuretic peptide; β‐MHC, β‐myosin heavy chain; BW indicates body weight; CCR9, C‐C motif chemokine receptor 9; DMSO, dimethyl sulfoxide; FS, fractional shortening; GSK3β, glycogen synthase kinase 3β; H&E, hematoxylin and eosin; HW, heart weight; LVEDd, left ventricle end‐diastolic diameter; LVESd, left ventricle end‐systolic diameter; LW, lung weight; mTOR, mammalian target of rapamycin; NTG, nontransgenic; TG, transgenic; TL, tibia length; WGA, wheat germ agglutinin.

Similar articles

Cited by

References

    1. Kumarswamy R, Thum T. Non‐coding RNAs in cardiac remodeling and heart failure. Circ Res. 2013;113:676–689. - PubMed
    1. Zhang Y, Liu Y, Zhu XH, Zhang XD, Jiang DS, Bian ZY, Zhang XF, Chen K, Wei X, Gao L, Zhu LH, Yang Q, Fan GC, Lau WB, Ma X, Li H. Dickkopf‐3 attenuates pressure overload‐induced cardiac remodelling. Cardiovasc Res. 2014;102:35–45. - PMC - PubMed
    1. Rose BA, Force T, Wang Y. Mitogen‐activated protein kinase signaling in the heart: angels versus demons in a heart‐breaking tale. Physiol Rev. 2010;90:1507–1546. - PMC - PubMed
    1. Abeyrathna P, Su Y. The critical role of Akt in cardiovascular function. Vascul Pharmacol. 2015;74:38–48. - PMC - PubMed
    1. Ghigo A, Morello F, Perino A, Damilano F, Hirsch E. Specific PI3K isoform modulation in heart failure: lessons from transgenic mice. Curr Heart Fail Rep. 2011;8:168–175. - PubMed

MeSH terms

Substances

LinkOut - more resources