. 2016 Jun 7;7(23):34956-76.
doi: 10.18632/oncotarget.9008.

Identification of genes that are essential to restrict genome duplication to once per cell division

Affiliations

Identification of genes that are essential to restrict genome duplication to once per cell division

Alex Vassilev et al. Oncotarget. .

Abstract

Nuclear genome duplication is normally restricted to once per cell division, but aberrant events that allow excess DNA replication (EDR) promote genomic instability and aneuploidy, both of which are characteristics of cancer development. Here we provide the first comprehensive identification of genes that are essential to restrict genome duplication to once per cell division. An siRNA library of 21,584 human genes was screened for those that prevent EDR in cancer cells with undetectable chromosomal instability. Candidates were validated by testing multiple siRNAs and chemical inhibitors on both TP53+ and TP53- cells to reveal the relevance of this ubiquitous tumor suppressor to preventing EDR, and in the presence of an apoptosis inhibitor to reveal the full extent of EDR. The results revealed 42 genes that prevented either DNA re-replication or unscheduled endoreplication. All of them participate in one or more of eight cell cycle events. Seventeen of them have not been identified previously in this capacity. Remarkably, 14 of the 42 genes have been shown to prevent aneuploidy in mice. Moreover, suppressing a gene that prevents EDR increased the ability of the chemotherapeutic drug Paclitaxel to induce EDR, suggesting new opportunities for synthetic lethalities in the treatment of human cancers.

Keywords: DNA re-replication; aneuploidy; cell cycle regulation; endoreplication; polyploidy.


Conflict of interest statement

The authors have no conflicts of interest.

Figures
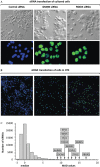
Figure 1
Figure 1. High throughput screen (HTS) for genes that prevent excess DNA replication
A. Transfection of cultured HCT116 cells for 72 hours with Ambion's silent siRNA (control), or siGMNN/Geminin, or siFBXO5/EMI1 revealed a 10-fold increase in the fraction of cells with enlarged nuclei (58% with siGMNN; 49% with siFBXO5) relative to cells transfected with control (5%). Top panels are phase contrast images. Bottom panels are fluorescent images of cells stained with Hoechst 33342. Control nuclei are colored blue, and giant nuclei colored green. Images are all 20X magnification. B. HTS using the same siRNAs gave comparable results. Fluorescent images of nuclei in a single well treated with control siRNA revealed 95% of the nuclei contain ≤4N DNA (blue), and 5% of the nuclei contained >4N DNA (green). In contrast, 44% of the siGMNN treated cells and 51% of the siFBXO5 treated cells contained nuclei with >4N DNA (green). The total number of cells in control siRNA samples (blue plus green nuclei) was equivalent to cells in untreated wells (100%), whereas siGMNN treated wells contained 28% as many cells as control wells, and siFBXO5 treated wells contained 14% as many cells. C. The signals from 64,752 siRNAs in the Ambion primary screen were normalized to ‘silent siRNAs’ (0% signal) and siGMNN (100% signal) [43]. The fraction of cells with a nuclear DNA content >4N for the median of the three siRNAs in the primary HTS was compared with the median nuclear DNA content of the entire HTS. Subsequent validation assays confirmed that FBXO5, GMNN, TPX2, ESPL1, INCENP, PLK1, TOP2A, KIF11, BIRC5, CDCA8 and AURKB were critical for restriction of genome duplication to once per cell division. 5MAD was equivalent to ≥19.3% cells with >4N nuclear DNA, 10MAD was 33.4%, and 16MAD was 50.4%.
Figure 2
Figure 2. DNA content analysis and validation of HTS data
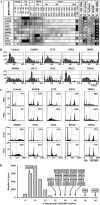
A. Heat maps were created of the distribution of cells with a nuclear DNA content from <2N to >12N. Ten examples are shown; Supplementary Figure 1 contains the complete list of 85 candidate genes. Darker shading indicates higher fraction of cells with the indicated DNA content. The percentage of cells in G1 phase (2N DNA), S phase (>2N<4N DNA), and G2/M phase (4N DNA) was calculated, as well as the percentage of cells undergoing apoptosis (<2N DNA) or excess DNA replication (≥5N DNA). B. The data in panel A were expressed as histograms. C. Independent siRNAs against 8 candidate genes (AURKB, ECT2, ESPL1, FBXO5, GMNN, KIF11, PLK1 AND TOP2A), as well as one non-candidate gene (RPL23), and a control siRNA were validated in TP53+ and TP53- isogenic HCT116 cells using standard siRNA transfection and FACS protocols. Supplementary Figure 2 contains all the FACS profiles for the 42 validated genes. D. The 21,584 genes tested in the HTS were plotted according to the percentage of cells with ≥5N nuclear DNA content when depleted by the median effect siRNA in the HTS. The 20 genes with the greatest effect on preventing EDR are indicated. Of the cells treated with silent siRNA (control), 11% contained ≥5N nuclear DNA. These data revealed the fraction of cells with nuclear DNA content equivalent to G1 phase (2N), S phase (>2N<4N), G2/M phase (4N), apoptosis (<2N), or EDR (≥5N).
Figure 3
Figure 3. The EDR signal was increased when apoptosis was inhibited
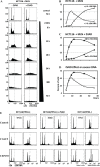
A. HCT116 cells were treated with 0.2μM MLN4924 (MLN), a specific inhibitor of neddylation, in either the presence or absence of 15μM ZVAD, a specific inhibitor of caspases. Cells were collected at the indicated times and subjected to FACS. The fraction of cells with ≥5N DNA content (representing EDR), and the fraction with <2N DNA content (representing apoptosis) were determined from the FACS data. B. The relationship between EDR and apoptosis as a function of time after addition of MLN is displayed in the absence (B) and in the presence (C) of ZVAD. D. In the presence of ZVAD, the rapid conversion of cells undergoing EDR into cells undergoing apoptosis 18 hours after addition of MLN was inhibited by ZVAD to reveal that 51% (not 18%) of the cells contain excess DNA. E. The results of the three validation assays (TP53+ cells, TP53+ cells +ZVAD, and TP53- cells) revealed that depletion of some genes (e.g. CASC5) induced EDR only when apoptosis was inhibited with ZVAD, while depletion of others (e.g. CEP192) induced EDR only in the absence of TP53.
Figure 4
Figure 4. Genes that prevented premature origin licensing prevented DNA re-replication
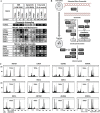
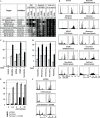
A. Seven of the validated genes have functions that prevent origin licensing during S and G2 phases of the cell cycle (illustrated in B. dark boxes with white font). The results of the three validation assays (TP53+ cells, TP53+ cells +ZVAD, and TP53- cells) carried out on each gene are summarized in panel A, and the FACS profiles are in Supplementary Figure S2A. FACS profiles for the validation assay with the strongest EDR signal for five of these genes are in panel C. The FACS profiles are consistent with induction of DNA re-replication when one of these genes is depleted.
Figure 5
Figure 5. Genes essential for untangling chromatin and entrance into mitosis were also essential to prevent EDR
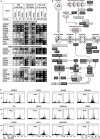
A. Twelve of the validated genes have functions that untangle chromatin from G2 phase until metaphase, drive cells from G2 phase into mitotic prophase, and assemble the mitotic spindle during the prophase to prometaphase transition (illustrated in B. dark boxes, light font). The results of the three validation assays (TP53+ cells, TP53+ cells +ZVAD, and TP53- cells) carried out on each gene are summarized in panel A, and the FACS profiles are in Supplementary Figure S2B, S2C. FACS profiles for the validation assay with the strongest EDR signals are in panel C. The FACS profiles are consistent with induction of endoreplication or mitotic slippage when one of these genes is depleted.
Figure 6
Figure 6. Genes essential for completion of mitosis and cytokinesis were also essential to prevent EDR
A. Twenty-three of the validated genes have functions required for the spindle assembly checkpoint during prometaphase, maintenance of sister chromatid cohesion from S phase until metaphase, chromosome segregation during anaphase, or cytokinesis (illustrated in B. dark boxes, light font). The results of the three validation assays (TP53+ cells, TP53+ cells +ZVAD, and TP53- cells) carried out on each gene are summarized in panel A, and the FACS profiles are in Supplementary Figure S2D, S2E. FACS profiles for the validation assay with the strongest EDR signal for 12 genes are in panel C. The FACS profiles are consistent with induction of endoreplication or mitotic slippage when one of these genes is depleted.
Figure 7
Figure 7. Chemical inhibitors also can induce EDR in cancer cells
MLN4924 (0.2μM) inhibits neddylation of cullin based E3 ubiquitin ligases. BI2536 (25nM) inhibits PLK1. Etoposide (2μM) inhibits TOP2A. VX680 (0.6μM) inhibits AURKA and AURKB. Nocodazole (50ng/ml) binds tubulin and inhibits polymerization of microtubules. Cells were culture for 3 days in the presence of the indicated chemical, and then subjected to FACS. A. The results of the three validation assays (TP53+ cells, TP53+ cells +ZVAD, and TP53- cells) carried out on each chemical inhibitor are summarized. B. FACS profiles for the validation assays with the strongest EDR signal. C. Addition of 15μM ZVAD to HCT116(TP53+) cells revealed that, on average, 50% of the cells with excess DNA underwent apoptosis. D. HCT116(TP53+) cells were treated for 3 days with 2μM Bleomycin, 2μM Irinotecan, 60nM Vincristine, or 20nM Paclitaxel and then subjected to FACS. ZVAD increased, on average, 2.5-fold the percentage of cells with >5N DNA content. E. Cells were transfected with siCCNB1 and 24 later Paclitaxel was added to determine whether or not depletion of a gene essential to prevent EDR could promote the ability of Paclitaxel to induce EDR. At low Paclitaxel concentrations (2nM), the effect of siCCNB1 was synergistic. F. FACS profiles of selected samples. All the FACS profiles are in Supplementary Figure S2F.
Figure 8
Figure 8. Specific cell cycle events associated with either DNA re-replication or unscheduled endoreplication
The 42 genes in Table 1 participate in one or more of eight cell cycle events that restrict genome duplication to once per cell division. FACS analyses of HCT116 cells (±ZVAD) transfected with the indicated siRNA (Supplementary Figure S2) revealed that some cell cycle events (indicated in red) prevented primarily endoreplication whereas others prevented primarily DNA re-replication (indicated in blue). See text for details. Origin licensing refers to the assembly of prereplication complexes during the anaphase to G1 phase transition. Origin activation refers to the assembly of initiation complexes during the G1 to S phase transition.

Similar articles

Cited by

References

    1. Masramon L, Vendrell E, Tarafa G, Capella G, Miro R, Ribas M, Peinado MA. Genetic instability and divergence of clonal populations in colon cancer cells in vitro. J Cell Sci. 2006;119:1477–1482. - PubMed
    1. Geigl JB, Obenauf AC, Schwarzbraun T, Speicher MR. Defining 'chromosomal instability'. Trends in genetics : TIG. 2008;24:64–69. - PubMed
    1. Kuznetsova AY, Seget K, Moeller GK, de Pagter MS, de Roos JA, Durrbaum M, Kuffer C, Muller S, Zaman GJ, Kloosterman WP, Storchova Z. Chromosomal instability, tolerance of mitotic errors and multidrug resistance are promoted by tetraploidization in human cells. Cell Cycle. 2015;14:2810–2820. - PMC - PubMed
    1. Zack TI, Schumacher SE, Carter SL, Cherniack AD, Saksena G, Tabak B, Lawrence MS, Zhsng CZ, Wala J, Mermel CH, Sougnez C, Gabriel SB, Hernandez B, Shen H, Laird PW, Getz G, et al. Pan-cancer patterns of somatic copy number alteration. Nature genetics. 2013;45:1134–1140. - PMC - PubMed
    1. Gerlinger M, Rowan AJ, Horswell S, Larkin J, Endesfelder D, Gronroos E, Martinez P, Matthews N, Stewart A, Tarpey P, Varela I, Phillimore B, Begum S, McDonald NQ, Butler A, Jones D, et al. Intratumor heterogeneity and branched evolution revealed by multiregion sequencing. The New England journal of medicine. 2012;366:883–892. - PMC - PubMed