. 2016 May 4:6:25411.
doi: 10.1038/srep25411.

Novel Coronin7 interactions with Cdc42 and N-WASP regulate actin organization and Golgi morphology

Affiliations

Novel Coronin7 interactions with Cdc42 and N-WASP regulate actin organization and Golgi morphology

Kurchi Bhattacharya et al. Sci Rep. .

Abstract

The contribution of the actin cytoskeleton to the unique architecture of the Golgi complex is manifold. An important player in this process is Coronin7 (CRN7), a Golgi-resident protein that stabilizes F-actin assembly at the trans-Golgi network (TGN) thereby facilitating anterograde trafficking. Here, we establish that CRN7-mediated association of F-actin with the Golgi apparatus is distinctly modulated via the small Rho GTPase Cdc42 and N-WASP. We identify N-WASP as a novel interaction partner of CRN7 and demonstrate that CRN7 restricts spurious F-actin reorganizations by repressing N-WASP 'hyperactivity' upon constitutive Cdc42 activation. Loss of CRN7 leads to increased cellular F-actin content and causes a concomitant disruption of the Golgi structure. CRN7 harbours a Cdc42- and Rac-interactive binding (CRIB) motif in its tandem β-propellers and binds selectively to GDP-bound Cdc42N17 mutant. We speculate that CRN7 can act as a cofactor for active Cdc42 generation. Mutation of CRIB motif residues that abrogate Cdc42 binding to CRN7 also fail to rescue the cellular defects in fibroblasts derived from CRN7 KO mice. Cdc42N17 overexpression partially rescued the KO phenotypes whereas N-WASP overexpression failed to do so. We conclude that CRN7 spatiotemporally influences F-actin organization and Golgi integrity in a Cdc42- and N-WASP-dependent manner.


Figures
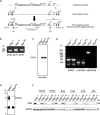
Figure 1
Figure 1. Generation and validation of Coro7gt/gt mice.
(a) The knockout vector consists of the lacZ gene as a reporter and the neomycin phosphotransferase gene. Genomic locus of the Coro7 gene depicting exons 1, 2, 3, 4, 5 and 6 is illustrated. CRN7 reporter insertion allele: FRT sites, splice acceptor, IRES, lacZ reporter cassette, neomycin selection cassette, 3′ lox P sites flanking the selection cassette and exon 4. The 5′ and 3′ homology arms are derived from the C57BL/6N genetic background. Schematic showing positions of the Southern blot neo probe, AseI restriction enzyme sites, PCR genotyping primers (P1: Ex4F (F-forward), P2: GR7 (R-reverse), arrowheads show direction) and Reverse transcription (RT)-PCR primers (Ex1F-Ex3R and Ex6F, arrowheads show direction; Ex16R is not highlighted here but is further downstream). (b) PCR genotyping was performed using tail genomic DNA from wild-type (+/+), heterozygous (+/gt) and homozygous (gt/gt) mice using primers P1 and P2. (c) Southern blot analysis of AseI-digested genomic DNA from wild-type, heterozygous and homozygous mice. A radiolabelled probe specific for the neomycin cassette was used for hybridization. (d) RT-PCR analysis was done using primer pairs from exon 1 and exon 3 (Ex1F-Ex3R) as well as exon 6 and exon 16 (Ex6F-Ex16R) at the total RNA levels using fibroblasts from wild-type and knockout mice. Control RT-PCR products were generated by a GAPDH-specific primer pair. (e) For Northern blot analysis mRNA was isolated from wild-type and knock-out mice fibroblasts and hybridized with a cDNA probe amplified from exon 6 to exon 16. *indicates non-specific binding to 28S and 18S rRNA. (f) Immunoblot analysis using lysates from various tissue from wild-type (WT), heterozygous (HET) and homozygous (HOM) mice. Lysates were probed with CRN7-specific mAb K37-142-1.
Figure 2
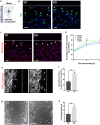
Figure 2. Impact of CRN7 deletion on Golgi architecture.
(a) Immunoblot analysis of WT and KO fibroblast lysates. CRN7 detected with mAb K37-142-1. GAPDH, loading control. (b) Detection of the Golgi apparatus in the fibroblasts using mAb 58 K-9 against the 58K Golgi membrane protein (green); nuclei stained with DAPI (blue). White asterisk, compact Golgi, yellow asterisk, dispersed Golgi. Scale bar = 7.5 μm. (c) Analysis of Golgi dispersal for 400 cells. Percentages of WT and KO cells with a fragmented or compact Golgi represented as stacked columns (n = 200 cells each, 2 independent experiments; *P < 0.05). (d) WT (left) and KO (right) primary cells transiently transfected with GFP-GalT were photobleached, and FRAP was measured over time. The curves show the normalized FRAP kinetics over time. Fluorescence recovery in bleached areas was monitored every 5 s. Curves of fluorescence intensities were normalized to nonbleached area and the background. Shown is mean ± SEM of 10 cells per condition. Mf and t1/2 were determined by fitting the curves to a one-phase exponential equation. (e) Immunoblot analysis of lysates from KO fibroblasts expressing GFP-CRN7 (rescue). Detection using mAb K37-142-1. (f) KO and rescue cells stained for Golgi (red) and rescue cells are green. The Golgi has been marked with asterisks as in (b). Scale bar = 10 μm. (g) 300 cells scored for their Golgi phenotype. Percentages of WT and KO cells with a fragmented or compact Golgi are illustrated as in (c) (n = 150 cells each, 2 independent experiments; *P < 0.05). Except FRAP all data shown as mean ± SD.
Figure 3
Figure 3. Cell polarization in migrating fibroblasts.
(a) Schematic showing a cell with Golgi and MTOC positioned within a 120° sector, ( + ) polarized; (−) non-polarized. Blue arrow, direction of migration; black solid line, wound edge. (b–d) Scratch-wounded WT and KO fibroblasts stained for (b) Golgi (58K, green) and (c) centrosome (Pericentrin, cyan) 3 h post-wounding. Nuclei stained with DAPI (blue). The position of the leading zone (broken white line) shown. Scale bar = 25 μm. Line chart (d) showing percentage of cells with reoriented Golgi and MTOC (n = 100 cells each time, each condition, 2 independent experiments; *P < 0.05). (e) TRITC-phalloidin staining of wounded cell layers (red false-coloured as grey) to visualize the F-actin network. White arrowheads, orientation of the actin fibres (parallel in WT and perpendicular in KO). Scale bar = 50 μm. (f) Bar graph with percentage of cells at the wound edge with a polarized distribution of F-actin i.e., perpendicular to leading edge (n = 100 cells each, 2 independent experiments; **P < 0.01). (g) Analysis of cell migration over 20 h for WT and KO fibroblasts. Scale bar = 100 μm. Frames from time-lapse phase-contrast videos at the indicated time shown. (h) Analysis of the velocity of single cells (in μm/hour). 10 cells from both WT and KO, per position and per edge were considered (n > 200 cells, 5 independent experiments; **P < 0.01). Data shown as mean ± SD.
Figure 4
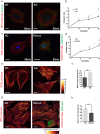
Figure 4. Cell spreading and cellular F-actin content in CRN7 KO fibroblasts.
(a) Actin cytoskeleton stained with TRITC-phalloidin (red) and focal adhesion stained with vinculin (green) after 60 min of spreading on FN-coated wells analysed by fluorescence microscopy. Scale bar = 10 μm. (b) Statistical analysis of (a). Line graph shows the increase in projected cell area at different time points (15, 30, 60 min) measured using polygon tool of LAS AF Lite (n = 200 cells each, per time point, 2 independent experiments; *P < 0.05). (c) Representative images of KO and rescue fibroblasts (glowing green) stained for F-actin only (red) as in (a). Scale bar = 25 μm. (d) Fibroblasts quantified for increase in projected cellular area as before (15, 30, 60 min) and represented as line chart (n = 40 cells each, each time point, 2 independent experiments; *P < 0.05). (e) Cells fixed and stained as in (a) and confocal z-stack images (step size 10) taken. Blue (255), higher actin intensity in the selected channel; yellow to green, decreasing intensity. Scale bar = 25 μm. (f) Fluorescence intensity measurement done by a z-stack analysis using confocal microscopy (n = 25 view fields, 3–4 cells per view field, each cell type; **P < 0.01). (g) Representative images of fully spread KO and rescue cells (green = GFP) stained for F-actin as in (e). Scale bar = 25 μm. (h) Fluorescence intensity measurement done as in (f ) (n = 40 cells each, 2 independent experiments; **P < 0.01). AU, arbitrary units. Data shown as mean ± SD.
Figure 5
Figure 5. The CRIB motifs in mammalian CRN7 and their impact on the rescue activity of the protein.
(a) Sequence alignment of human CRN7-CRIB domains (NT and CT) with CRIB domains from human Coronin 1C and D. discoideum CRN7. The CRIB consensus shown on top. Similar amino acids boxed in yellow. Highly conserved amino acids marked in red. (b) In vitro binding assay for full length GFP-CRN7WT with Rac1 and Cdc42 GTPases in their CA/Q61L and DN/T17N forms. Glutathione-Sepharose beads coated with GST alone and GST fusions pre-loaded with GDP (DN) or GTPγS (CA) and incubated with lysates from HEK293T cells expressing GFP-CRN7. PonceauS staining shows the GST fusion proteins. GFP-CRN7 detected with GFP-specific mAb K3-184-2. (c) Quantification of GFP-CRN7 bound to Rac and Cdc42 proteins (CA and DN) using ImageJ. Input set at 100% (3 independent experiments; **P < 0.01). (d) Lysates from HEK293T cells transiently co-expressing GFP-CRN7 and Myc-tagged Cdc42 GTPase CA and DN forms used for co-IP. GFP-CRN7 pulled down using GFP microbeads. Precipitated Cdc42 detected with anti-Myc mAb 9E10. Immunoprecipitated GFP-CRN7 detected with mAb K3-184-2. GFP used for control. *indicates shorter exposure for the input, arrows point to Myc-Cdc42. (e) Co-localisation analysis of CRN7 and Cdc42 mutant proteins. GFP-CRN7 in green; blue, nuclei stained with DAPI, Myc-tagged GTPases, red. Yellow, regions of co-localisation. Scale bar = 10 μm. (f) The graph shows a higher CRN7 and Cdc42 DN colocalization coefficient (R) as calculated by Pearson’s correlation coefficient using the ImageJ plugin ‘Colocalization Finder’ (n = 25 cells, unpaired two-tailed t-test, **P < 0.01). (g) Mean F-actin intensity values from z-stack images of transfected cells, fixed and stained with phalloidin (n = 10 cells each, 2 independent experiments; *P < 0.05). AU, arbitrary units. (h) Quantification of cellular spreading area for transfected cells. Fixed cells stained with phalloidin (n = 12 cells each, each time point, 2 independent experiments; *P < 0.05). (i) Percentages of various transfected cells with a fragmented or compact Golgi (n = 32 cells each, 2 independent experiments). Data shown as mean ± SD.
Figure 6
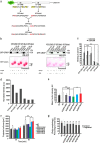
Figure 6. Effect of CRN7-CRIB motif mutations on Cdc42 binding and rescue potential of the proteins.
(a) Conserved residues in the N- and C-terminal CRIB domains boxed in yellow were mutated to alanine marked in red. The GFP tag is at the N-terminus. (b) Binding assay for GFP-CRN7 WT and CRIB mutants (Mut1 and 2, left panel; Mut3 and 4, right panel) with Cdc42 GTPase (CA and DN). Glutathione-Sepharose beads coated with GST fusions, pre-loaded with GDP (DN) or GTPγS (CA) and incubated with lysates from HEK293T cells expressing the CRN7 WT or CRIB mutants. PonceauS staining shows the GST fusion proteins. Probing was with mAb K3-184-2. (c) Bar graph showing quantification of GFP-CRN7 WT and CRIB mutants bound to Cdc42 CA and DN using ImageJ. Input set at 100% (3 independent experiments; **P < 0.01 and n.s., not significant). (d) Quantification of expression levels of endogenous CRN7 in WT fibroblasts and ectopically expressed GFP-CRN7 WT and CRIB mutants in KO fibroblasts. Cell homogenates from equal numbers of cells were analyzed by western blotting. mAb K37-142-1 detected CRN7 and mAb K3-184-2 recognized the GFP-tagged proteins. GAPDH was used for normalization. (e) Mean F-actin intensity values were derived from z-stack images of transfected cells, fixed and stained with phalloidin (n = 15 cells each, 2 independent experiments; *P < 0.05 and **P < 0.01). AU, arbitrary units. (f) Quantification of cellular spreading area at 30 and 60 min. Fixed cells stained with phalloidin (n = 25 cells each, each time point, 2 independent experiments; *P < 0.05 and **P < 0.01). (g) Percentages of cells under each condition with a fragmented or compact Golgi represented as stacked columns (n = 25 cells each, 2 independent experiments). Data shown as mean ± SD.
Figure 7
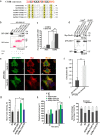
Figure 7. Analysis of N-WASP as a downstream effector.
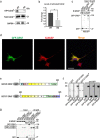
(a) GST-Pak1-PBD used to pull down GTP-Cdc42 from fibroblast lysates (upper panel). Lower panel, total Cdc42 levels. Mouse monoclonal Cdc42 antibody detects Cdc42. GAPDH used for normalization. *indicates longer exposure for the pull down and note that the wells loaded with pull down samples from WT and KO were separated by one well in between for visualizing distinct bands. (b) Densitometric analysis of active Cdc42 levels. The bar chart shows fold decrease in activated levels as a ratio of the active to the total levels (n = 4 independent experiments, mean ± SD; *P < 0.05). (c) GFP microbeads used to precipitate GFP-CRN7 from HEK293T cell extracts, the precipitate probed with rabbit polyclonal anti-N-WASP antibodies. GFP used as control. (d) Immunofluorescence analysis of HEK293T cells expressing GFP-CRN7 (green). Staining with N-WASP pAb (red) for endogenous protein. Yellow, merge, co-localisation. Scale bar = 25 μm. (e) Schematic showing GST fusion polypeptides of CRN7 (NT and CT). The positions of the amino acids are indicated. (f) Affinity-purified GFP-tagged full-length N-WASP blotted to nitrocellulose membranes directly bound by GST-NT-CRN7 and CT-CRN7 but not by GST (left-most panel). *indicates longer exposure of that particular strip of membrane. N-WASP additionally visualized by anti-GFP immunoblotting (whole right panel). (g) GFP-CRN7 and its NT and CT fragments precipitated from HEK293T cell extracts using GFP microbeads, N-WASP detected with pAb N-WASP. mAb K3-184-2 verified immunoprecipitated proteins. GFP used as negative control in (c,f,g).
Figure 8
Figure 8. CRN7 regulates cellular processes via N-WASP.
(a) Domain structure and deletion fragments of N-WASP. The positions of the amino acids are indicated. (b) Co-IP using GFP microbeads to precipitate GFP-N-WASP and deletion fragments ΔWA, WH1 and WH1-GBD from HEK293T cell extracts followed by immunoblot analysis using mAb K37-142-1 to detect CRN7. GFP mAb antibody K3-184-2 detected immunoprecipitated N-WASP polypeptides. (c) Evaluation of the binding shown in (b) represented as a ratio of co-IP (CRN7) to IP (N-WASP fragments) (n = 4 independent experiments, mean ± SD; *P < 0.05). (d) F-actin content determined from phalloidin-stained cells. Mean F-actin intensity values derived from z-stack images (n = 20 cells each, 2 independent experiments; *P < 0.05). AU, arbitrary units. Data shown as mean ± SD. (e) Quantification of cell spreading area at 30 and 60 min. Cells stained with phalloidin were evaluated (n = 15 cells each, each time point, 2 independent experiments; n.s., not significant). (f) Percentages of cells with fragmented or compact Golgi represented as stacked columns (n = 28 cells each, 2 independent experiments).

Similar articles

Cited by

References

    1. Valderrama F. et al. Actin microfilaments are essential for the cytological positioning and morphology of the Golgi complex. Eur. J. Cell Biol. 76, 9–17 (1998). - PubMed
    1. Lee S. H. & Dominguez R. Regulation of actin cytoskeleton dynamics in cells. Mol. Cell 29, 311–325 (2010). - PMC - PubMed
    1. Etienne-Manneville S. & Hall A. Integrin-mediated activation of Cdc42 controls cell polarity in migrating astrocytes through PKCzeta. Cell 106, 489–98 (2001). - PubMed
    1. Nalbant P., Hodgson L., Kraynov V., Toutchkine A. & Hahn K. M. Activation of endogenous Cdc42 visualized in living cells. Science 305, 1615–1619 (2004). - PubMed
    1. Baschieri F. et al. Spatial control of Cdc42 signalling by a GM130-RasGRF complex regulates polarity and tumorigenesis. Nat. Commun. 5, 4839 (2014). - PMC - PubMed

Publication types

MeSH terms