

Nanoparticle suspensions enclosed in methylcellulose: a new approach for quantifying nanoparticles in transmission electron microscopy
- PMID: 27141843
- PMCID: PMC4855187
- DOI: 10.1038/srep25275
Nanoparticle suspensions enclosed in methylcellulose: a new approach for quantifying nanoparticles in transmission electron microscopy
Abstract
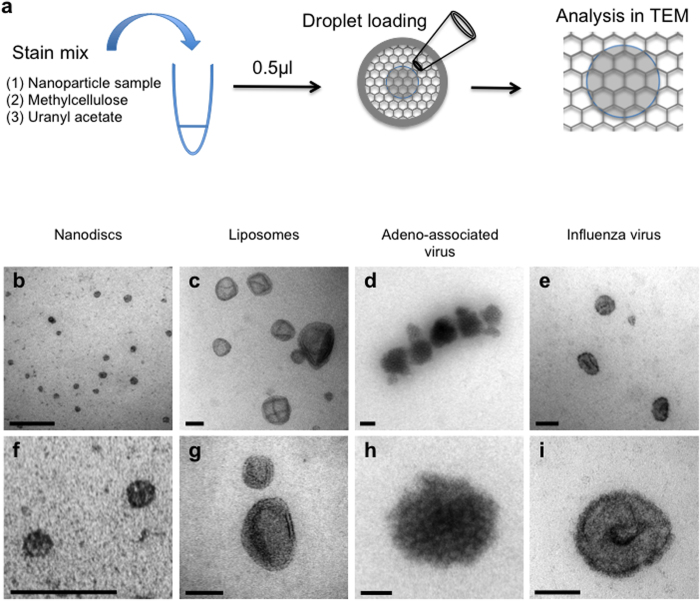
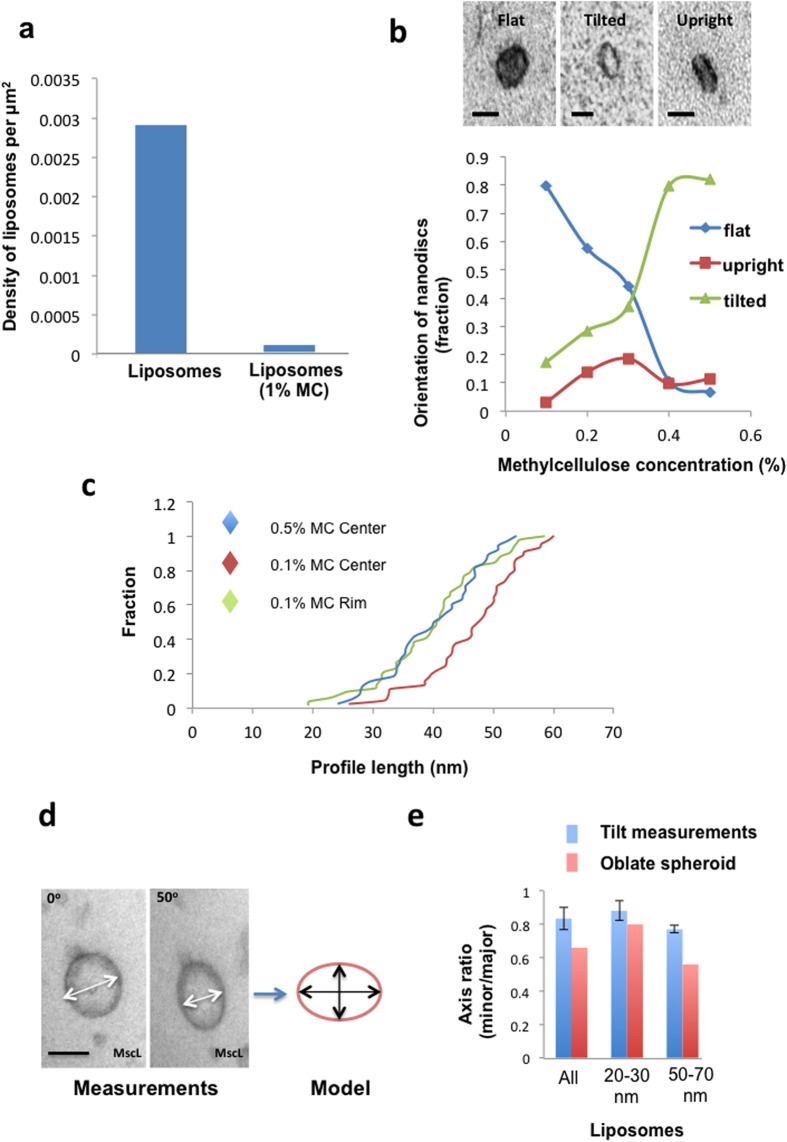
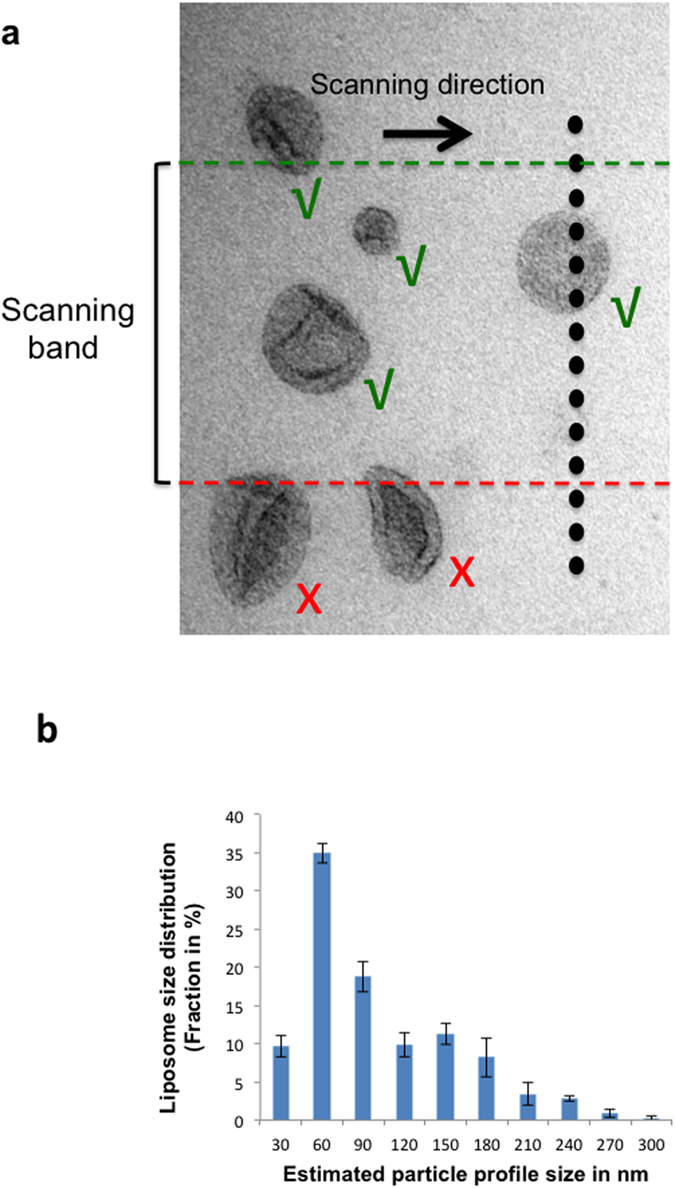
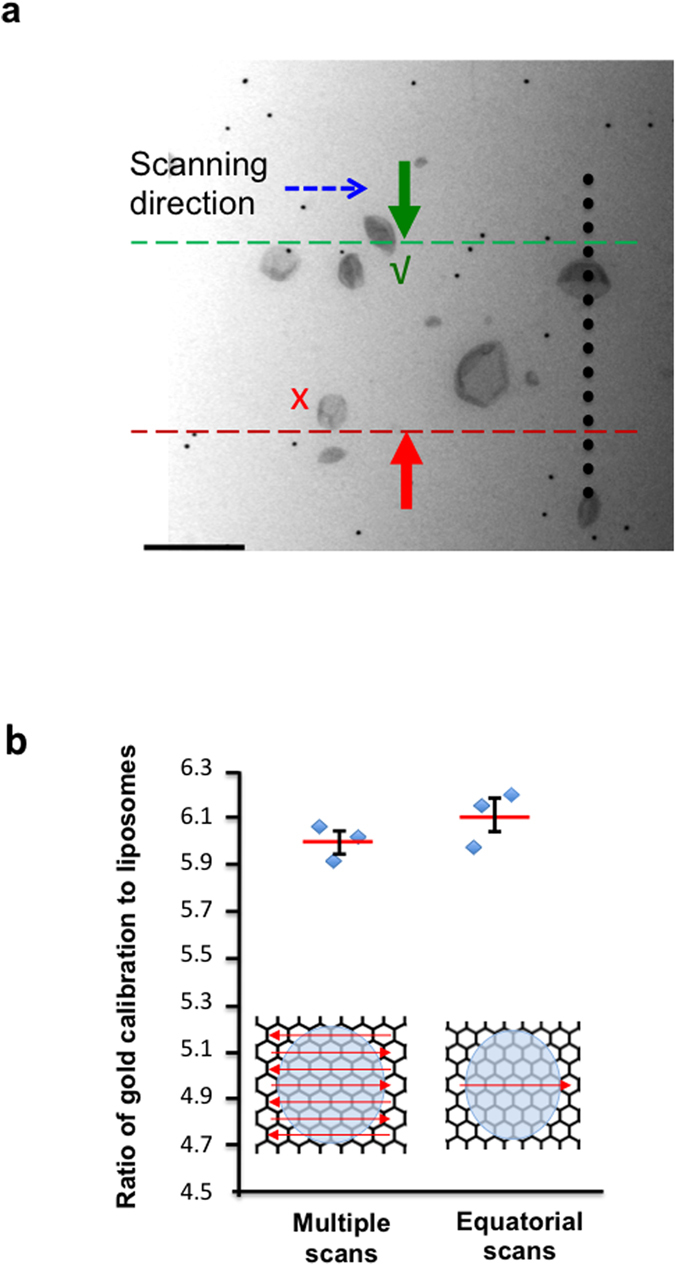
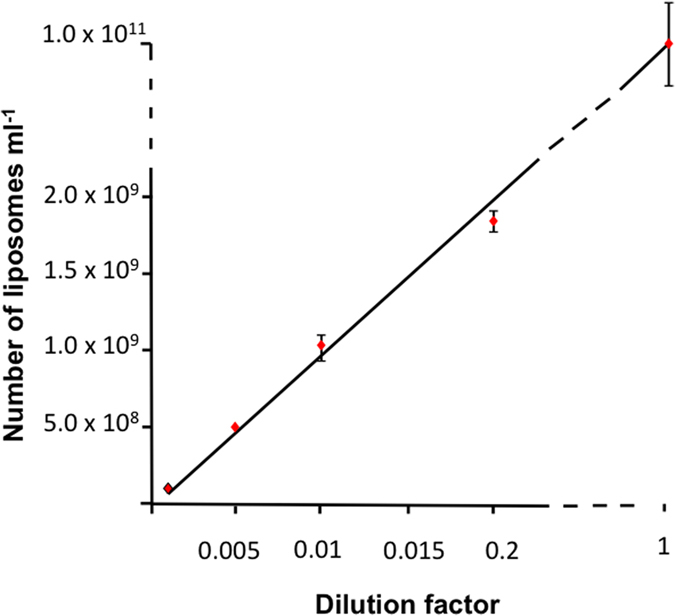
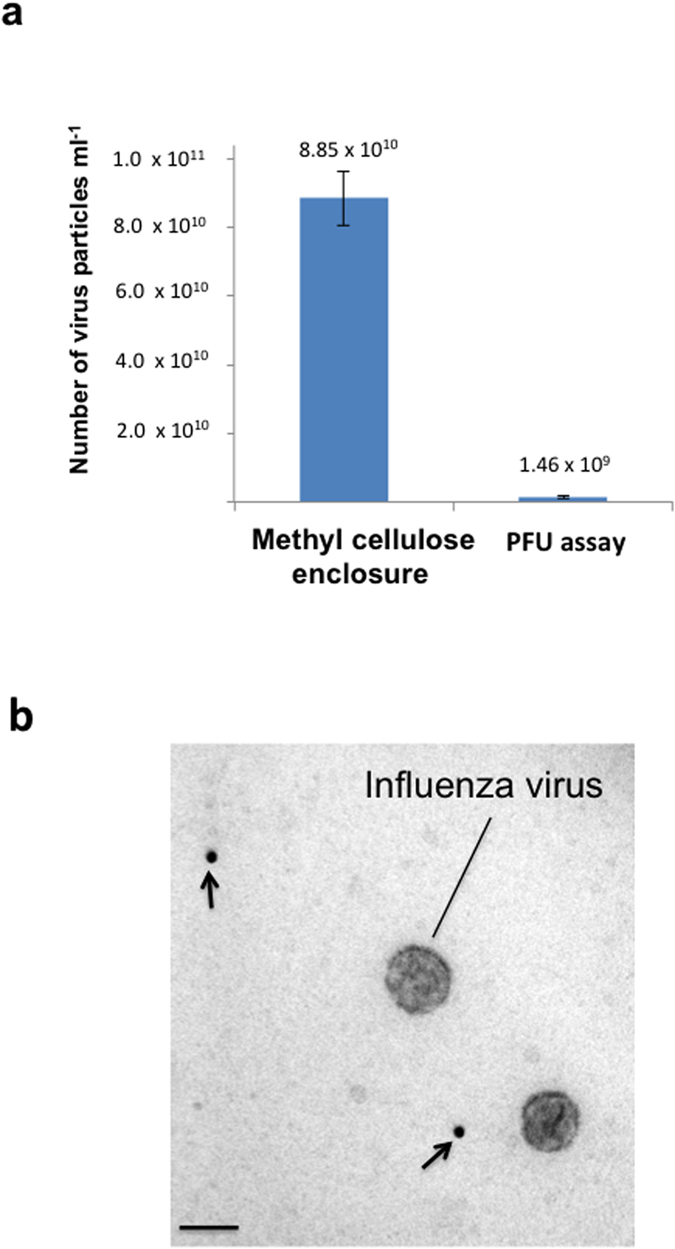
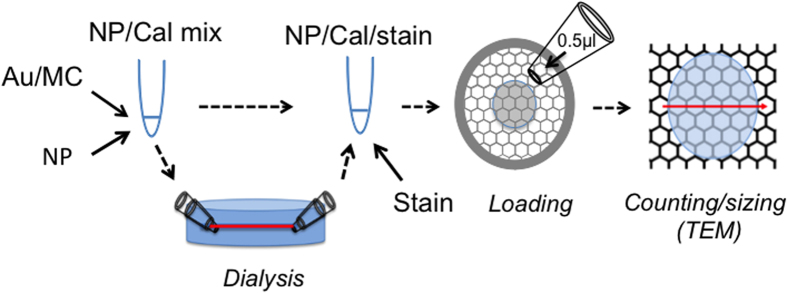
Nanoparticles are of increasing importance in biomedicine but quantification is problematic because current methods depend on indirect measurements at low resolution. Here we describe a new high-resolution method for measuring and quantifying nanoparticles in suspension. It involves premixing nanoparticles in a hydrophilic support medium (methylcellulose) before introducing heavy metal stains for visualization in small air-dried droplets by transmission electron microscopy (TEM). The use of methylcellulose avoids artifacts of conventional negative stain-TEM by (1) restricting interactions between the nanoparticles, (2) inhibiting binding to the specimen support films and (3) reducing compression after drying. Methylcellulose embedment provides effective electron imaging of liposomes, nanodiscs and viruses as well as comprehensive visualization of nanoparticle populations in droplets of known size. These qualities facilitate unbiased sampling, rapid size measurement and estimation of nanoparticle numbers by means of ratio counting using a colloidal gold calibrant. Specimen preparation and quantification take minutes and require a few microliters of sample using only basic laboratory equipment and a standard TEM.
Figures
Similar articles
-
Enhanced imaging of lipid rich nanoparticles embedded in methylcellulose films for transmission electron microscopy using mixtures of heavy metals.Micron. 2017 Aug;99:40-48. doi: 10.1016/j.micron.2017.03.019. Epub 2017 Apr 10. Micron. 2017. PMID: 28419915 Free PMC article.
-
A review of recent methods for efficiently quantifying immunogold and other nanoparticles using TEM sections through cells, tissues and organs.Ann Anat. 2009 Apr;191(2):153-70. doi: 10.1016/j.aanat.2008.11.001. Epub 2008 Nov 30. Ann Anat. 2009. PMID: 19135344 Review.
-
Avoiding drying-artifacts in transmission electron microscopy: Characterizing the size and colloidal state of nanoparticles.Sci Rep. 2015 May 12;5:9793. doi: 10.1038/srep09793. Sci Rep. 2015. PMID: 25965905 Free PMC article.
-
Preparation of viral samples within biocontainment for ultrastructural analysis: Utilization of an innovative processing capsule for negative staining.J Virol Methods. 2016 Dec;238:70-76. doi: 10.1016/j.jviromet.2016.10.005. Epub 2016 Oct 14. J Virol Methods. 2016. PMID: 27751950
-
Cryogenic transmission electron microscopy: aqueous suspensions of nanoscale objects.Microsc Microanal. 2013 Dec;19(6):1542-53. doi: 10.1017/S1431927613013354. Epub 2013 Sep 4. Microsc Microanal. 2013. PMID: 24001937 Review.
Cited by
-
Characterization and Vaccine Potential of Outer Membrane Vesicles from Photobacterium damselae subsp. piscicida.Int J Mol Sci. 2023 Mar 7;24(6):5138. doi: 10.3390/ijms24065138. Int J Mol Sci. 2023. PMID: 36982212 Free PMC article.
-
Developing Electron Microscopy Tools for Profiling Plasma Lipoproteins Using Methyl Cellulose Embedment, Machine Learning and Immunodetection of Apolipoprotein B and Apolipoprotein(a).Int J Mol Sci. 2020 Sep 2;21(17):6373. doi: 10.3390/ijms21176373. Int J Mol Sci. 2020. PMID: 32887372 Free PMC article.
-
Ultrastructural Analysis and Quantification of Peroxisome-Organelle Contacts.Methods Mol Biol. 2023;2643:105-122. doi: 10.1007/978-1-0716-3048-8_8. Methods Mol Biol. 2023. PMID: 36952181
-
Functional redundancy revealed by the deletion of the mimivirus GMC-oxidoreductase genes.Microlife. 2024 Apr 5;5:uqae006. doi: 10.1093/femsml/uqae006. eCollection 2024. Microlife. 2024. PMID: 38659623 Free PMC article.
-
Strategies to enhance the distribution of nanotherapeutics in the brain.J Control Release. 2017 Dec 10;267:232-239. doi: 10.1016/j.jconrel.2017.07.028. Epub 2017 Jul 21. J Control Release. 2017. PMID: 28739449 Free PMC article.
References
-
- Wang L., Wang Y. & Li Z. Nanoparticle-based tumor theranostics with molecular imaging. Curr. Pharm. Biotechnol. 14, 683–692 (2013). - PubMed
-
- Debbage P. & Jaschke W. Molecular imaging with nanoparticles: giant roles for dwarf actors. Histochem Cell Biol., 130, 845–875 (2008). - PubMed
-
- Jain S., Doshi A. S., Iyer A. K. & Amiji M. M. Multifunctional nanoparticles for targeting cancer and inflammatory diseases. J. Drug. Target. 21, 888–903 (2013). - PubMed
-
- Ji T., Zhao Y., Ding Y. & Nie G. Using functional nanomaterials to target and regulate the tumor microenvironment: diagnostic and therapeutic applications. Adv. Mater. 25, 3508–3525 (2013). - PubMed
Publication types
LinkOut - more resources
Full Text Sources
Other Literature Sources
