. 2016 May 3:7:11499.
doi: 10.1038/ncomms11499.

Microglia protect against brain injury and their selective elimination dysregulates neuronal network activity after stroke

Affiliations

Microglia protect against brain injury and their selective elimination dysregulates neuronal network activity after stroke

Gergely Szalay et al. Nat Commun. .

Abstract

Microglia are the main immune cells of the brain and contribute to common brain diseases. However, it is unclear how microglia influence neuronal activity and survival in the injured brain in vivo. Here we develop a precisely controlled model of brain injury induced by cerebral ischaemia combined with fast in vivo two-photon calcium imaging and selective microglial manipulation. We show that selective elimination of microglia leads to a striking, 60% increase in infarct size, which is reversed by microglial repopulation. Microglia-mediated protection includes reduction of excitotoxic injury, since an absence of microglia leads to dysregulated neuronal calcium responses, calcium overload and increased neuronal death. Furthermore, the incidence of spreading depolarization (SD) is markedly reduced in the absence of microglia. Thus, microglia are involved in changes in neuronal network activity and SD after brain injury in vivo that could have important implications for common brain diseases.


Conflict of interest statement

B.L.W. is an employee of Plexxikon. G.K. and B.R. are founders of Femtonics Kft. B.R. is a member of its scientific advisory board.

Figures
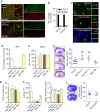
Figure 1
Figure 1. Absence of microglia results in markedly increased brain injury after cerebral ischaemia.
(a) Cx3Cr1GFP/+ mice were fed a chow diet containing the CSF1R antagonist PLX3397 (290 p.p.m.) for 21 days, which resulted in an almost complete elimination of resident brain microglia. Absence of microglia was confirmed by the lack of both GFP (green) and Iba1 (red) signal. Arrowhead indicates microglia (bottom panel). (b) Quantification of microglia in C57BL6/J mice after control or PLX3397 diet. (c) PLX3397 results in microglial apoptosis as indicated by the activation of Cleaved Caspase-3 (Casp3, red) in microglia (GFP, green) in Cx3Cr1GFP/+ mice (arrowheads). No Caspase-3 expression is seen in neurons (NeuN, blue). (d) Elimination of microglia (Iba1-positive cells) from the brain is seen after feeding mice a chow diet containing PLX3397 for 21 days (Depl. PLX +). Microglia remain depleted when the diet is withdrawn for 24 h after 21 days of treatment (Depl. PLX−). Microglial repopulation occurs 2 weeks after diet withdrawal (Depl. Rep.). (e) No changes are seen in Iba1-positive spleen macrophages in response PLX3397 or after microglial repopulation. (f) An absence of microglia leads to markedly increased infarct size 24 h after cerebral ischaemia, which is reversed by microglial repopulation. (g) Cerebral blood flow (CBF) was measured by a laser Doppler during MCA occlusion (expressed as % of baseline). (h) IL-6 levels in the CSF 24 h after cerebral ischaemia. (i) Elimination of microglia did not increase the recruitment of CD45-positive leukocytes into the brain 24 h after cerebral ischemia. (j) Intraperitoneal administration of PLX3397 1 h after the onset of ischaemia did not alter brain injury as assessed 24 h after MCAo. Data are expressed as mean±s.e.m. b: two-way analysis of variance (ANOVA) followed by Sidak's multiple comparison, N=8–10; d–i: one-way ANOVA followed by Tukey's multiple comparison, N=7–11; (j): unpaired t test, N=7, *P<0.05, **P<0.01, ****P<0.0001 versus the control group; ###P<0.001 versus Depl. Rep; NS, not significant. Scale bars, a, 100 μm; c, 10 μm.
Figure 2
Figure 2. Fast in vivo two-photon calcium imaging reveals delayed development of excitotoxicity in the cerebral cortex after cerebral ischaemia.
(a) AAV-mediated delivery of the genetically encoded calcium indicator GCaMP6s was performed two weeks before in vivo two-photon imaging with an injection site distant from the imaging area to minimize disturbance to the brain tissue. Cerebral ischaemia was induced by a remote filament approach of MCAo allowing precise control of occlusion and reperfusion during in vivo two-photon imaging. To monitor neuronal calcium responses in all stages of cerebral ischaemia, fast resonant scanning was performed at repeated 2 min recordings at 31.25 frames second followed by a 5-min break,continuously for up to 6 h including the assessment of baseline neuronal activity, 60 min occlusion of the MCA and 4–5 h reperfusion. (b) Cerebral blood flow (CBF) was measured by a laser Doppler over the MCA (1) and at different sites within (2–3) and outside (4) the area of the cranial window (N=5 mice). (c) Representative images showing GCaMP6s signal changes in a group of neurons (arrows) imaged in vivo before and during MCA occlusion followed by reperfusion in the cerebral cortex over a 310 min period. Images represent average intensity projections of a 2 min resonant scanning session for each data point. (d) Representative graph showing GCaMP6s signal changes over time in mice (N=4) that had been subjected to 60 min MCAo followed by 4 h reperfusion (blue line) and in sham animals (black line). Integrated density values were expressed as a percentage of baseline (IntDen%). (e) Spreading depolarizations (SD) are initiated 2.5–4 h after the onset of ischemia. Images show neuronal calcium changes during a single 2 min resonant scanning session, arrows indicate the wavefront of depolarization. Calcium curves from five representative neurons are shown in different colours. (f) Quantification of average GCaMP6s signal changes reveals delayed development of excitotoxic responses after stroke (N=38 neurons from 4 mice). Data are expressed as mean±s.e.m. b,f: one-way analysis of variance followed by Tukey's multiple comparison. Scale bars, c,e: 50 μm.
Figure 3
Figure 3. Microglia interact with neurons in an activity-dependent manner and respond to SD after cerebral ischaemia.
(a) Activated microglial cells (Iba1, red) surround neurons showing high GCaMP6s signal (green, arrowheads), in the boundary zone of the infarct after cerebral ischaemia. (b) Reconstruction of in vivo two-photon images at different Z-planes show microglial process coverage of neurons (RCaMP1, red) in the cerebral cortex in Cx3Cr1GFP/+ microglia reporter mice (arrowheads) 2 h after the onset of ischaemia (c) In vivo two-photon imaging reveals microglial process extension (red arrowheads) in Cx3Cr1GFP/+ mice to neurons with increasing intracellular calcium levels (RCaMP1, pseudocolored) after cerebral ischaemia, whereas decreasing neuronal RCaMP1 signal is associated with microglial process withdrawal (yellow arrowheads). (d) Microglial process recruitment correlates significantly with changes in neuronal calcium levels after cerebral ischaemia (linear regression, N=35 microglial processes). (e) Measurement of microglial process density in concentric circles around individual neurons (modified Sholl analysis, N=35) showing microglial process recruitment to the neuronal cell body (circled in blue) over time after MCAo. Graph showing significant correlation between intracellular calcium levels in neurons (N=45) based on RCaMP1 signal changes (blue line) and microglial process coverage (black line) over time. (f) Spreading depolarization (SD) initiated after cerebral ischaemia rapidly increase microglial process coverage of neurons in the cerebral cortex. (g) Graph showing the kinetics of microglial process recruitment after SD. After SD, microglial process coverage of neurons (N=41) increases, even if intracellular calcium returns to near-baseline levels ((h), N=17 neurons, unpaired t test). Integrated density values on e,g were expressed as a percentage of baseline (IntDen%). (i) STORM super-resolution microscopy reveals a close contact between P2Y12-postitive microglial processes (cyan) and GCaMP6s-positive neurons (green). P2Y12 receptors form clusters at sites of microglia-neuron interaction (arrowheads). (j) Microglial processes and P2Y12 clusters (arrowheads) are found in close proximity to the neuronal cell membrane distant from GFAP-positive (dark blue) astrocyte processes (arrows). (i,j) Representative images from the cerebral cortex of mice subjected to MCAo. Data are expressed as mean±s.e.m. Scale bars, a: 50 μm; b,c,f: 10 μm; i,j: 5 μm (inserts 500 nm).
Figure 4
Figure 4. Microglia shape neuronal activity after cerebral ischaemia.
(a) Neuronal GCaMP6s signal changes were assessed by in vivo two-photon imaging in the cerebral cortex using 2 min long recordings with fast resonant scanning (31.25 frames per second), separated by 5 min breaks. In control mice no significant GCaMP6s signal intensity changes were seen before the occurrence of spreading depolarizations (SD) starting typically 1.5–3 h post-reperfusion (left panel, inserts shown at Reperfusion 90′). In contrast, an absence of microglia resulted in slow neuronal oscillations (at ≈0.1 Hz frequency) already during occlusion, with similar changes seen after reperfusion (right panel). Representative calcium transients from 10–10 individual neurons (white arrows, calcium responses are indicated by different colours) are shown on the top panels from control and microglia-depleted mice. (b) Lack of microglia resulted in the absence of SD. (c) Average GCaMP6s intensity of 2 min recordings was increased at late reperfusion in control mice due to initiation of SDs, compared to microglia-depleted animals. Integrated density values were expressed as a percentage of baseline (IntDen%). (d) In contrast, cumulative calcium load (expressed in % of control) as calculated by summing up calcium curve integrales of individual neurons during the 2 min long two-photon recordings over a course of 5.5 h (baseline, 60 min occlusion and 4 h reperfusion) was significantly increased in microglia-depleted animals. (e) Microglia-depleted animals reach increased calcium load over baseline significantly earlier (due to continuous neuronal depolarizations) than control mice (due to delayed initiation of SD). (f) Cresyl violet staining reveals marked neuronal death in the imaging site in microglia-depleted mice compared to controls. (g). Quantification of cresyl violet-stained neurons (N=8 mice, two-way analysis of variance (ANOVA), followed by Sidak's multiple comparison) at the imaging site in the cerebral cortex and the corresponding contralateral hemisphere. Data are expressed as mean±s.e.m. b: N=4 mice per group, unpaired t-test; c: two-way ANOVA followed by Dunn's multiple comparison; d,e: unpaired t-test, ce: N=52 neurons from 4 individual mice. ##P<0.01, ###P<0.001 versus contralateral, ***P<0.001 control versus depleted. Scale bars, a, 50 μm; f, 200 μm.
Figure 5
Figure 5. Microglia shape neuronal activity in the non-ischaemic brain
(a) Outline of experimental procedures to investigate KCl-induced neuronal depolarization in the absence of microglia. Three weeks after feeding mice a control or a PLX3397 diet (290 p.p.m.), and two weeks following GCaMP6s delivery, spreading depolarizations (SDs) were induced by 100 mM KCl for 25 min followed by a 15 min rinse: the protocol was repeated three times. (b) Neurons in the cerebral cortex of control mice displayed rapid SD generation after induction by KCl (left panel, arrows indicate the evolving SD wavefront). An absence of microglia resulted in a very low incidence of SD and a low level of depolarizations compared to that seen in control animals (arrowheads indicate a pale depolarization wave seen in the absence of microglia). Representative calcium curves of 10 individual neurons are shown on the top of the panel. (c) SD induction probability (number of successful SD inductions/number of KCl applications) was markedly reduced in the absence of microglia. (d) Latency to depolarisation after KCl administration was significantly increased in microglia-depleted animals. (e) KCl-induced depolarization resulted in significantly lower levels of GCaMP6s signal in the absence of microglia compared to control mice. c,d and e graphs show mean±s.e.m. N=102 neurons from 4 individual mice. c, Mann–Whitney test; d,e, unpaired t-test. *P<0.05, ****P<0.0001. Scale bar, b, 50 μm.
Figure 6
Figure 6. Selective depletion of microglia does not alter blood brain barrier injury after cerebral ischaemia
In vivo two-photon imaging was performed in control mice and in mice that were fed a chow diet containing PLX3397 (290 p.p.m.) for three weeks to selectively eliminate microglia from the brain. In Cx3Cr1GFP/+ mice, Dextran rhodamine (1 mg per mouse in 150 μl volume) was administered via the jugular vein 15 min before MCAo. Z-stacks between 100 and 300 μm below the dura mater were recorded every 3 min over a 4–5 h period before, and after the onset of ischaemia. (a) In vivo two-photon microscopy revealed increasing Dextran Rhodamine fluorescence signal in the extravascular space indicating blood brain barrier damage following cerebral ischaemia. Areas of blood brain barrier breakdown in control mice were monitored by microglia (arrowheads), which acquire an activated phenotype over time. Remaining microglia in a microglia-depleted mouse is indicated by an arrow. (b) Quantification of Dextran rhodamine intensity changes in the brain parenchyma over time, before and after cerebral ischaemia in control and microglia-depleted animals. Integrated density values were expressed as a percentage of baseline. (c) Quantification of Dextran Rhodamine intensity changes in the glia limitans. Quantitative data (mean±s.e.m.) from N=12 blood vessels in control and N=8 blood vessels in microglia-depleted animals, from 3 mice per group, analysed with two-way analysis of variance followed by Dunn's multiple comparison. (d) BBB injury (mm3) in control and microglia-depleted mice (mean±s.e.m., N=8–10 mice, unpaired t-test) as measured by leakage of plasma-derived IgG into the brain parenchyma 24 h after MCAo. NS, not significant. Scale bar, a, 50 μm.

Similar articles

Cited by

References

    1. Kettenmann H., Hanisch U. K., Noda M. & Verkhratsky A. Physiology of microglia. Physiol. Rev. 91, 461–553 (2011). - PubMed
    1. Block M. L., Zecca L. & Hong J. S. Microglia-mediated neurotoxicity: uncovering the molecular mechanisms. Nat. Rev. Neurosci. 8, 57–69 (2007). - PubMed
    1. Dheen S. T., Kaur C. & Ling E. A. Microglial activation and its implications in the brain diseases. Curr. Med. Chem. 14, 1189–1197 (2007). - PubMed
    1. Iadecola C. & Anrather J. The immunology of stroke: from mechanisms to translation. Nat. Med. 17, 796–808 (2011). - PMC - PubMed
    1. Denes A., Thornton P., Rothwell N. J. & Allan S. M. Inflammation and brain injury: acute cerebral ischaemia, peripheral and central inflammation. Brain Behav. Immun. 24, 708–723 (2010). - PubMed

Publication types

Substances