An unbiased metric of antiproliferative drug effect in vitro
- PMID: 27135974
- PMCID: PMC4887341
- DOI: 10.1038/nmeth.3852
An unbiased metric of antiproliferative drug effect in vitro
Abstract
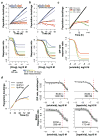
In vitro cell proliferation assays are widely used in pharmacology, molecular biology, and drug discovery. Using theoretical modeling and experimentation, we show that current metrics of antiproliferative small molecule effect suffer from time-dependent bias, leading to inaccurate assessments of parameters such as drug potency and efficacy. We propose the drug-induced proliferation (DIP) rate, the slope of the line on a plot of cell population doublings versus time, as an alternative, time-independent metric.
Figures


Similar articles
-
Growth rate inhibition metrics correct for confounders in measuring sensitivity to cancer drugs.Nat Methods. 2016 Jun;13(6):521-7. doi: 10.1038/nmeth.3853. Epub 2016 May 2. Nat Methods. 2016. PMID: 27135972 Free PMC article.
-
Discovery and computer aided potency optimization of a novel class of small molecule CXCR4 antagonists.PLoS One. 2013 Oct 18;8(10):e78744. doi: 10.1371/journal.pone.0078744. eCollection 2013. PLoS One. 2013. PMID: 24205302 Free PMC article.
-
Ligand-based chemoinformatic discovery of a novel small molecule inhibitor targeting CDC25 dual specificity phosphatases and displaying in vitro efficacy against melanoma cells.Oncotarget. 2015 Nov 24;6(37):40202-22. doi: 10.18632/oncotarget.5473. Oncotarget. 2015. PMID: 26474275 Free PMC article.
-
Hit triage using efficiency indices after screening of compound libraries in drug discovery.Curr Top Med Chem. 2009;9(18):1718-24. doi: 10.2174/156802609790102365. Curr Top Med Chem. 2009. PMID: 19929837 Review.
-
The benefits of in silico modeling to identify possible small-molecule drugs and their off-target interactions.Future Med Chem. 2018 Feb;10(4):423-432. doi: 10.4155/fmc-2017-0151. Epub 2018 Jan 30. Future Med Chem. 2018. PMID: 29380627 Review.
Cited by
-
Alternative drug sensitivity metrics improve preclinical cancer pharmacogenomics.Nat Biotechnol. 2017 Jun 7;35(6):500-502. doi: 10.1038/nbt.3882. Nat Biotechnol. 2017. PMID: 28591115 Free PMC article. No abstract available.
-
An incoherent feedforward loop interprets NFκB/RelA dynamics to determine TNF-induced necroptosis decisions.Mol Syst Biol. 2020 Dec;16(12):e9677. doi: 10.15252/msb.20209677. Mol Syst Biol. 2020. PMID: 33314666 Free PMC article.
-
DebarcodeR increases fluorescent cell barcoding capacity and accuracy.Cytometry A. 2021 Sep;99(9):946-953. doi: 10.1002/cyto.a.24363. Epub 2021 May 21. Cytometry A. 2021. PMID: 33960644 Free PMC article.
-
Multiplexed and reproducible high content screening of live and fixed cells using Dye Drop.Nat Commun. 2022 Nov 14;13(1):6918. doi: 10.1038/s41467-022-34536-7. Nat Commun. 2022. PMID: 36376301 Free PMC article.
-
Understanding the effect of measurement time on drug characterization.PLoS One. 2020 May 14;15(5):e0233031. doi: 10.1371/journal.pone.0233031. eCollection 2020. PLoS One. 2020. PMID: 32407356 Free PMC article.
References
-
- Berns K, et al. A large-scale RNAi screen in human cells identifies new components of the p53 pathway. Nature. 2004;428:431–437. - PubMed
Publication types
MeSH terms
Substances
Grants and funding
LinkOut - more resources
Full Text Sources
Other Literature Sources

