Paeoniflorin suppresses TGF-β mediated epithelial-mesenchymal transition in pulmonary fibrosis through a Smad-dependent pathway
- PMID: 27133302
- PMCID: PMC4954768
- DOI: 10.1038/aps.2016.36
Paeoniflorin suppresses TGF-β mediated epithelial-mesenchymal transition in pulmonary fibrosis through a Smad-dependent pathway
Abstract
Aim: Paeoniflorin has shown to attenuate bleomycin-induced pulmonary fibrosis (PF) in mice. Because the epithelial-mesenchymal transition (EMT) in type 2 lung endothelial cells contributes to excessive fibroblasts and myofibroblasts during multiple fibrosis of tissues, we investigated the effects of paeoniflorin on TGF-β mediated pulmonary EMT in bleomycin-induced PF mice.
Methods: PF was induced in mice by intratracheal instillation of bleomycin (5 mg/kg). The mice were orally treated with paeoniflorin or prednisone for 21 d. After the mice were sacrificed, lung tissues were collected for analysis. An in vitro EMT model was established in alveolar epithelial cells (A549 cells) incubated with TGF-β1 (2 ng/mL). EMT identification and the expression of related proteins were performed using immunohistochemistry, transwell assay, ELISA, Western blot and RT-qPCR.
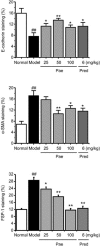
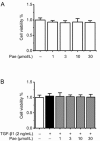
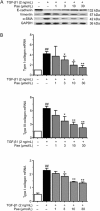
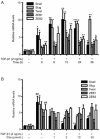
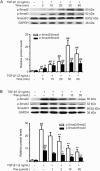
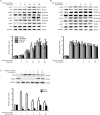
Results: In PF mice, paeoniflorin (50, 100 mg·kg(-1)·d(-1)) or prednisone (6 mg·kg(-1)·d(-1)) significantly decreased the expression of FSP-1 and α-SMA, and increased the expression of E-cadherin in lung tissues. In A549 cells, TGF-β1 stimulation induced EMT, as shown by the changes in cell morphology, the increased cell migration, and the increased vimentin and α-SMA expression as well as type I and type III collagen levels, and by the decreased E-cadherin expression. In contrast, effects of paeoniflorin on EMT disappeared when the A549 cells were pretreated with TGF-β1 for 24 h. TGF-β1 stimulation markedly increased the expression of Snail and activated Smad2/3, Akt, ERK, JNK and p38 MAPK in A549 cells. Co-incubation with paeoniflorin (1-30 μmol/L) dose-dependently attenuated TGF-β1-induced expression of Snail and activation of Smad2/3, but slightly affected TGF-β1-induced activation of Akt, ERK, JNK and p38 MAPK. Moreover, paeoniflorin markedly increased Smad7 level, and decreased ALK5 level in A549 cells.
Conclusion: Paeoniflorin suppresses the early stages of TGF-β mediated EMT in alveolar epithelial cells, likely by decreasing the expression of the transcription factors Snail via a Smad-dependent pathway involving the up-regulation of Smad7.
Figures


Similar articles
-
Paeoniflorin, the main active constituent of Paeonia lactiflora roots, attenuates bleomycin-induced pulmonary fibrosis in mice by suppressing the synthesis of type I collagen.J Ethnopharmacol. 2013 Oct 7;149(3):825-32. doi: 10.1016/j.jep.2013.08.017. Epub 2013 Aug 22. J Ethnopharmacol. 2013. PMID: 23973787
-
Tanshinone IIA ameliorates bleomycin-induced pulmonary fibrosis and inhibits transforming growth factor-beta-β-dependent epithelial to mesenchymal transition.J Surg Res. 2015 Jul;197(1):167-75. doi: 10.1016/j.jss.2015.02.062. Epub 2015 Mar 13. J Surg Res. 2015. PMID: 25911951
-
Regulation of Transforming Growth Factor-β/Smad-mediated Epithelial-Mesenchymal Transition by Celastrol Provides Protection against Bleomycin-induced Pulmonary Fibrosis.Basic Clin Pharmacol Toxicol. 2018 Aug;123(2):122-129. doi: 10.1111/bcpt.12975. Epub 2018 May 28. Basic Clin Pharmacol Toxicol. 2018. PMID: 29394529
-
[Aberrant Activation Mechanism of TGF-β Signaling in Epithelial-mesenchymal Transition].Yakugaku Zasshi. 2021;141(11):1229-1234. doi: 10.1248/yakushi.21-00143. Yakugaku Zasshi. 2021. PMID: 34719542 Review. Japanese.
-
Cytokines as drivers: Unraveling the mechanisms of epithelial-mesenchymal transition in COVID-19 lung fibrosis.Biochem Biophys Res Commun. 2023 Dec 17;686:149118. doi: 10.1016/j.bbrc.2023.10.050. Epub 2023 Oct 14. Biochem Biophys Res Commun. 2023. PMID: 37931361 Review.
Cited by
-
PM2.5 Exposure Induces Lung Injury and Fibrosis by Regulating Ferroptosis via TGF-β Signaling.Dis Markers. 2022 Sep 27;2022:7098463. doi: 10.1155/2022/7098463. eCollection 2022. Dis Markers. 2022. Retraction in: Dis Markers. 2023 Jul 26;2023:9879138. doi: 10.1155/2023/9879138 PMID: 36204510 Free PMC article. Retracted.
-
Natural products as home-based prophylactic and symptom management agents in the setting of COVID-19.Phytother Res. 2020 Dec;34(12):3148-3167. doi: 10.1002/ptr.6794. Epub 2020 Aug 17. Phytother Res. 2020. PMID: 32881214 Free PMC article. Review.
-
Schisandra Inhibit Bleomycin-Induced Idiopathic Pulmonary Fibrosis in Rats via Suppressing M2 Macrophage Polarization.Biomed Res Int. 2020 Aug 20;2020:5137349. doi: 10.1155/2020/5137349. eCollection 2020. Biomed Res Int. 2020. PMID: 32884941 Free PMC article.
-
The gut-lung axis: Gut microbiota changes associated with pulmonary fibrosis in mouse models induced by bleomycin.Front Pharmacol. 2022 Sep 30;13:985223. doi: 10.3389/fphar.2022.985223. eCollection 2022. Front Pharmacol. 2022. PMID: 36249808 Free PMC article.
-
Paeoniflorin inhibits IL-1β-induced MMP secretion via the NF-κB pathway in chondrocytes.Exp Ther Med. 2018 Aug;16(2):1513-1519. doi: 10.3892/etm.2018.6325. Epub 2018 Jun 19. Exp Ther Med. 2018. PMID: 30116400 Free PMC article.
References
-
- Bouros D. Pirfenidone for idiopathic pulmonary fibrosis. Lancet 2011; 377: 1727–9. - PubMed
-
- Raghu G, Weycker D, Edelsberg J, Bradford WZ, Oster G. Incidence and prevalence of idiopathic pulmonary fibrosis. Am J Respir Crit Care Med 2006; 174: 810–6. - PubMed
-
- Gross TJ, Hunninghake GW. Idiopathic pulmonary fibrosis. N Engl J Med 2001; 345: 517–25. - PubMed
-
- Polyakova V, Loeffler I, Hein S, Miyagawa S, Piotrowska I, Dammer S, et al. Fibrosis in endstage human heart failure: Severe changes in collagen metabolism and MMP/TIMP profiles. Int J Cardiol 2011; 151: 18–33. - PubMed
-
- Crouch E. Pathobiology of pulmonary fibrosis. Am J Physiol 1990; 259: L159–84. - PubMed
MeSH terms
Substances
LinkOut - more resources
Full Text Sources
Other Literature Sources
Medical
Research Materials
Miscellaneous

