. 2016 May 1;30(9):1101-15.
doi: 10.1101/gad.275685.115. Epub 2016 Apr 28.

The pluripotency factor Nanog regulates pericentromeric heterochromatin organization in mouse embryonic stem cells

Affiliations

The pluripotency factor Nanog regulates pericentromeric heterochromatin organization in mouse embryonic stem cells

Clara Lopes Novo et al. Genes Dev. .

Abstract

An open and decondensed chromatin organization is a defining property of pluripotency. Several epigenetic regulators have been implicated in maintaining an open chromatin organization, but how these processes are connected to the pluripotency network is unknown. Here, we identified a new role for the transcription factor NANOG as a key regulator connecting the pluripotency network with constitutive heterochromatin organization in mouse embryonic stem cells. Deletion of Nanog leads to chromatin compaction and the remodeling of heterochromatin domains. Forced expression of NANOG in epiblast stem cells is sufficient to decompact chromatin. NANOG associates with satellite repeats within heterochromatin domains, contributing to an architecture characterized by highly dispersed chromatin fibers, low levels of H3K9me3, and high major satellite transcription, and the strong transactivation domain of NANOG is required for this organization. The heterochromatin-associated protein SALL1 is a direct cofactor for NANOG, and loss of Sall1 recapitulates the Nanog-null phenotype, but the loss of Sall1 can be circumvented through direct recruitment of the NANOG transactivation domain to major satellites. These results establish a direct connection between the pluripotency network and chromatin organization and emphasize that maintaining an open heterochromatin architecture is a highly regulated process in embryonic stem cells.

Keywords: embryonic stem cells; heterochromatin; nuclear organization; pluripotency.


Figures

Figure 1.
Figure 1.
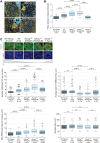
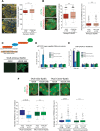
Nanog is required for open heterochromatin organization in ESCs. (A) ESI analysis of wild-type (WT), Nanog–/–, Nanog+/–, and Nanog-overexpressing ESCs. Quantitative phosphorus and nitrogen ratio images were segmented to show chromatin in yellow and protein-based structures in blue. The nuclear membrane is indicated with arrowheads. The regions imaged contain H3K9me3-positive PCH as determined by correlative immunofluorescent microscopy. Bar, 0.5 μm. (B) Box and whisker plots show the distribution of heterochromatin fiber density as revealed by phosphorus images. Data were compared using a one-way ANOVA followed by Bonferroni's multiple comparison test. (C) Chromocenter organization revealed by immunofluorescent analysis of H3K9me3 in ESCs expressing different levels of Nanog. Note that H3K9me3 foci are formed from PCH and do not overlap with other heterochromatin compartments, including telomeres. OCT4 labeling confirms the undifferentiated status of the cell type. Bar, 2 µm. Box and whisker plots show the number (top left), size (top right), and total area (bottom left) of H3K9me3 foci per nucleus. (Bottom right) Nuclear area was unchanged. Data were compared using a one-way ANOVA followed by Bonferroni's multiple comparison test. Data were collected from at least two independent experiments.
Figure 2.
Figure 2.
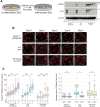
The timing of chromatin remodeling upon ESC differentiation is consistent with a role for Nanog in orchestrating these nuclear organization events. (A) Western blot of Nanog–/–, wild-type (WT), and Nanog-overexpressing ESCs over 5 d of differentiation with NANOG and OCT4 antibodies. (B) Chromocenter organization revealed by immunofluorescent analysis of H3K9me3 during ESC differentiation. (Dashed line) Nuclear periphery. Bar, 2 µm. (C) Box and whisker plots show the number (left) and size (right) of H3K9me3 foci per nucleus. Data were compared using a one-way ANOVA followed by Bonferroni's multiple comparison test. (n.s.) P > 0.1; (*) P < 0.01. n > 50 per time point.
Figure 3.
Figure 3.
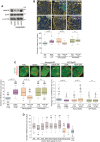
Nanog is sufficient to remodel heterochromatin in EpiSCs. (A) Western blot of NANOG and OCT4 in ESCs, EpiSCs, and doxycycline (DOX)-inducible Nanog-EpiSCs. DOX was applied for 24 h. (B) ESI analysis of ESCs, EpiSCs, DOX-inducible Nanog-EpiSCs, and DOX-inducible GFP-EpiSCs. DOX was applied for 24 h. The nuclear membrane is indicated by arrowheads. Bar, 0.5 μm. Box and whisker plots reveal the distribution in size of the chromatin clusters. P-values were calculated using Student's t-test. (C) Chromocenter organization revealed by immunofluorescent analysis of H3K9me3. OCT4 labeling confirmed the undifferentiated status of the cell type. DOX was applied for 24 h. Bar, 2 µm. Box and whisker plots show the number (left) and size (right) of H3K9me3 foci per nucleus. P-values were calculated using Student's t-test. (n.s.) P > 0.1. Data were collected from at least two independent experiments. (D) Several pluripotency factors were overexpressed in EpiSCs for 24 h; only Nanog was able to remodel chromocenter organization. Box and whisker plots show the number of H3K9me3 foci per nucleus. n = 50 per cell line (images are shown in Supplemental Fig. 4A.)
Figure 4.
Figure 4.
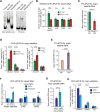
NANOG associates with major satellite repeats in ESCs. (A) His-tagged recombinant wild-type and N51A mutant NANOG homeodomains were used for electrophoretic mobility shift assays with a full-length major satellite probe (234 bp) (Bulut-Karslioglu et al. 2012) and a Tcf3 probe (14 bp) (Jauch et al. 2008). (B) ChIP-qPCR analysis of NANOG at major satellite, LINE, SINE, and IAP DNA in wild-type and Nanog–/– ESCs. (C) RT-qPCR for major satellite transcripts in wild-type and Nanog–/– ESCs. Values were normalized to Hmbs and are shown relative to wild type. (D) ChIP-qPCR for H3K9me3, H3K9ac, and IgG (normalized to unmodified H3) (left) and SUV39H1 and IgG (normalized to IgG) (right) at major satellite DNA in wild-type and Nanog–/– ESCs. (E) RT-qPCR for major satellite transcripts in ESCs that were separated by flow cytometry for Nanog low-expressing and Nanog high-expressing cells using an ESC line with eGFP inserted into one Nanog allele (TNGA). (F) ChIP-qPCR analysis of NANOG at major satellite DNA, LINE, and SINE in Nanog-EpiSCs with and without 24 h of DOX induction. (G) RT-qPCR for major satellite transcripts in Nanog-EpiSCs with and without 24 h of DOX induction. Values were normalized to Hmbs. (H) ChIP-qPCR for H3K9me3, H3K9ac, and IgG at major satellite DNA in Nanog-EpiSCs with and without 24 h of DOX induction. Values were normalized to unmodified H3. All data represent mean ± SD from three biological experiments.
Figure 5.
Figure 5.
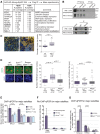
The NANOG transactivation domain is necessary and sufficient for heterochromatin remodeling. (A) ESI analysis of DOX-inducible NanogΔC-EpiSCs. DOX was applied for 24 h. The nuclear membrane is indicated by arrowheads. Bar, 0.5 μm. Box and whisker plots reveal the distribution in size of chromatin clusters. P-value was calculated using Student's t-test. (n.s.) P > 0.1. (B) Chromocenter organization revealed by immunofluorescent analysis of H3K9me3. OCT4 labeling confirmed the undifferentiated status of the cell type. DOX was applied for 24 h. Bar, 2 μm. Box and whisker plots show the number (left) and size (right) of H3K9me3 foci per nucleus. P-values were calculated using Student's t-test. (n.s.) P > 0.1. (C) Diagram of transcription activator-like effector (TALE)-CD2 and TALE-mClover fusion proteins and a fluorescent microscopy image demonstrating localization of TALE-mClover to chromocenters after 24 h of DOX induction in EpiSCs. (D) RT-qPCR for major satellite transcripts, LINE, and SINE in TALE-CD2-EpiSCs and TALE-mClover-EpiSCs with and without 24 h of DOX induction. Values were normalized to Hmbs. (E) ChIP-qPCR for H3K9me3 at major satellite, LINE, and SINE DNA in TALE-CD2-EpiSCs and TALE-mClover-EpiSCs with and without 24 h of DOX induction. Values were normalized to unmodified H3. All data represent mean ± SD from at least three biological experiments. (F) Chromocenter organization revealed by immunofluorescent analysis of H3K9me3. Box and whisker plots show the number (left) and size (right) of H3K9me3 foci per nucleus.
Figure 6.
Figure 6.
SALL1 binds NANOG directly and is required for open heterochromatin organization in ESCs. (A) Table showing a subset of proteins copurifying with 2xFlag-Nanog in EpiSCs, as identified by mass spectrometry. (B, top) Coimmunoprecipitation of endogenous NANOG from wild-type ESC nuclear extracts, analyzed by Western blot (WB). Benzonase (Benzo) and ethidium bromide (Et. Br.) were added where indicated. (Bottom) Coimmunoprecipitation of recombinant NANOG and SALL1, analyzed by Western blot. (C) ESI analysis of wild-type (WT) and Sall1–/– ESCs. The nuclear membrane is indicated by an arrowhead. Bar, 0.5 μm. Box and whisker plots reveal the distribution in size of chromatin clusters. P-value was calculated using Student's t-test. Heterochromatin fiber density was also significantly increased in Sall1–/– ESCs (data not shown). (D) Chromocenter organization revealed by immunofluorescent analysis of H3K9me3. OCT4 labeling confirmed the undifferentiated status of the cell type. Bar, 2 µm. Box and whisker plots show the number (left) and size (right) of H3K9me3 foci per nucleus. Data were compared using a one-way ANOVA followed by Bonferroni's multiple comparison test. Data were collected from at least two independent experiments. (E) ChIP-qPCR analysis of SALL1 and NANOG at major satellite DNA in wild-type, Sall1–/–, and Nanog–/– ESCs. (F) Re-ChIP-qPCR analysis of NANOG and SALL1 co-occupancy at major satellite, LINE, and SINE DNA in wild-type and Nanog–/– ESCs. (G) ChIP-qPCR for H3K9me3, H3K9ac, and IgG at major satellite DNA in wild-type and Sall1–/– ESCs. Values were normalized to unmodified H3. All qPCR data represent mean ± SD from three biological experiments.
Figure 7.
Figure 7.
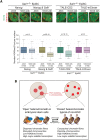
Sall1 is required for Nanog-mediated heterochromatin remodeling. (A) Nanog is unable to remodel chromocenter organization in the absence of Sall1, but recruitment of NANOG-CD2 directly to major satellites can bypass the requirement for Sall1. Chromocenter organization revealed by immunofluorescent analysis of H3K9me3. OCT4 labeling confirmed the undifferentiated status of the cell type. DOX was applied for 24 h. Bar, 2 µm. Box and whisker plots show the number of H3K9me3 foci per nucleus. P-values were calculated using Student's t-test. Data were collected from at least two independent experiments. (B) Model illustrating the role of Nanog in maintaining an open heterochromatin organization in pluripotent cells.

Similar articles

Cited by

References

    1. Ahmed K, Dehghani H, Rugg-Gunn P, Fussner E, Rossant J, Bazett-Jones DP. 2010. Global chromatin architecture reflects pluripotency and lineage commitment in the early mouse embryo. PLoS One 5: e10531. - PMC - PubMed
    1. Bickmore WA, van Steensel B. 2013. Genome architecture: domain organization of interphase chromosomes. Cell 152: 1270–1284. - PubMed
    1. Boskovic A, Eid A, Pontabry J, Ishiuchi T, Spiegelhalter C, Raghu Ram EV, Meshorer E, Torres-Padilla ME. 2014. Higher chromatin mobility supports totipotency and precedes pluripotency in vivo. Genes Dev 28: 1042–1047. - PMC - PubMed
    1. Brambrink T, Foreman R, Welstead GG, Lengner CJ, Wernig M, Suh H, Jaenisch R. 2008. Sequential expression of pluripotency markers during direct reprogramming of mouse somatic cells. Cell Stem Cell 2: 151–159. - PMC - PubMed
    1. Brons IG, Smithers LE, Trotter MW, Rugg-Gunn P, Sun B, Chuva de Sousa Lopes SM, Howlett SK, Clarkson A, Ahrlund-Richter L, Pedersen RA, et al. 2007. Derivation of pluripotent epiblast stem cells from mammalian embryos. Nature 448: 191–195. - PubMed