CD95 maintains stem cell-like and non-classical EMT programs in primary human glioblastoma cells
- PMID: 27124583
- PMCID: PMC4855647
- DOI: 10.1038/cddis.2016.102
CD95 maintains stem cell-like and non-classical EMT programs in primary human glioblastoma cells
Erratum in
-
Correction: CD95 maintains stem cell-like and non-classical EMT programs in primary human glioblastoma cells.Cell Death Dis. 2020 Jul 22;11(7):558. doi: 10.1038/s41419-020-2698-3. Cell Death Dis. 2020. PMID: 32699236 Free PMC article.
Abstract
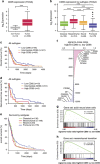
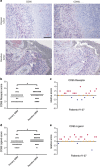
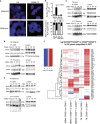
Glioblastoma (GBM) is one of the most aggressive types of cancer with limited therapeutic options and unfavorable prognosis. Stemness and non-classical epithelial-to-mesenchymal transition (ncEMT) features underlie the switch from normal to neoplastic states as well as resistance of tumor clones to current therapies. Therefore, identification of ligand/receptor systems maintaining this privileged state is needed to devise efficient cancer therapies. In this study, we show that the expression of CD95 associates with stemness and EMT features in GBM tumors and cells and serves as a prognostic biomarker. CD95 expression increases in tumors and with tumor relapse as compared with non-tumor tissue. Recruitment of the activating PI3K subunit, p85, to CD95 death domain is required for maintenance of EMT-related transcripts. A combination of the current GBM therapy, temozolomide, with a CD95 inhibitor dramatically abrogates tumor sphere formation. This study molecularly dissects the role of CD95 in GBM cells and contributes the rational for CD95 inhibition as a GBM therapy.
Figures


Similar articles
-
CBF1 is clinically prognostic and serves as a target to block cellular invasion and chemoresistance of EMT-like glioblastoma cells.Br J Cancer. 2017 Jun 27;117(1):102-112. doi: 10.1038/bjc.2017.157. Epub 2017 Jun 1. Br J Cancer. 2017. PMID: 28571041 Free PMC article.
-
Targeted nanocomplex carrying siRNA against MALAT1 sensitizes glioblastoma to temozolomide.Nucleic Acids Res. 2018 Feb 16;46(3):1424-1440. doi: 10.1093/nar/gkx1221. Nucleic Acids Res. 2018. PMID: 29202181 Free PMC article.
-
SPOCK1 is upregulated in recurrent glioblastoma and contributes to metastasis and Temozolomide resistance.Cell Prolif. 2016 Apr;49(2):195-206. doi: 10.1111/cpr.12241. Epub 2016 Feb 28. Cell Prolif. 2016. PMID: 26923184 Free PMC article.
-
Comprehensive understanding of glioblastoma molecular phenotypes: classification, characteristics, and transition.Cancer Biol Med. 2024 May 6;21(5):363-81. doi: 10.20892/j.issn.2095-3941.2023.0510. Cancer Biol Med. 2024. PMID: 38712813 Free PMC article. Review.
-
Emerging Mechanisms by which EMT Programs Control Stemness.Trends Cancer. 2020 Sep;6(9):775-780. doi: 10.1016/j.trecan.2020.03.011. Epub 2020 Apr 17. Trends Cancer. 2020. PMID: 32312682 Review.
Cited by
-
Decitabine Treatment of Glioma-Initiating Cells Enhances Immune Recognition and Killing.PLoS One. 2016 Aug 31;11(8):e0162105. doi: 10.1371/journal.pone.0162105. eCollection 2016. PLoS One. 2016. PMID: 27579489 Free PMC article.
-
Genetic Abnormalities, Clonal Evolution, and Cancer Stem Cells of Brain Tumors.Med Sci (Basel). 2018 Oct 2;6(4):85. doi: 10.3390/medsci6040085. Med Sci (Basel). 2018. PMID: 30279357 Free PMC article. Review.
-
FAS receptor regulates NOTCH activity through ERK-JAG1 axis activation and controls oral cancer stemness ability and pulmonary metastasis.Cell Death Discov. 2022 Mar 5;8(1):101. doi: 10.1038/s41420-022-00899-5. Cell Death Discov. 2022. PMID: 35249111 Free PMC article.
-
CD95/Fas protects triple negative breast cancer from anti-tumor activity of NK cells.iScience. 2021 Oct 29;24(11):103348. doi: 10.1016/j.isci.2021.103348. eCollection 2021 Nov 19. iScience. 2021. PMID: 34816102 Free PMC article.
-
CD95/Fas Increases Stemness in Cancer Cells by Inducing a STAT1-Dependent Type I Interferon Response.Cell Rep. 2017 Mar 7;18(10):2373-2386. doi: 10.1016/j.celrep.2017.02.037. Cell Rep. 2017. PMID: 28273453 Free PMC article.
References
-
- Schepers AG, Snippert HJ, Stange DE, van den Born M, van Es JH, van de Wetering M et al. Lineage tracing reveals Lgr5+ stem cell activity in mouse intestinal adenomas. Science 2012; 337: 730–735. - PubMed
MeSH terms
Substances
LinkOut - more resources
Full Text Sources
Other Literature Sources
Medical
Research Materials

