RNA-Seq reveals common and unique PXR- and CAR-target gene signatures in the mouse liver transcriptome
- PMID: 27113289
- PMCID: PMC5552365
- DOI: 10.1016/j.bbagrm.2016.04.010
RNA-Seq reveals common and unique PXR- and CAR-target gene signatures in the mouse liver transcriptome
Abstract
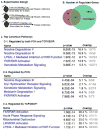
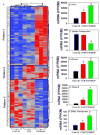
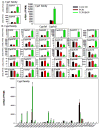
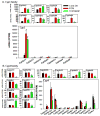
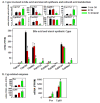
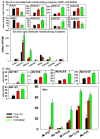
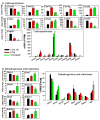
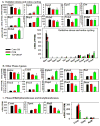
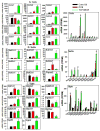
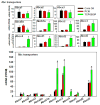
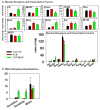
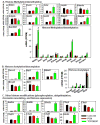
The pregnane X receptor (PXR) and constitutive androstane receptor (CAR) are well-known xenobiotic-sensing nuclear receptors with overlapping functions. However, there lacks a quantitative characterization to distinguish between the PXR and CAR target genes and signaling pathways in the liver. The present study performed a transcriptomic comparison of the PXR- and CAR-targets using RNA-Seq in livers of adult wild-type mice that were treated with the prototypical PXR ligand PCN (200mg/kg, i.p. once daily for 4days in corn oil) or the prototypical CAR ligand TCPOBOP (3mg/kg, i.p., once daily for 4days in corn oil). At the given doses, TCPOBOP differentially regulated many more genes (2125) than PCN (212), and 147 of the same genes were differentially regulated by both chemicals. As expected, the top pathways differentially regulated by both PCN and TCPOBOP were involved in xenobiotic metabolism, and they also up-regulated genes involved in retinoid metabolism, but down-regulated genes involved in inflammation and iron homeostasis. Regarding unique pathways, PXR activation appeared to overlap with the aryl hydrocarbon receptor signaling, whereas CAR activation appeared to overlap with the farnesoid X receptor signaling, acute-phase response, and mitochondrial dysfunction. The mRNAs of differentially regulated drug-processing genes (DPGs) partitioned into three patterns, namely TCPOBOP-induced, PCN-induced, as well as TCPOBOP-suppressed gene clusters. The cumulative mRNAs of the differentially regulated DPGs, phase-I and -II enzymes, as well as efflux transporters were all up-regulated by both PCN and TCPOBOPOP, whereas the cumulative mRNAs of the uptake transporters were down-regulated only by TCPOBOP. The absolute mRNA abundance in control and receptor-activated conditions was examined in each DPG category to predict the contribution of specific DPG genes in the PXR/CAR-mediated pharmacokinetic responses. The preferable differential regulation by TCPOBOP in the entire hepatic transcriptome correlated with a marked change in the expression of many DNA and histone epigenetic modifiers. In conclusion, the present study has revealed known and novel, as well as common and unique targets of PXR and CAR in mouse liver following pharmacological activation using their prototypical ligands. Results from this study will further support the role of these receptors in regulating the homeostasis of xenobiotic and intermediary metabolism in the liver, and aid in distinguishing between PXR and CAR signaling at various physiological and pathophysiological conditions. This article is part of a Special Issue entitled: Xenobiotic nuclear receptors: New Tricks for An Old Dog, edited by Dr. Wen Xie.
Copyright © 2016 Elsevier B.V. All rights reserved.
Figures

Similar articles
-
Editor's Highlight: Neonatal Activation of the Xenobiotic-Sensors PXR and CAR Results in Acute and Persistent Down-regulation of PPARα-Signaling in Mouse Liver.Toxicol Sci. 2016 Oct;153(2):282-302. doi: 10.1093/toxsci/kfw127. Epub 2016 Jul 13. Toxicol Sci. 2016. PMID: 27413110 Free PMC article.
-
Age-Specific Regulation of Drug-Processing Genes in Mouse Liver by Ligands of Xenobiotic-Sensing Transcription Factors.Drug Metab Dispos. 2016 Jul;44(7):1038-49. doi: 10.1124/dmd.115.066639. Epub 2015 Nov 17. Drug Metab Dispos. 2016. PMID: 26577535 Free PMC article.
-
Bioinformatic analysis of microRNA networks following the activation of the constitutive androstane receptor (CAR) in mouse liver.Biochim Biophys Acta. 2016 Sep;1859(9):1228-1237. doi: 10.1016/j.bbagrm.2016.04.002. Epub 2016 Apr 11. Biochim Biophys Acta. 2016. PMID: 27080131 Free PMC article.
-
Mechanisms of xenobiotic receptor activation: Direct vs. indirect.Biochim Biophys Acta. 2016 Sep;1859(9):1130-1140. doi: 10.1016/j.bbagrm.2016.02.006. Epub 2016 Feb 10. Biochim Biophys Acta. 2016. PMID: 26877237 Free PMC article. Review.
-
PXR- and CAR-mediated herbal effect on human diseases.Biochim Biophys Acta. 2016 Sep;1859(9):1121-1129. doi: 10.1016/j.bbagrm.2016.02.009. Epub 2016 Feb 22. Biochim Biophys Acta. 2016. PMID: 26906544 Review.
Cited by
-
Gut microbiota-derived metabolite 3-idoleacetic acid together with LPS induces IL-35+ B cell generation.Microbiome. 2022 Jan 24;10(1):13. doi: 10.1186/s40168-021-01205-8. Microbiome. 2022. PMID: 35074011 Free PMC article.
-
Perfluorinated Carboxylic Acids with Increasing Carbon Chain Lengths Upregulate Amino Acid Transporters and Modulate Compensatory Response of Xenobiotic Transporters in HepaRG Cells.Drug Metab Dispos. 2022 Oct;50(10):1396-1413. doi: 10.1124/dmd.121.000477. Epub 2021 Dec 2. Drug Metab Dispos. 2022. PMID: 34857530 Free PMC article.
-
Impact of CAR Agonist Ligand TCPOBOP on Mouse Liver Chromatin Accessibility.Toxicol Sci. 2018 Jul 1;164(1):115-128. doi: 10.1093/toxsci/kfy070. Toxicol Sci. 2018. PMID: 29617930 Free PMC article.
-
Molecular targets of PXR-dependent ethanol-induced hepatotoxicity in female mice.Biochem Pharmacol. 2024 Oct;228:116416. doi: 10.1016/j.bcp.2024.116416. Epub 2024 Jul 8. Biochem Pharmacol. 2024. PMID: 38986717
-
Effects of Overexpression of Fibroblast Growth Factor 15/19 on Hepatic Drug Metabolizing Enzymes.Drug Metab Dispos. 2022 Apr;50(4):468-477. doi: 10.1124/dmd.121.000416. Epub 2021 Dec 29. Drug Metab Dispos. 2022. PMID: 34965924 Free PMC article.
References
-
- Ahmad G, Sial GZ, Ramadori P, Dudas J, Batusic DS, Ramadori G. Changes of hepatic lactoferrin gene expression in two mouse models of the acute phase reaction. Int J Biochem Cell Biol. 2011;43:1822–1832. - PubMed
-
- Alnouti Y, Klaassen CD. Regulation of sulfotransferase enzymes by prototypical microsomal enzyme inducers in mice. J Pharmacol Exp Ther. 2008a;324:612–621. - PubMed
-
- Alnouti Y, Klaassen CD. Tissue distribution, ontogeny, and regulation of aldehyde dehydrogenase (Aldh) enzymes mRNA by prototypical microsomal enzyme inducers in mice. Toxicol Sci. 2008b;101:51–64. - PubMed
MeSH terms
Substances
Grants and funding
LinkOut - more resources
Full Text Sources
Other Literature Sources
Molecular Biology Databases
Research Materials

