mTORC2 mediates CXCL12-induced angiogenesis
- PMID: 27106789
- PMCID: PMC4959910
- DOI: 10.1007/s10456-016-9509-6
mTORC2 mediates CXCL12-induced angiogenesis
Abstract
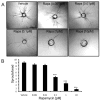
The chemokine CXCL12, through its receptor CXCR4, positively regulates angiogenesis by promoting endothelial cell (EC) migration and tube formation. However, the relevant downstream signaling pathways in EC have not been defined. Similarly, the upstream activators of mTORC2 signaling in EC are also poorly defined. Here, we demonstrate for the first time that CXCL12 regulation of angiogenesis requires mTORC2 but not mTORC1. We find that CXCR4 signaling activates mTORC2 as indicated by phosphorylation of serine 473 on Akt and does so through a G-protein- and PI3K-dependent pathway. Significantly, independent disruption of the mTOR complexes by drugs or multiple independent siRNAs reveals that mTORC2, but not mTORC1, is required for microvascular sprouting in a 3D in vitro angiogenesis model. Importantly, in a mouse model, both tumor angiogenesis and tumor volume are significantly reduced only when mTORC2 is inhibited. Finally, 6-phosphofructo-2-kinase/fructose-2,6-bisphosphatase 3 (PFKFB3), which is a key regulator of glycolytic flux, is required for microvascular sprouting in vitro, and its expression is reduced in vivo when mTORC2 is targeted. Taken together, these findings identify mTORC2 as a critical signaling nexus downstream of CXCL12/CXCR4 that represents a potential link between mTORC2, metabolic regulation, and angiogenesis.
Keywords: Akt; Angiogenesis; CXCL12; CXCR4; mTOR; mTORC2.
Figures


Similar articles
-
Endothelial Cell mTOR Complex-2 Regulates Sprouting Angiogenesis.PLoS One. 2015 Aug 21;10(8):e0135245. doi: 10.1371/journal.pone.0135245. eCollection 2015. PLoS One. 2015. PMID: 26295809 Free PMC article.
-
Regulation of endothelial cell proliferation and vascular assembly through distinct mTORC2 signaling pathways.Mol Cell Biol. 2015 Apr;35(7):1299-313. doi: 10.1128/MCB.00306-14. Epub 2015 Jan 12. Mol Cell Biol. 2015. PMID: 25582201 Free PMC article.
-
Knockdown of CXCR4 Inhibits CXCL12-Induced Angiogenesis in HUVECs through Downregulation of the MAPK/ERK and PI3K/AKT and the Wnt/β-Catenin Pathways.Cancer Invest. 2018 Jan 2;36(1):10-18. doi: 10.1080/07357907.2017.1422512. Epub 2018 Jan 30. Cancer Invest. 2018. PMID: 29381400
-
RES-529: a PI3K/AKT/mTOR pathway inhibitor that dissociates the mTORC1 and mTORC2 complexes.Anticancer Drugs. 2016 Jul;27(6):475-87. doi: 10.1097/CAD.0000000000000354. Anticancer Drugs. 2016. PMID: 26918392 Free PMC article. Review.
-
The roles of chemokine CXCL12 in embryonic and brain tumor angiogenesis.Semin Cancer Biol. 2009 Apr;19(2):111-5. doi: 10.1016/j.semcancer.2008.11.001. Epub 2008 Nov 7. Semin Cancer Biol. 2009. PMID: 19038344 Review.
Cited by
-
The expression and biological function of chemokine CXCL12 and receptor CXCR4/CXCR7 in placenta accreta spectrum disorders.J Cell Mol Med. 2020 Mar;24(5):3167-3182. doi: 10.1111/jcmm.14990. Epub 2020 Jan 28. J Cell Mol Med. 2020. PMID: 31991051 Free PMC article.
-
Plumbagin Restrains Hepatocellular Carcinoma Angiogenesis by Stromal Cell-Derived Factor (SDF-1)/CXCR4-CXCR7 Axis.Med Sci Monit. 2019 Aug 15;25:6110-6119. doi: 10.12659/MSM.915782. Med Sci Monit. 2019. PMID: 31415486 Free PMC article.
-
Effect of Stromal Cells in Tumor Microenvironment on Metastasis Initiation.Int J Biol Sci. 2018 Nov 13;14(14):2083-2093. doi: 10.7150/ijbs.25720. eCollection 2018. Int J Biol Sci. 2018. PMID: 30585271 Free PMC article. Review.
-
TMAO-Activated Hepatocyte-Derived Exosomes Impair Angiogenesis via Repressing CXCR4.Front Cell Dev Biol. 2022 Jan 31;9:804049. doi: 10.3389/fcell.2021.804049. eCollection 2021. Front Cell Dev Biol. 2022. PMID: 35174166 Free PMC article.
-
Regulation of mTORC2 Signaling.Genes (Basel). 2020 Sep 4;11(9):1045. doi: 10.3390/genes11091045. Genes (Basel). 2020. PMID: 32899613 Free PMC article. Review.
References
-
- Newman AC, Chou W, Welch-Reardon KM, Fong AH, Popson SA, Phan DT, Sandoval DR, Nguyen DP, Gershon PD, Hughes CC. Analysis of stromal cell secretomes reveals a critical role for stromal cell-derived hepatocyte growth factor and fibronectin in angiogenesis. Arterioscler Thromb Vasc Biol. 2013;33(3):513–522. doi: 10.1161/ATVBAHA.112.300782. ATVBAHA.112.300782 [pii] - DOI - PMC - PubMed
Publication types
MeSH terms
Substances
Grants and funding
LinkOut - more resources
Full Text Sources
Other Literature Sources
Molecular Biology Databases
Miscellaneous

