

EGFR inhibitors identified as a potential treatment for chordoma in a focused compound screen
- PMID: 27102572
- PMCID: PMC4922416
- DOI: 10.1002/path.4729
EGFR inhibitors identified as a potential treatment for chordoma in a focused compound screen
Abstract
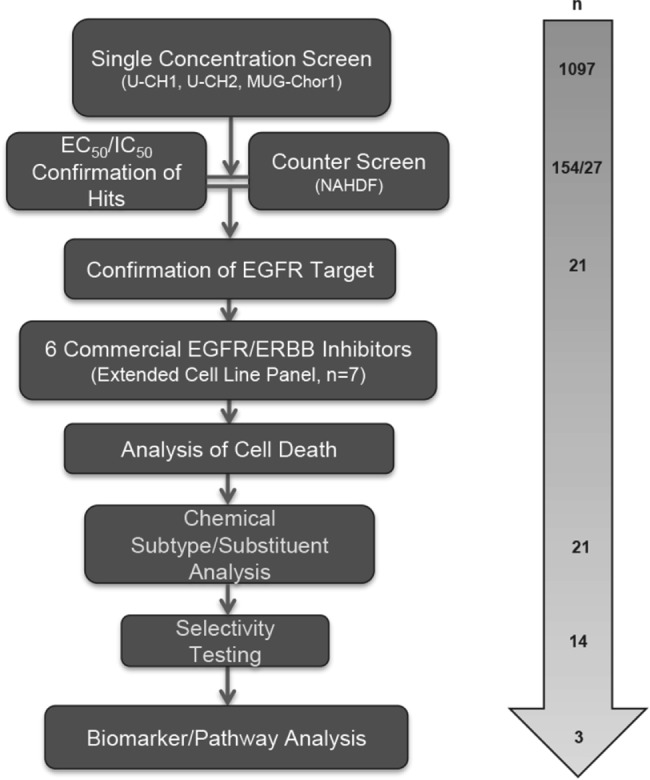
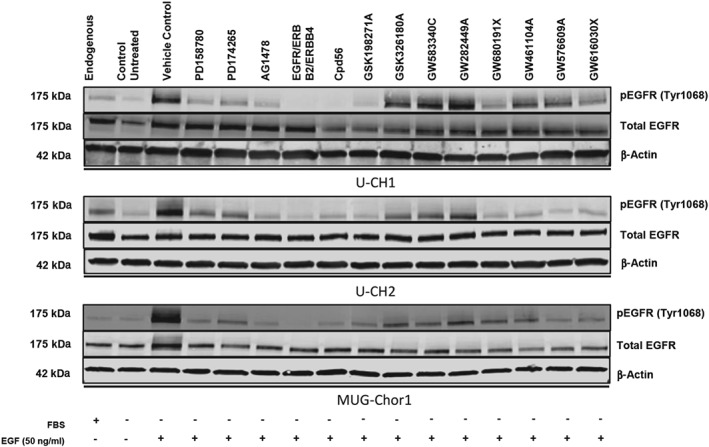
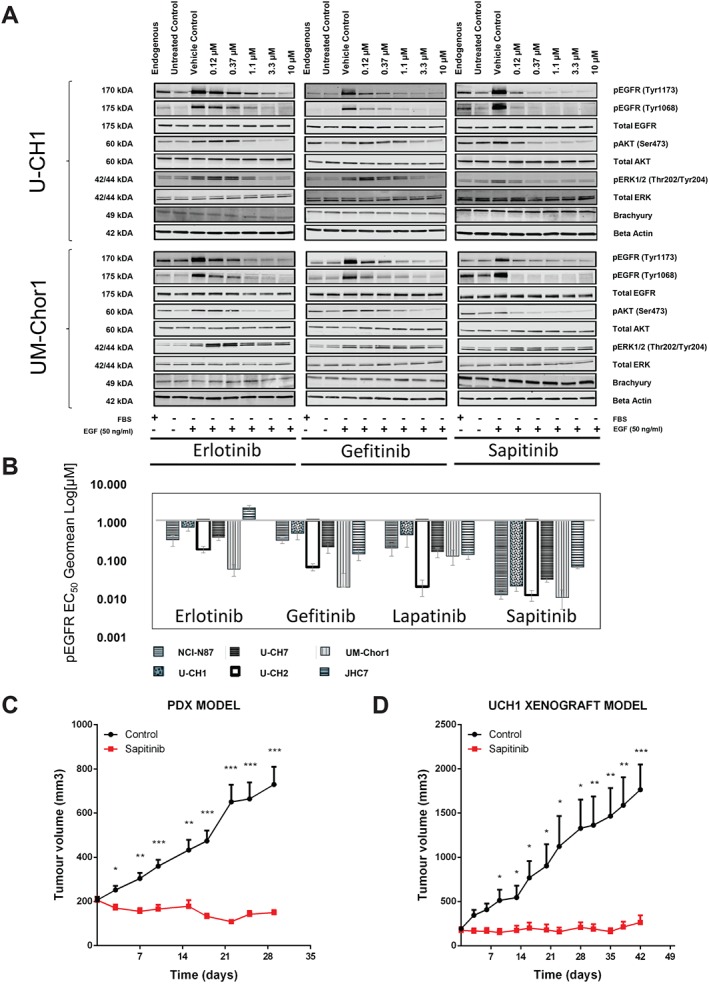
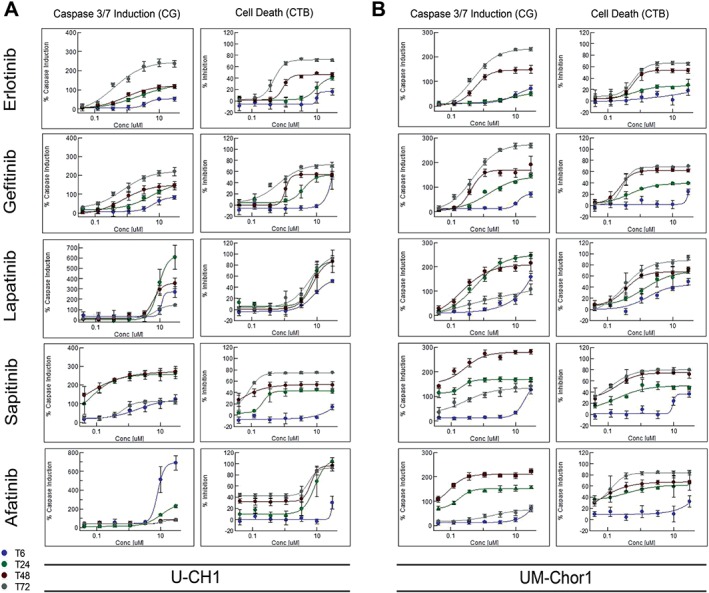
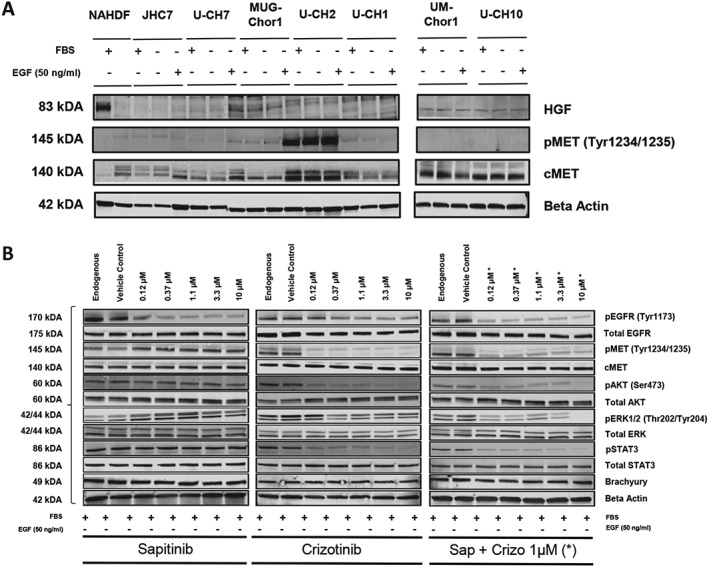
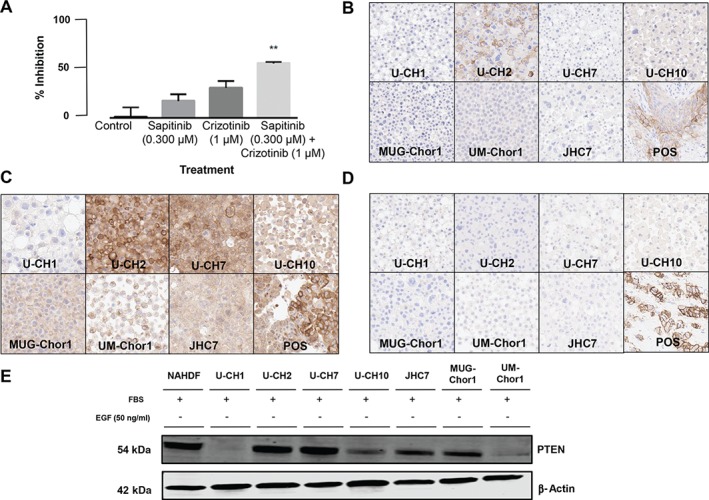
Chordoma is a rare malignant bone tumour with a poor prognosis and limited therapeutic options. We undertook a focused compound screen (FCS) against 1097 compounds on three well-characterized chordoma cell lines; 154 compounds were selected from the single concentration screen (1 µm), based on their growth-inhibitory effect. Their half-maximal effective concentration (EC50 ) values were determined in chordoma cells and normal fibroblasts. Twenty-seven of these compounds displayed chordoma selective cell kill and 21/27 (78%) were found to be EGFR/ERBB family inhibitors. EGFR inhibitors in clinical development were then studied on an extended cell line panel of seven chordoma cell lines, four of which were sensitive to EGFR inhibition. Sapitinib (AstraZeneca) emerged as the lead compound, followed by gefitinib (AstraZeneca) and erlotinib (Roche/Genentech). The compounds were shown to induce apoptosis in the sensitive cell lines and suppressed phospho-EGFR and its downstream pathways in a dose-dependent manner. Analysis of substituent patterns suggested that EGFR-inhibitors with small aniline substituents in the 4-position of the quinazoline ring were more effective than inhibitors with large substituents in that position. Sapitinib showed significantly reduced tumour growth in two xenograft mouse models (U-CH1 xenograft and a patient-derived xenograft, SF8894). One of the resistant cell lines (U-CH2) was shown to express high levels of phospho-MET, a known bypass signalling pathway to EGFR. Neither amplifications (EGFR, ERBB2, MET) nor mutations in EGFR, ERBB2, ERBB4, PIK3CA, BRAF, NRAS, KRAS, PTEN, MET or other cancer gene hotspots were detected in the cell lines. Our findings are consistent with the reported (p-)EGFR expression in the majority of clinical samples, and provide evidence for exploring the efficacy of EGFR inhibitors in the treatment of patients with chordoma and studying possible resistance mechanisms to these compounds in vitro and in vivo. © 2016 The Authors. The Journal of Pathology published by John Wiley & Sons Ltd on behalf of Pathological Society of Great Britain and Ireland.
Keywords: AZD8931; EGFR; ERBB family; chordoma; drug screen; resistance.
© 2016 The Authors. The Journal of Pathology published by John Wiley & Sons Ltd on behalf of Pathological Society of Great Britain and Ireland.
Figures
Comment in
-
A focused compound screen highlights the significance of epidermal growth factor receptor signalling in chordoma pathogenesis.J Pathol. 2016 Dec;240(4):381-383. doi: 10.1002/path.4780. Epub 2016 Oct 19. J Pathol. 2016. PMID: 27538356
Similar articles
-
AZD8055 enhances in vivo efficacy of afatinib in chordomas.J Pathol. 2021 Sep;255(1):72-83. doi: 10.1002/path.5739. Epub 2021 Jul 28. J Pathol. 2021. PMID: 34124783 Free PMC article.
-
SKLB1206, a novel orally available multikinase inhibitor targeting EGFR activating and T790M mutants, ErbB2, ErbB4, and VEGFR2, displays potent antitumor activity both in vitro and in vivo.Mol Cancer Ther. 2012 Apr;11(4):952-62. doi: 10.1158/1535-7163.MCT-11-0679. Epub 2012 Feb 8. Mol Cancer Ther. 2012. PMID: 22319204
-
Erlotinib inhibits growth of a patient-derived chordoma xenograft.PLoS One. 2013 Nov 15;8(11):e78895. doi: 10.1371/journal.pone.0078895. eCollection 2013. PLoS One. 2013. PMID: 24260133 Free PMC article.
-
A focused compound screen highlights the significance of epidermal growth factor receptor signalling in chordoma pathogenesis.J Pathol. 2016 Dec;240(4):381-383. doi: 10.1002/path.4780. Epub 2016 Oct 19. J Pathol. 2016. PMID: 27538356
-
Quinazoline Derivatives as Potential Therapeutic Agents in Urinary Bladder Cancer Therapy.Front Chem. 2021 Nov 3;9:765552. doi: 10.3389/fchem.2021.765552. eCollection 2021. Front Chem. 2021. PMID: 34805097 Free PMC article. Review.
Cited by
-
Optimizing CRISPR/Cas9 Editing of Repetitive Single Nucleotide Variants.Front Genome Ed. 2022 Jul 5;4:932434. doi: 10.3389/fgeed.2022.932434. eCollection 2022. Front Genome Ed. 2022. PMID: 35865001 Free PMC article.
-
Solamargine inhibits proliferation and promotes apoptosis of CM-319 human chordoma cells through suppression of notch pathway.Transl Cancer Res. 2019 Apr;8(2):509-519. doi: 10.21037/tcr.2019.03.07. Transl Cancer Res. 2019. PMID: 35116783 Free PMC article.
-
A potential therapy for chordoma via antibody-dependent cell-mediated cytotoxicity employing NK or high-affinity NK cells in combination with cetuximab.J Neurosurg. 2018 May;128(5):1419-1427. doi: 10.3171/2017.1.JNS162610. Epub 2017 Jul 28. J Neurosurg. 2018. PMID: 28753113 Free PMC article.
-
Y-box binding protein-1 promotes tumorigenesis and progression via the epidermal growth factor receptor/AKT pathway in spinal chordoma.Cancer Sci. 2019 Jan;110(1):166-179. doi: 10.1111/cas.13875. Epub 2018 Dec 19. Cancer Sci. 2019. PMID: 30426615 Free PMC article.
-
Synergistic drug combinations and machine learning for drug repurposing in chordoma.Sci Rep. 2020 Jul 31;10(1):12982. doi: 10.1038/s41598-020-70026-w. Sci Rep. 2020. PMID: 32737414 Free PMC article.
References
-
- Flanagan A, Yamaguchi T. Chordoma In World Health Organization Classification of Tumours of Soft Tissue and Bone, 4th edn, Fletcher C, Bridge J, Hogendoorn P, Mertens F. (eds). IARC Press: Lyon, 2013: 328–329.
-
- Walcott BP, Nahed BV, Mohyeldin A, et al. Chordoma: current concepts, management, and future directions. Lancet Oncol 2012; 13: e69–76. - PubMed
-
- Stacchiotti S, Sommer J. Building a global consensus approach to chordoma: a position paper from the medical and patient community. Lancet Oncol 2015; 16: e71–83. - PubMed
-
- Tirabosco R, Mangham DC, Rosenberg AE, et al. Brachyury expression in extra‐axial skeletal and soft tissue chordomas: a marker that distinguishes chordoma from mixed tumor/myoepithelioma/parachordoma in soft tissue. Am J Surg Pathol 2008; 32: 572–580. - PubMed
-
- ESMO/European Sarcoma Network Working Group . Bone sarcomas: ESMO Clinical Practice Guidelines for diagnosis, treatment and follow‐up. Ann Oncol 2014; 25(suppl 3): iii, 113–123. - PubMed
MeSH terms
Substances
Grants and funding
LinkOut - more resources
Full Text Sources
Other Literature Sources
Research Materials
Miscellaneous
