Why small fluxes matter: the case and approaches for improving measurements of photosynthesis and (photo)respiration
- PMID: 27099373
- PMCID: PMC4867897
- DOI: 10.1093/jxb/erw139
Why small fluxes matter: the case and approaches for improving measurements of photosynthesis and (photo)respiration
Abstract
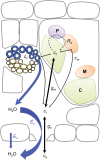
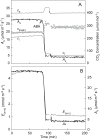
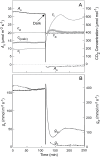
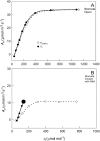
Since its inception, the Farquhar et al. (1980) model of photosynthesis has been a mainstay for relating biochemistry to environmental conditions from chloroplast to global levels in terrestrial plants. Many variables could be assigned from basic enzyme kinetics, but the model also required measurements of maximum rates of photosynthetic electron transport (J max ), carbon assimilation (Vcmax ), conductance of CO2 into (g s ) and through (g m ) the leaf, and the rate of respiration during the day (R d ). This review focuses on improving the accuracy of these measurements, especially fluxes from photorespiratory CO2, CO2 in the transpiration stream, and through the leaf epidermis and cuticle. These fluxes, though small, affect the accuracy of all methods of estimating mesophyll conductance and several other photosynthetic parameters because they all require knowledge of CO2 concentrations in the intercellular spaces. This review highlights modified methods that may help to reduce some of the uncertainties. The approaches are increasingly important when leaves are stressed or when fluxes are inferred at scales larger than the leaf.
Keywords: Diffusion; internal leaf CO2; mesophyll conductance; photosynthesis; respiration; stomatal conductance; xylem CO2..
© The Author 2016. Published by Oxford University Press on behalf of the Society for Experimental Biology. All rights reserved. For permissions, please email: journals.permissions@oup.com.
Figures


Comment in
-
Overlooked water loss in plants could throw off climate models.Nature. 2017 Jun 28;546(7660):585-586. doi: 10.1038/546585a. Nature. 2017. PMID: 28661503 No abstract available.
Similar articles
-
Role of mesophyll diffusion conductance in constraining potential photosynthetic productivity in the field.J Exp Bot. 2009;60(8):2249-70. doi: 10.1093/jxb/erp036. Epub 2009 Apr 23. J Exp Bot. 2009. PMID: 19395391 Review.
-
Leaf mesophyll conductance and leaf hydraulic conductance: an introduction to their measurement and coordination.J Exp Bot. 2013 Oct;64(13):3965-81. doi: 10.1093/jxb/ert319. J Exp Bot. 2013. PMID: 24123453 Review.
-
Major diffusion leaks of clamp-on leaf cuvettes still unaccounted: how erroneous are the estimates of Farquhar et al. model parameters?Plant Cell Environ. 2007 Aug;30(8):1006-22. doi: 10.1111/j.1365-3040.2007.001689.x. Plant Cell Environ. 2007. PMID: 17617828
-
A coupled model of photosynthesis, stomatal conductance and transpiration for a rose leaf (Rosa hybrida L.).Ann Bot. 2003 Jun;91(7):771-81. doi: 10.1093/aob/mcg080. Epub 2003 Mar 28. Ann Bot. 2003. PMID: 12730065 Free PMC article.
-
Mesophyll conductance: internal insights of leaf carbon exchange.Plant Cell Environ. 2013 Apr;36(4):733-5. doi: 10.1111/pce.12075. Plant Cell Environ. 2013. PMID: 23387473 No abstract available.
Cited by
-
Heterogeneity of Stomatal Pore Area Is Suppressed by Ambient Aerosol in the Homobaric Species, Vicia faba.Front Plant Sci. 2020 Jun 25;11:897. doi: 10.3389/fpls.2020.00897. eCollection 2020. Front Plant Sci. 2020. PMID: 32670326 Free PMC article.
-
Two-Source δ18O Method to Validate the CO18O-Photosynthetic Discrimination Model: Implications for Mesophyll Conductance.Plant Physiol. 2019 Nov;181(3):1175-1190. doi: 10.1104/pp.19.00633. Epub 2019 Sep 13. Plant Physiol. 2019. PMID: 31519787 Free PMC article.
-
Variable Mesophyll Conductance among Soybean Cultivars Sets a Tradeoff between Photosynthesis and Water-Use-Efficiency.Plant Physiol. 2017 May;174(1):241-257. doi: 10.1104/pp.16.01940. Epub 2017 Mar 7. Plant Physiol. 2017. PMID: 28270627 Free PMC article.
-
An improved theory for calculating leaf gas exchange more precisely accounting for small fluxes.Nat Plants. 2021 Mar;7(3):317-326. doi: 10.1038/s41477-021-00861-w. Epub 2021 Mar 1. Nat Plants. 2021. PMID: 33649595
-
Direct measurement of intercellular CO2 concentration in a gas-exchange system resolves overestimation using the standard method.J Exp Bot. 2018 Apr 9;69(8):1981-1991. doi: 10.1093/jxb/ery044. J Exp Bot. 2018. PMID: 29432576 Free PMC article.
References
-
- Allen CD, Macalady AK, Chenchouni H, et al. 2010. A global overview of drought and heat-induced tree mortality reveals emerging climate change risks for forests. Forest Ecology and Management 259, 660–684.
-
- Atkin OK, Bloomfield KJ, Reich PB, et al. 2015. Global variability in leaf respiration in relation to climate, plant functional types and leaf traits. The New Phytologist 206, 614–636. - PubMed
-
- Atkin OK, Evans JR, Ball MC, Siebke K, Pons TL, Lambers H, Moller IM, Gardestrom P, Gliminius K, Glaser E. 1998. Light inhibition of leaf respiration: the role of irradiance and temperature. In: Moller IM, Gardestrom P, Gliminus K, Glaser E, eds. Plant mitochondria: from gene to function . Leiden, the Netherlands: Bluckhuys Publishers, 25–32.
-
- Aubrey DP, Teskey RO. 2009. Root-derived CO2 efflux via xylem stream rivals soil CO2 efflux. The New Phytologist 184, 35–40. - PubMed
Publication types
MeSH terms
Substances
Grants and funding
LinkOut - more resources
Full Text Sources
Other Literature Sources

