Gene-expression profiles in lung adenocarcinomas related to chronic wood smoke or tobacco exposure
- PMID: 27098372
- PMCID: PMC4839084
- DOI: 10.1186/s12931-016-0346-3
Gene-expression profiles in lung adenocarcinomas related to chronic wood smoke or tobacco exposure
Abstract
Background: Tobacco-smoke is the major etiological factor related to lung cancer. However, other important factor is chronic wood smoke exposure (WSE). Approximately 30 % of lung cancer patients in Mexico have a history of WSE, and present different clinical, pathological and molecular characteristics compared to tobacco related lung cancer, including differences in mutational profiles. There are several molecular alterations identified in WSE associated lung cancer, however most studies have focused on the analysis of changes in several pathogenesis related proteins.
Methods: Our group evaluated gene expression profiles of primary lung adenocarcinoma, from patients with history of WSE or tobacco exposure. Differential expression between these two groups were studied through gene expression microarrays.
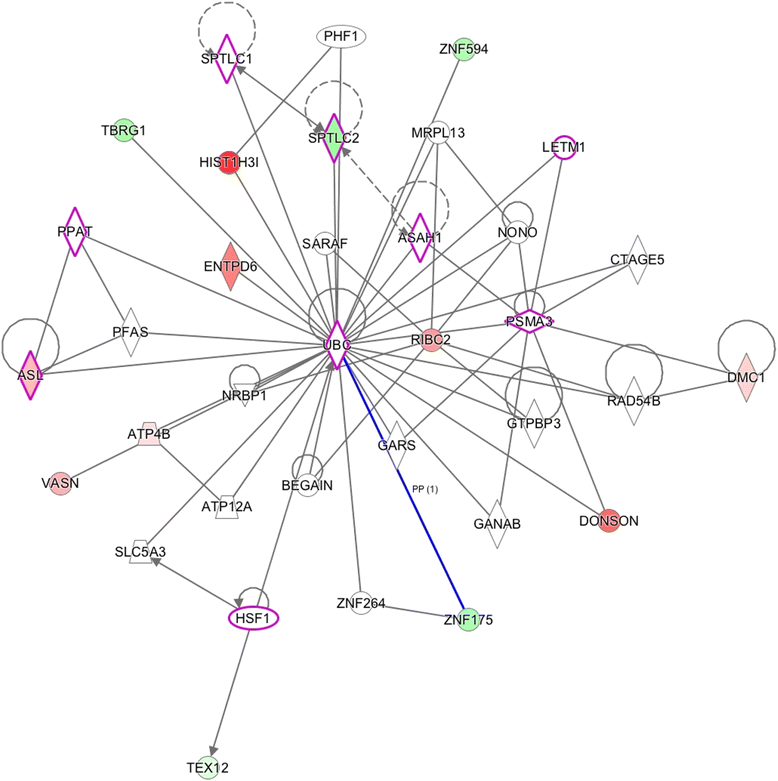
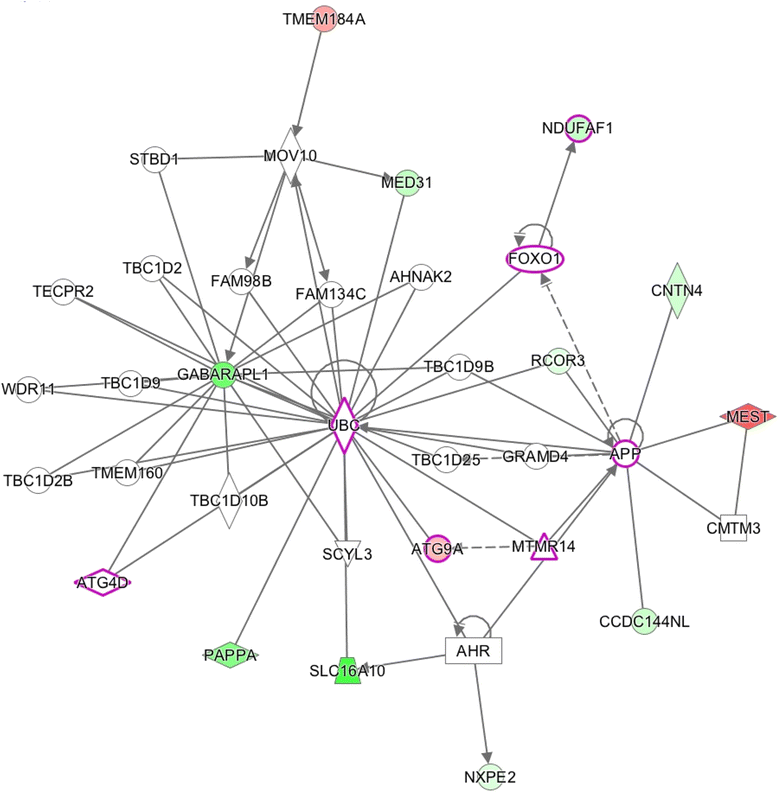
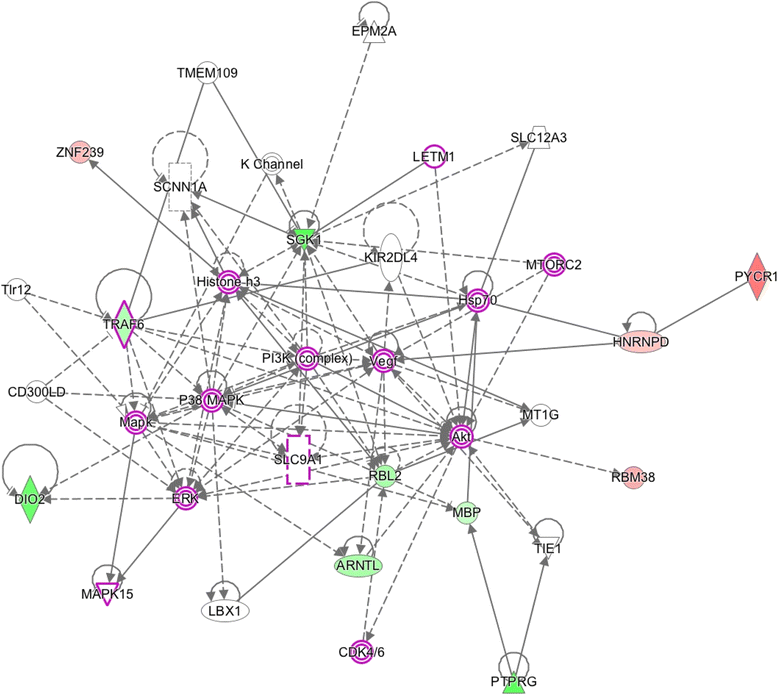
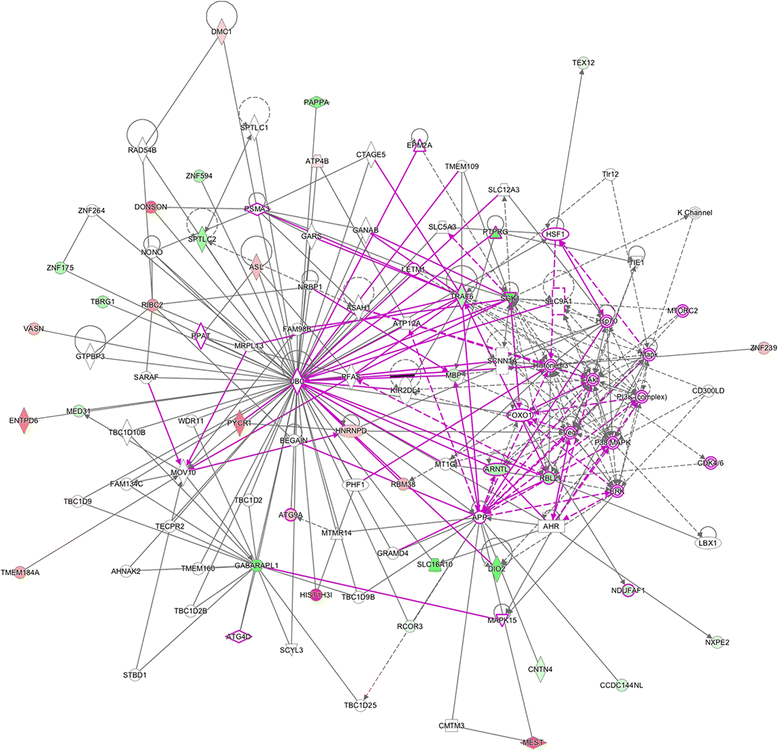
Results: Results of the gene expression profiling revealed 57 statistically significant genes (p < 0.01). The associated biological functional pathways included: lipid metabolism, biochemistry of small molecules, molecular transport, cell morphology, function and maintenance. A highlight of our analysis is that three of the main functional networks represent 37 differentially expressed genes out of the 57 found. These hubs are related with ubiquitin C, GABA(A) receptor-associated like protein; and the PI3K/AKT and MEK/ERK signaling pathways.
Conclusion: Our results reflect the intrinsic biology that sustains the development of adenocarcinoma related to WSE and show that there is a different gene expression profile of WSE associated lung adenocarcinoma compared to tobacco exposure, suggesting that they arise through different carcinogenic mechanisms, which may explain the clinical and mutation profile divergences between both lung adenocarcinomas.
Keywords: Gene expression profiles; Microarray analysis; Non-small cell lung carcinoma; Tobacco smoke; Wood smoke exposure.
Figures
 ), phosphatases (
 ), kinases (
 ), peptidases (
 ), G-protein coupled receptor (
 ), transmembrane receptor (
 ), cytokines (
 ), growth factor (
 ), ion channel (
 ), transporter (
 ), translation factor (
 ), nuclear receptor (
 ), transcription factor (
 ) and other (
 )
)
 ), phosphatases (
 ), kinases (
 ), peptidases (
 ), G-protein coupled receptor (
 ), transmembrane receptor (
 ), cytokines (
 ), growth factor (
 ), ion channel (
 ), transporter (
 ), translation factor (
 ), nuclear receptor (
 ), transcription factor (
 ) and other (
 )
)
 ), phosphatases (
 ), kinases (
 ), peptidases (
 ), G-protein coupled receptor (
 ), transmembrane receptor (
 ), cytokines (
 ), growth factor (
 ), ion channel (
 ), transporter (
 ), translation factor (
 ), nuclear receptor (
 ), transcription factor (
 ) and other (
 )
)
 ), kinases (
 ), peptidases (
 ), G-protein coupled receptor ( ), transmembrane receptor ( ), cytokines (
 ), growth factor (
 ), ion channel (
 ), transporter ( ), translation factor (
 ), nuclear receptor (
 ), transcription factor (
 ) and other (
 )
)Similar articles
-
Clinical and pathological characteristics, outcome and mutational profiles regarding non-small-cell lung cancer related to wood-smoke exposure.J Thorac Oncol. 2012 Aug;7(8):1228-34. doi: 10.1097/JTO.0b013e3182582a93. J Thorac Oncol. 2012. PMID: 22659961
-
Wood-smoke exposure as a response and survival predictor in erlotinib-treated non-small cell lung cancer patients: an open label phase II study.J Thorac Oncol. 2008 Aug;3(8):887-93. doi: 10.1097/JTO.0b013e31818026f6. J Thorac Oncol. 2008. PMID: 18670307 Clinical Trial.
-
Lung cancer pathogenesis associated with wood smoke exposure.Chest. 2005 Jul;128(1):124-31. doi: 10.1378/chest.128.1.124. Chest. 2005. PMID: 16002925
-
Lung cancer and passive smoking.Stat Methods Med Res. 1998 Jun;7(2):119-36. doi: 10.1177/096228029800700203. Stat Methods Med Res. 1998. PMID: 9654638 Review.
-
Lung cancer in never smokers: a review.J Clin Oncol. 2007 Feb 10;25(5):561-70. doi: 10.1200/JCO.2006.06.8015. J Clin Oncol. 2007. PMID: 17290066 Review.
Cited by
-
Development and validation of a novel fibroblast scoring model for lung adenocarcinoma.Front Oncol. 2022 Aug 22;12:905212. doi: 10.3389/fonc.2022.905212. eCollection 2022. Front Oncol. 2022. PMID: 36072807 Free PMC article.
-
Multi-omics Data Analyses Construct TME and Identify the Immune-Related Prognosis Signatures in Human LUAD.Mol Ther Nucleic Acids. 2020 Sep 4;21:860-873. doi: 10.1016/j.omtn.2020.07.024. Epub 2020 Jul 23. Mol Ther Nucleic Acids. 2020. PMID: 32805489 Free PMC article.
-
Cancer Epidemiology in the Northeastern United States (2013-2017).Cancer Res Commun. 2023 Aug 14;3(8):1538-1550. doi: 10.1158/2767-9764.CRC-23-0152. eCollection 2023 Aug. Cancer Res Commun. 2023. PMID: 37583435 Free PMC article.
-
Different lactate metabolism subtypes reveal heterogeneity in clinical outcomes and immunotherapy in lung adenocarcinoma patients.Heliyon. 2024 May 7;10(10):e30781. doi: 10.1016/j.heliyon.2024.e30781. eCollection 2024 May 30. Heliyon. 2024. PMID: 38779008 Free PMC article.
-
Association between CD47 expression, clinical characteristics and prognosis in patients with advanced non-small cell lung cancer.Cancer Med. 2020 Apr;9(7):2390-2402. doi: 10.1002/cam4.2882. Epub 2020 Feb 11. Cancer Med. 2020. PMID: 32043750 Free PMC article.
References
-
- IARC. Lung Cancer Estimated Incidence, Mortality and Prevalence. In: Cancer Fact Sheet. http://globocan.iarc.fr/Pages/fact_sheets_cancer.aspx. 2012. Accessed November 21 2015.
-
- Arrieta O, Guzman-de Alba E, Alba-Lopez LF, Acosta-Espinoza A, Alatorre-Alexander J, Alexander-Meza JF, et al. National consensus of diagnosis and treatment of non-small cell lung cancer. Rev Invest Clin. 2013;65 Suppl 1:S5–84. - PubMed
MeSH terms
Substances
LinkOut - more resources
Full Text Sources
Other Literature Sources
Medical
Miscellaneous

