

Normalizing the environment recapitulates adult human immune traits in laboratory mice
- PMID: 27096360
- PMCID: PMC4871315
- DOI: 10.1038/nature17655
Normalizing the environment recapitulates adult human immune traits in laboratory mice
Abstract
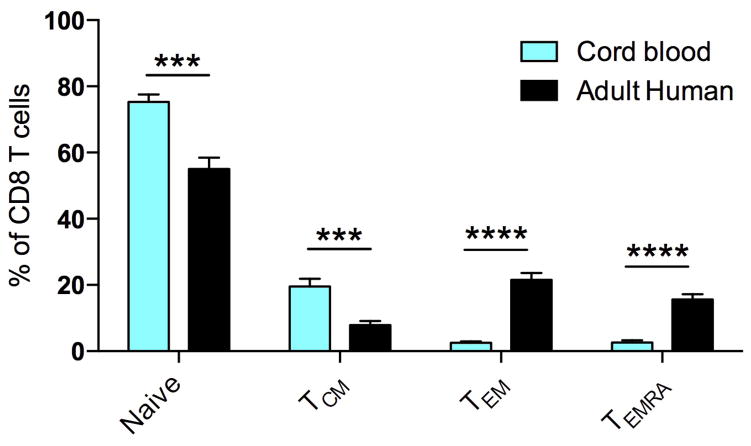
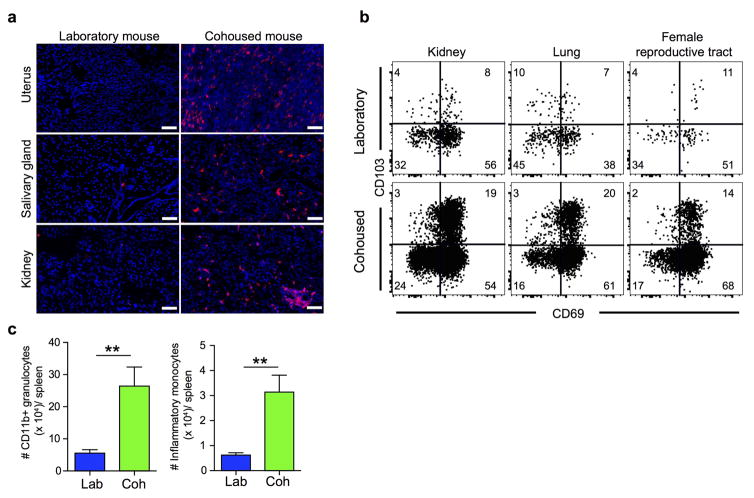
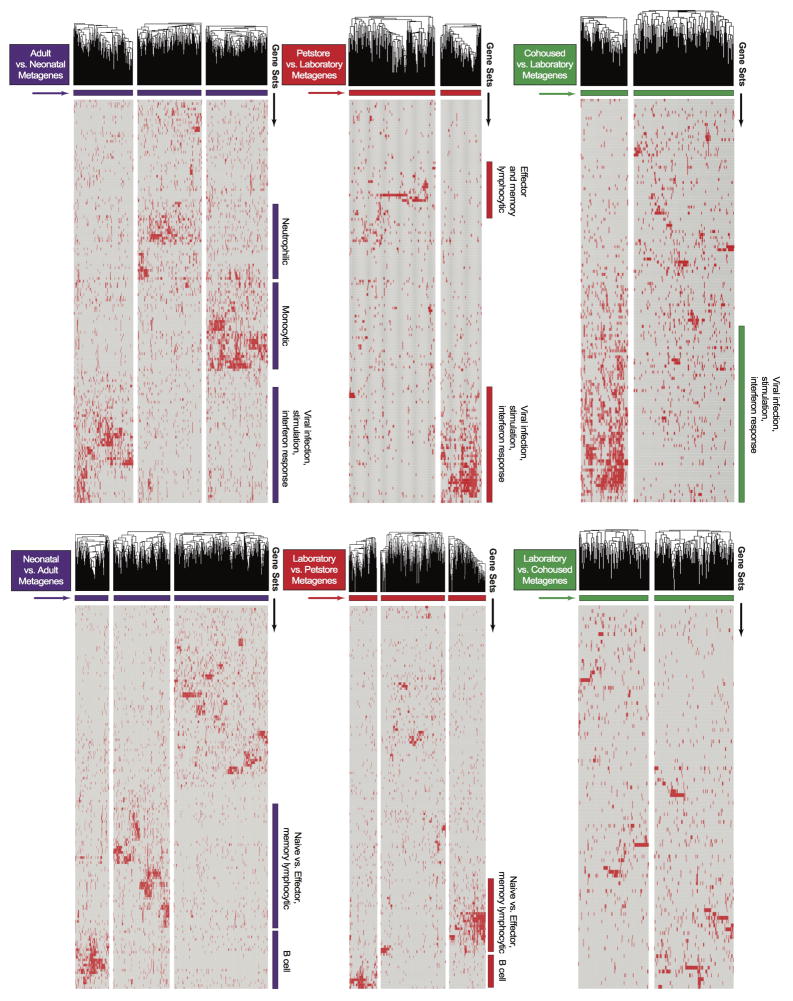
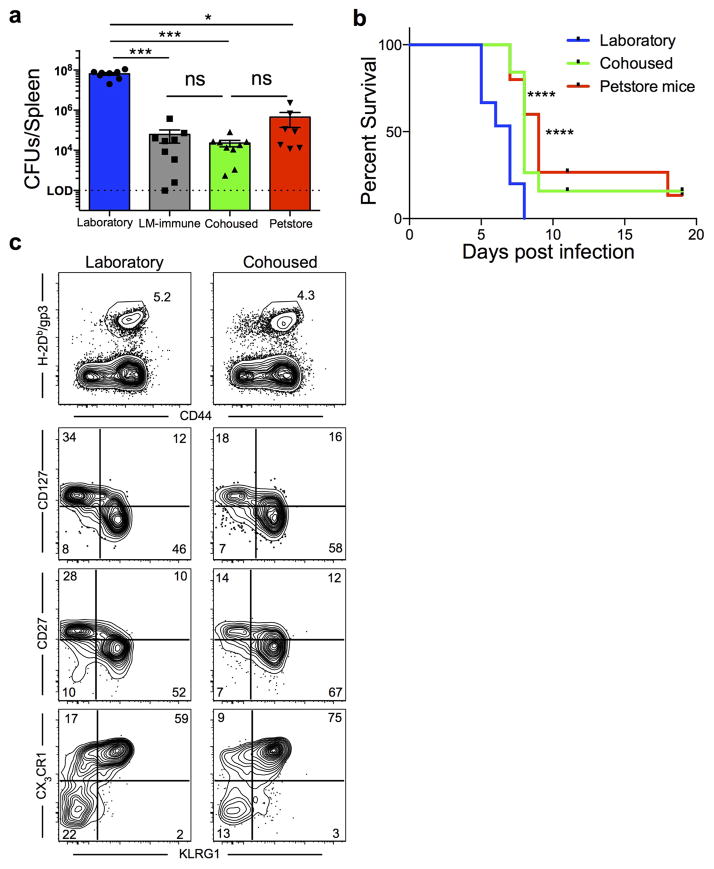
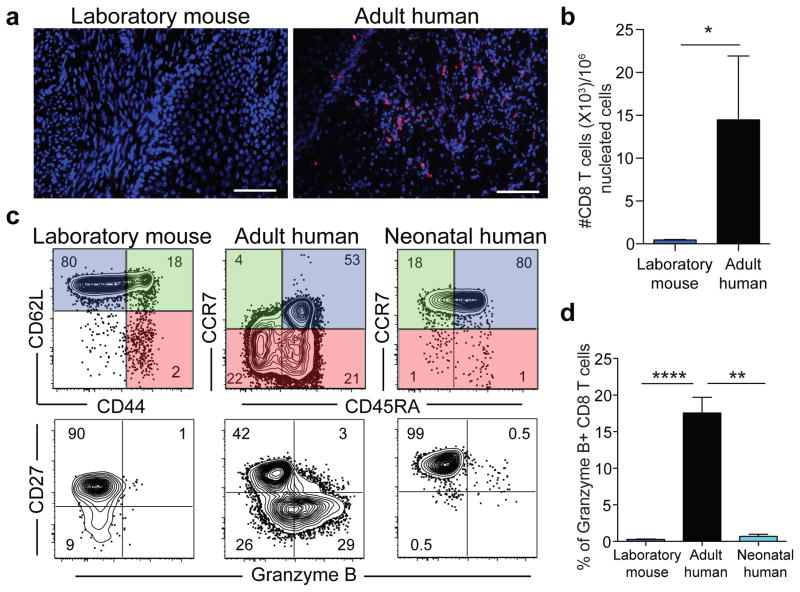
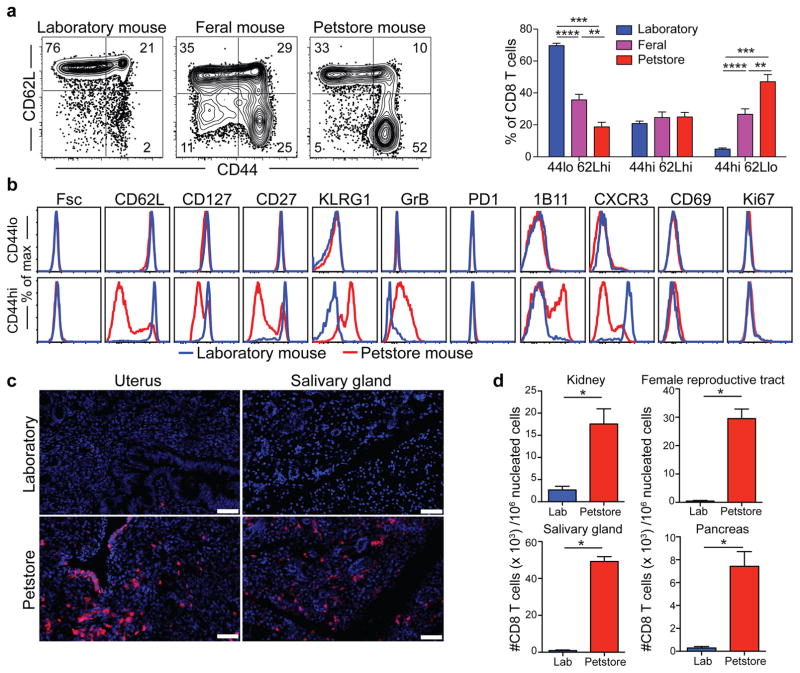
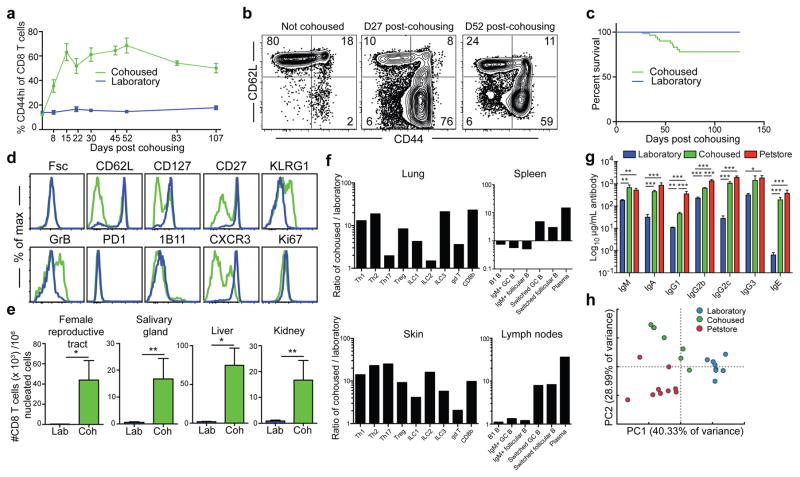
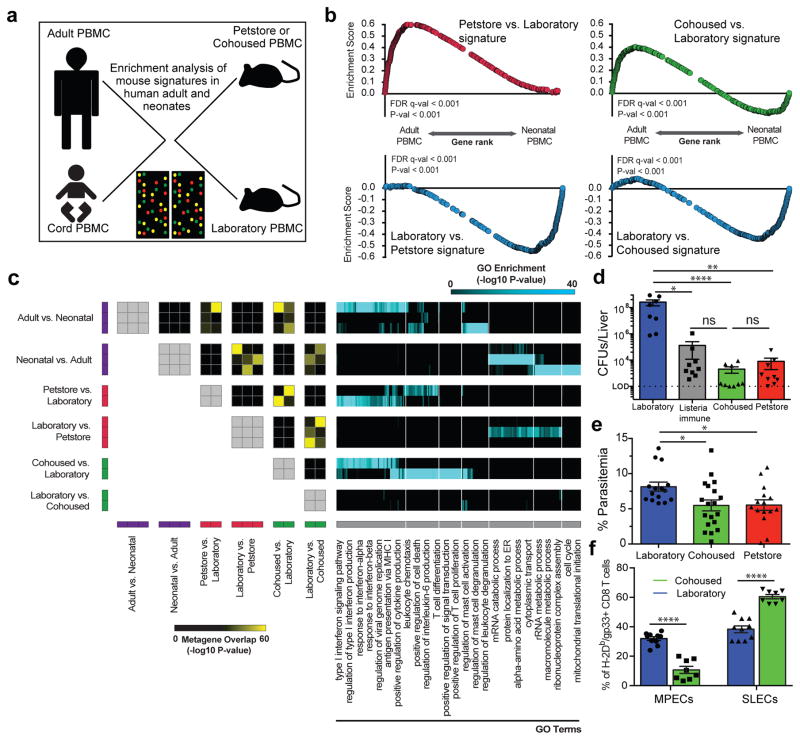
Our current understanding of immunology was largely defined in laboratory mice, partly because they are inbred and genetically homogeneous, can be genetically manipulated, allow kinetic tissue analyses to be carried out from the onset of disease, and permit the use of tractable disease models. Comparably reductionist experiments are neither technically nor ethically possible in humans. However, there is growing concern that laboratory mice do not reflect relevant aspects of the human immune system, which may account for failures to translate disease treatments from bench to bedside. Laboratory mice live in abnormally hygienic specific pathogen free (SPF) barrier facilities. Here we show that standard laboratory mouse husbandry has profound effects on the immune system and that environmental changes produce mice with immune systems closer to those of adult humans. Laboratory mice--like newborn, but not adult, humans--lack effector-differentiated and mucosally distributed memory T cells. These cell populations were present in free-living barn populations of feral mice and pet store mice with diverse microbial experience, and were induced in laboratory mice after co-housing with pet store mice, suggesting that the environment is involved in the induction of these cells. Altering the living conditions of mice profoundly affected the cellular composition of the innate and adaptive immune systems, resulted in global changes in blood cell gene expression to patterns that more closely reflected the immune signatures of adult humans rather than neonates, altered resistance to infection, and influenced T-cell differentiation in response to a de novo viral infection. These data highlight the effects of environment on the basal immune state and response to infection and suggest that restoring physiological microbial exposure in laboratory mice could provide a relevant tool for modelling immunological events in free-living organisms, including humans.
Conflict of interest statement
The authors declare no competing financial interests
Figures
Comment in
-
Infection: Go wild?Nat Rev Immunol. 2016 Jun;16(6):337. doi: 10.1038/nri.2016.57. Epub 2016 May 9. Nat Rev Immunol. 2016. PMID: 27157063 No abstract available.
-
Host response: Mice and humans in the bubble.Nat Microbiol. 2016 Jun 24;1(7):16105. doi: 10.1038/nmicrobiol.2016.105. Nat Microbiol. 2016. PMID: 27572983 No abstract available.
-
Getting Down and Dirty: Germ-Exposed Laboratory Mice as a Model of the Adult Human Immune System.Transplantation. 2016 Dec;100(12):2490-2491. doi: 10.1097/TP.0000000000001490. Transplantation. 2016. PMID: 27861276 Free PMC article. No abstract available.
Similar articles
-
Comparison of mouse models of microbial experience reveals differences in microbial diversity and response to vaccination.mSphere. 2024 Feb 28;9(2):e0065423. doi: 10.1128/msphere.00654-23. Epub 2024 Jan 29. mSphere. 2024. PMID: 38286428 Free PMC article.
-
Subclinical Cytomegalovirus Infection Is Associated with Altered Host Immunity, Gut Microbiota, and Vaccine Responses.J Virol. 2018 Jun 13;92(13):e00167-18. doi: 10.1128/JVI.00167-18. Print 2018 Jul 1. J Virol. 2018. PMID: 29669841 Free PMC article.
-
Squeaky clean mice could be ruining research.Nature. 2018 Apr 5;556(7699):16-18. doi: 10.1038/d41586-018-03916-9. Nature. 2018. PMID: 29620765 No abstract available.
-
Immune responses in neonates.Expert Rev Clin Immunol. 2014 Sep;10(9):1171-84. doi: 10.1586/1744666X.2014.942288. Epub 2014 Aug 4. Expert Rev Clin Immunol. 2014. PMID: 25088080 Free PMC article. Review.
-
Immune-surveillance through exhausted effector T-cells.Curr Opin Virol. 2016 Feb;16:49-54. doi: 10.1016/j.coviro.2016.01.002. Epub 2016 Jan 29. Curr Opin Virol. 2016. PMID: 26826950 Review.
Cited by
-
Long-term lymphoid progenitors independently sustain naïve T and NK cell production in humans.Nat Commun. 2021 Mar 12;12(1):1622. doi: 10.1038/s41467-021-21834-9. Nat Commun. 2021. PMID: 33712608 Free PMC article.
-
Inflammatory signals are sufficient to elicit TOX expression in mouse and human CD8+ T cells.JCI Insight. 2021 Jul 8;6(13):e150744. doi: 10.1172/jci.insight.150744. JCI Insight. 2021. PMID: 34032638 Free PMC article.
-
The Dynamic Entropy of Tumor Immune Infiltrates: The Impact of Recirculation, Antigen-Specific Interactions, and Retention on T Cells in Tumors.Front Oncol. 2021 Apr 22;11:653625. doi: 10.3389/fonc.2021.653625. eCollection 2021. Front Oncol. 2021. PMID: 33968757 Free PMC article. Review.
-
Building a healthy mouse model ecosystem to interrogate cancer biology.Dis Model Mech. 2022 Sep 1;15(9):dmm049795. doi: 10.1242/dmm.049795. Epub 2022 Sep 13. Dis Model Mech. 2022. PMID: 36098988 Free PMC article.
-
Senolytics reduce coronavirus-related mortality in old mice.Science. 2021 Jul 16;373(6552):eabe4832. doi: 10.1126/science.abe4832. Epub 2021 Jun 8. Science. 2021. PMID: 34103349 Free PMC article.
References
Publication types
MeSH terms
Grants and funding
- R37 AI084913/AI/NIAID NIH HHS/United States
- R01 AI084913/AI/NIAID NIH HHS/United States
- R01 AI075168/AI/NIAID NIH HHS/United States
- 1R01AI111671/AI/NIAID NIH HHS/United States
- UL1 TR000114/TR/NCATS NIH HHS/United States
- R01 AI111671/AI/NIAID NIH HHS/United States
- P01 AI035296/AI/NIAID NIH HHS/United States
- R01AI075168/AI/NIAID NIH HHS/United States
- R01AI116678/AI/NIAID NIH HHS/United States
- R01AI084913/AI/NIAID NIH HHS/United States
- R01 AI116678/AI/NIAID NIH HHS/United States
- T32 AI007313/AI/NIAID NIH HHS/United States
- P30 CA077598/CA/NCI NIH HHS/United States
LinkOut - more resources
Full Text Sources
Other Literature Sources
Medical
Molecular Biology Databases
