. 2016 Apr 15:5:e12917.
doi: 10.7554/eLife.12917.

Acute inhibition of neurosteroid estrogen synthesis suppresses status epilepticus in an animal model

Affiliations

Acute inhibition of neurosteroid estrogen synthesis suppresses status epilepticus in an animal model

Satoru M Sato et al. Elife. .

Erratum in

Abstract

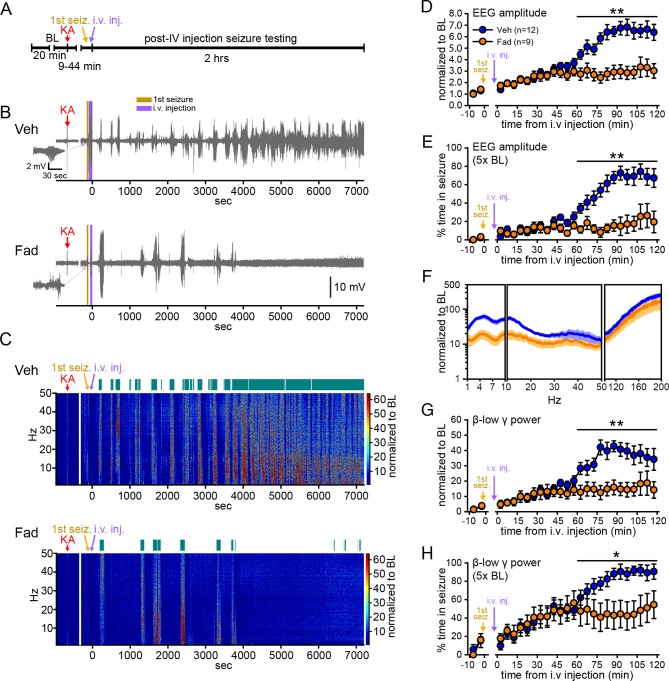
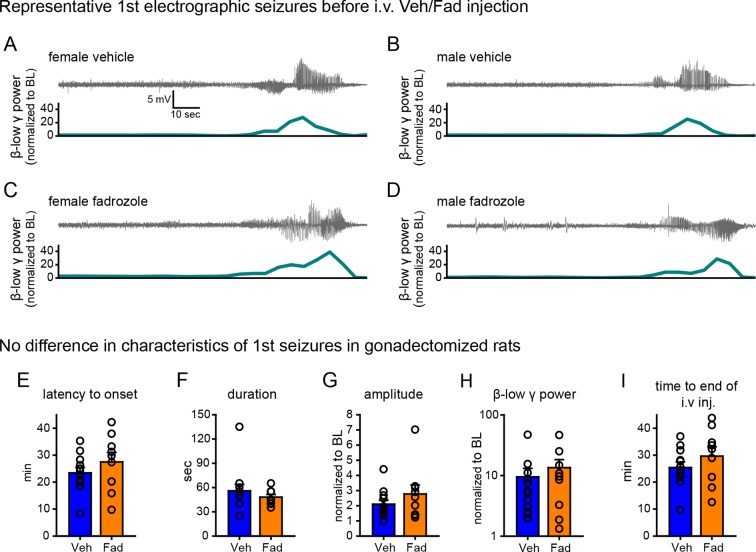
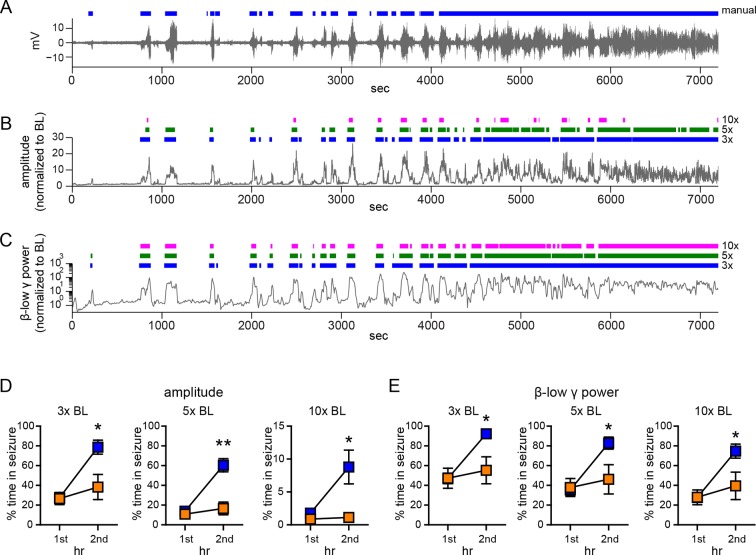
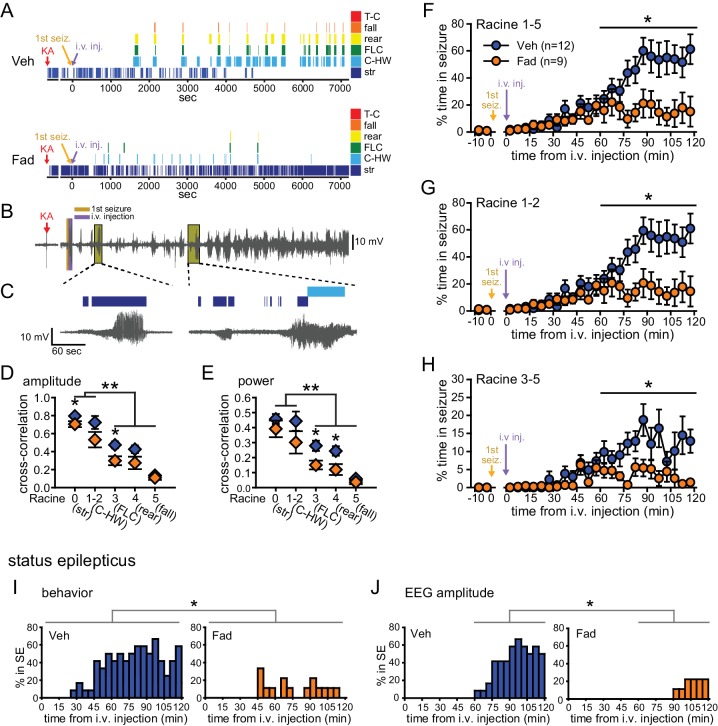
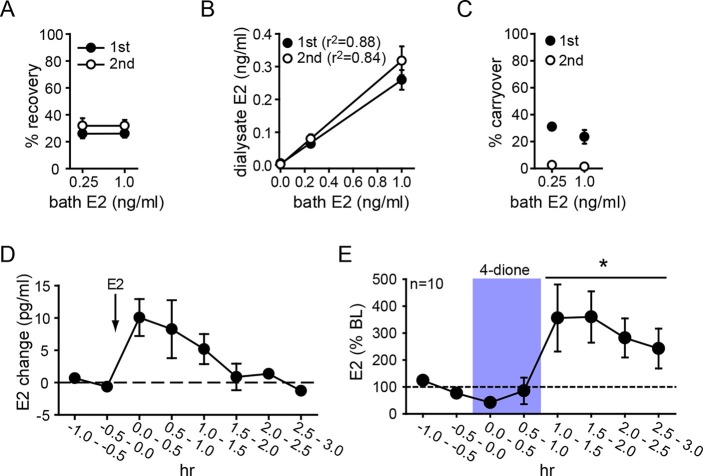
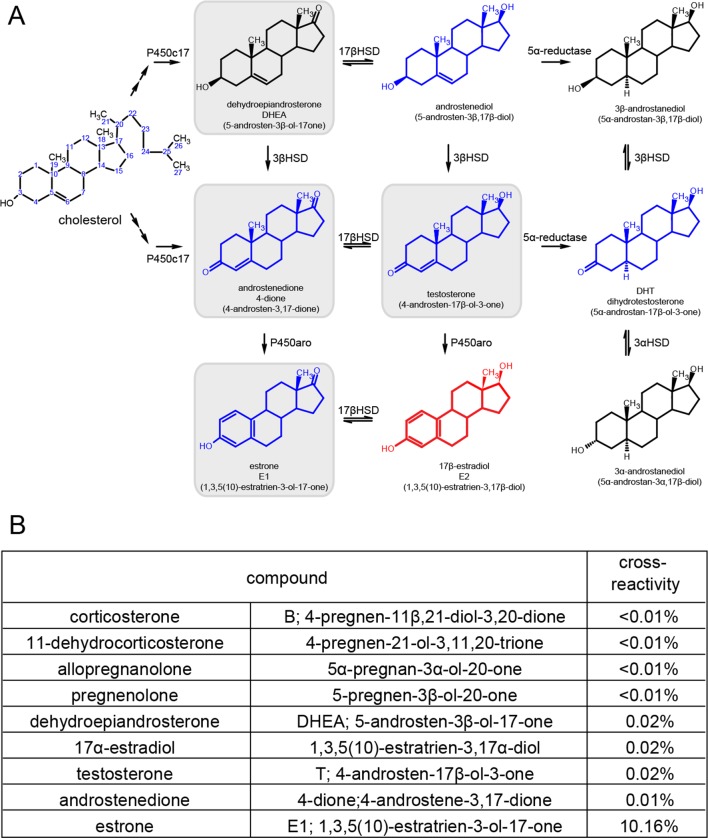
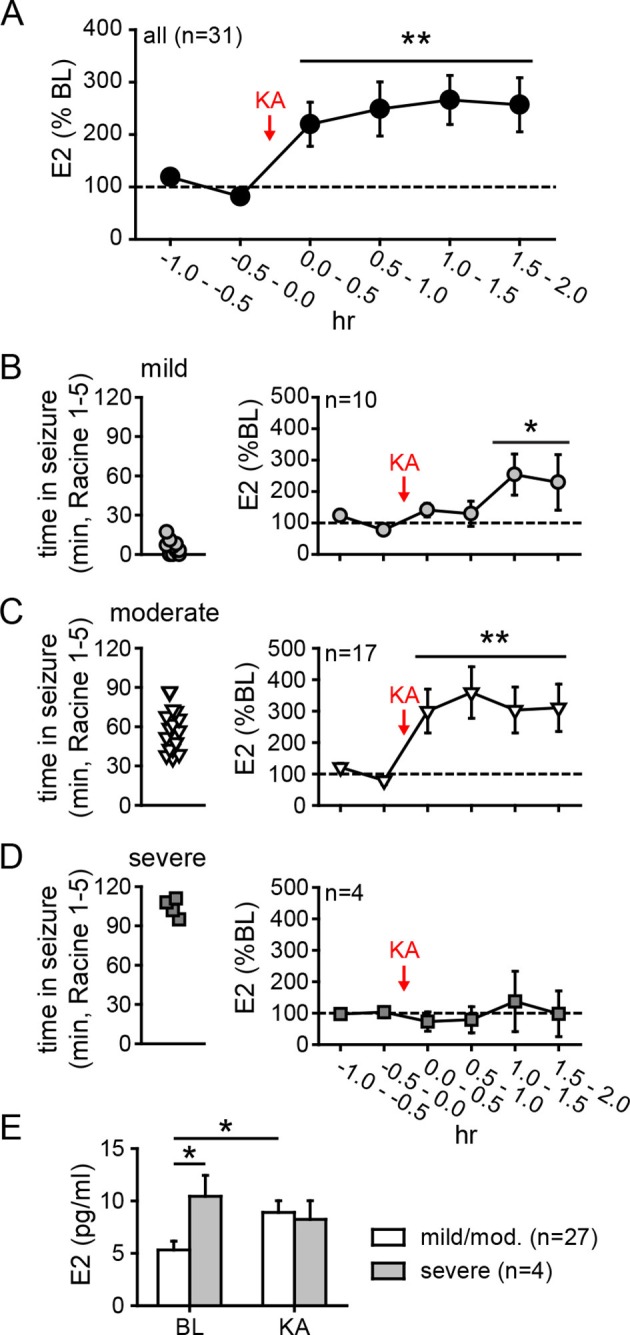
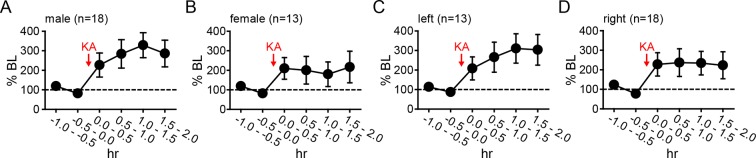
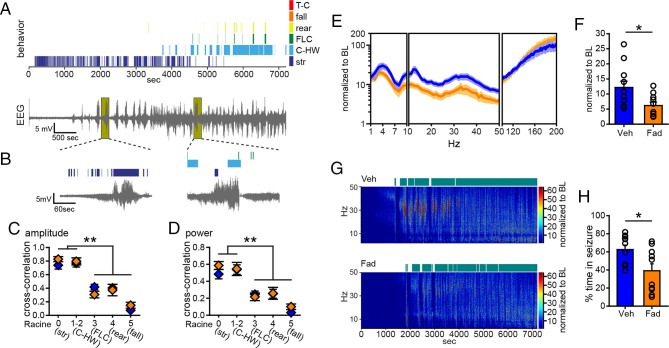
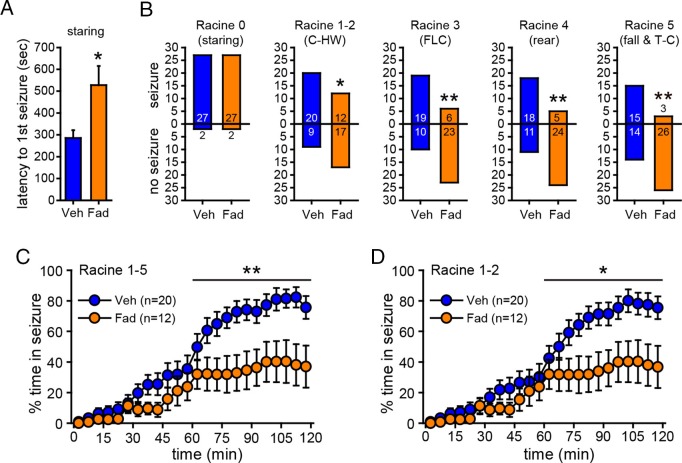
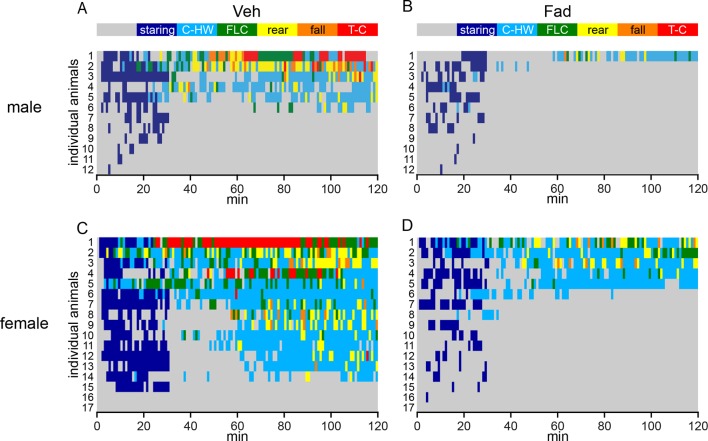
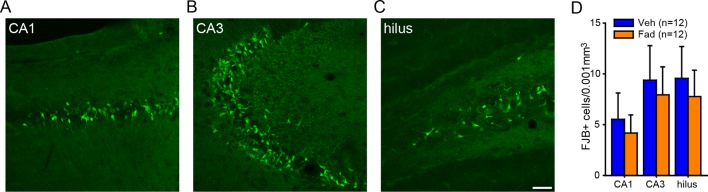
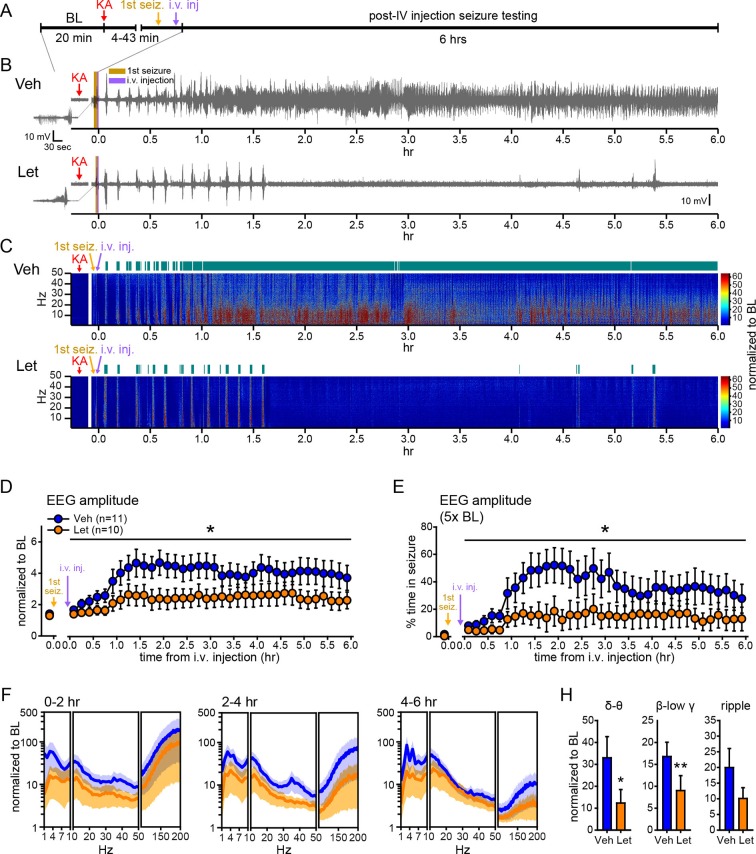
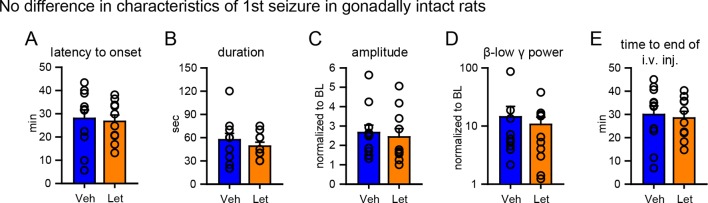
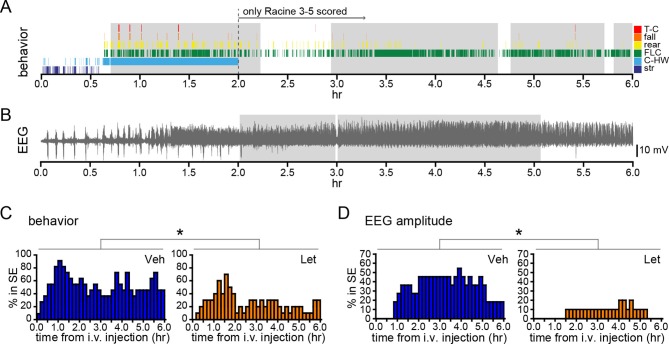
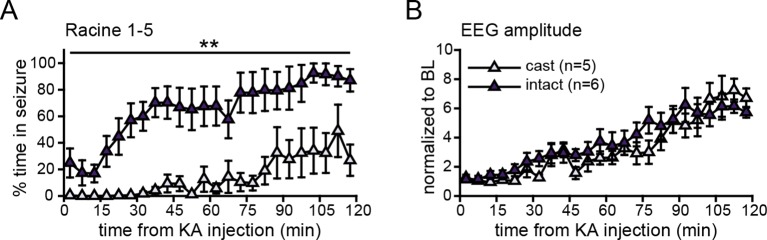
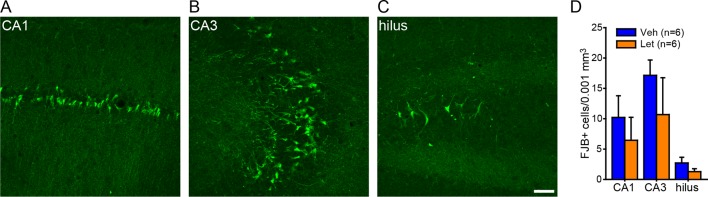
Status epilepticus (SE) is a common neurological emergency for which new treatments are needed. In vitro studies suggest a novel approach to controlling seizures in SE: acute inhibition of estrogen synthesis in the brain. Here, we show in rats that systemic administration of an aromatase (estrogen synthase) inhibitor after seizure onset strongly suppresses both electrographic and behavioral seizures induced by kainic acid (KA). We found that KA-induced SE stimulates synthesis of estradiol (E2) in the hippocampus, a brain region commonly involved in seizures and where E2 is known to acutely promote neural activity. Hippocampal E2 levels were higher in rats experiencing more severe seizures. Consistent with a seizure-promoting effect of hippocampal estrogen synthesis, intra-hippocampal aromatase inhibition also suppressed seizures. These results reveal neurosteroid estrogen synthesis as a previously unknown factor in the escalation of seizures and suggest that acute administration of aromatase inhibitors may be an effective treatment for SE.

Keywords: estradiol; hippocampus; kainic acid; microdialysis; neuroscience; rat; seizure.


Conflict of interest statement

The authors declare that no competing interests exist.

Figures

Figure 1.
Figure 1.. Systemic inhibition of aromatase after seizure onset suppresses electrographic seizures in gonadectomized rats.
(A) Schematic of experimental design. (B, C) Representative EEG (B) and normalized power spectrum (C) from one vehicle (Veh, top)- and one fadrozole (Fad, bottom)-treated rat. For EEG, the 1st seizure in each animal is shown on the left. Teal bars above heatmaps indicate seizures detected by 5x baseline power in the β-low γ (10–50 Hz) range as the threshold. (D) Mean ± SEM normalized EEG amplitude plotted in 5 min bins for vehicle (blue, n=12)- and fadrozole (orange, n=9)-treated rats. The escalation of seizures evident in vehicle-treated rats during the 2nd hr of testing was inhibited by fadrozole. (E) Mean ± SEM percent time in seizure using 5x baseline thresholds of EEG amplitude showing that the progressive increase in time in seizure evident in vehicle-treated rats was also inhibited by fadrozole. (F) Mean ± SEM normalized power spectrogram plotted in 1 Hz bins for δ-θ (1–10 Hz), β-low γ (10–50 Hz), and ripple (100–200 Hz) frequency ranges for vehicle (blue) and fadrozole (orange) rats showing the KA-induced increase in power relative to baseline for each frequency range examined. Increases in δ-θ (p<0.001, ANOVA) and β-low γ (p=0.01, ANOVA) power were lower in fadrozole- than vehicle-treated rats. (G) Mean ± SEM normalized EEG β-low γ power plotted in 5 min bins for vehicle (blue) and fadrozole (orange) rats showing the lack of seizure escalation in fadrozole-treated rats. (H) Mean ± SEM percent time in seizure plotted in 5 min bins using 5x baseline thresholds of β-low γ power for vehicle (blue) and fadrozole (orange) rats also showing the lack of seizure escalation in fadrozole-treated rats. *p<0.05 and **p<0.01 between vehicle- and fadrozole-treated rats, post-hoc unpaired t-tests. BL = baseline. DOI: http://dx.doi.org/10.7554/eLife.12917.003
Figure 1—figure supplement 1.
Figure 1—figure supplement 1.. No difference in characteristics of the 1st seizure in animals subsequently treated with vehicle or fadrozole.
(A-D) Representative raw EEG traces (top) and corresponding changes in β-low γ power (bottom) are shown for female (A, C) and male (B, D) rats subsequently treated with vehicle (A, B) or fadrozole (C, D). Increased β-low γ (10–50 Hz) power was evident for each 1st seizure. (E–I) There were no significant group differences between rats that subsequently received vehicle or fadrozole in (E) latency to seizure onset, (F) seizure duration, (G) amplitude, (H) β-low γ power, or (I) time to i.v. injection (i.e., the time between KA injection and the start of 2 hr testing). P values were >0.25 for all parameters, unpaired t-tests. DOI: http://dx.doi.org/10.7554/eLife.12917.004
Figure 1—figure supplement 2.
Figure 1—figure supplement 2.. Comparison of manual and 3x, 5x, and 10x baseline thresholds.
(A) Raw EEG, (B) normalized EEG amplitude, and (C) normalized β-low γ (10–50 Hz) power from a representative vehicle-treated rat. The colored bars above the traces indicate seizures detected manually (A), or using 3x, 5x, or 10x baseline threshold (B, C), as indicated on the right. While there were differences in sensitivity to minor seizures (e.g., 1st seizure at ~200 s) and the ability to resolve seizures during the merging phase (4000–7200 s), the effects of systemic fadrozole to suppress seizures were detected with all thresholds tested. (D, E) Systemic administration of fadrozole attenuated seizure progression, so that the fadrozole-treated rats spent significantly less time in seizure during the 2nd hr of testing, whether seizures were detected based on an increase in EEG amplitude (3x: F1,19=15.93, p<0.01; 10x: F1,19=5.79, p<0.05, D) or an increase in β-low γ power (3x: F1,19=20.97, p<0.001; 10x: F1,19=12.62, p<0.01, E) and regardless of the threshold used. *p<0.05 and **p<0.01 for the 2nd hr between vehicle- and fadrozole-treated rats, post-hoc unpaired t-tests. Statistics for 5x baseline threshold data are reported in the Results. DOI: http://dx.doi.org/10.7554/eLife.12917.005
Figure 2.
Figure 2.. Systemic inhibition of aromatase after seizure onset suppresses behavioral seizures and disrupts EEG-behavior relationships in gonadectomized rats.
(A) Representative behavioral seizures from the same vehicle (top)- and fadrozole (bottom)-treated rats as in Figure 1B plotted per sec. Each seizure behavior is indicated with a different color: staring (str, Racine 0, dark blue), chewing and head waving (C-HW, Racine 1–2, light blue), forelimb clonus (FLC, Racine 3 green), rearing (rear, Racine 4, yellow), falling (fall, Racine 5, orange), and tonic-clonic seizure (T-C, Racine 5, red). (B) EEG recording from the vehicle-treated rat shown in (A). (C) One early and one middle electrographic seizure are magnified to show their correspondence with mild limbic seizure behaviors using the same behavioral markers as in (A). (D, E) Cross-correlation of normalized hippocampal EEG amplitude (D) and β-low γ power (E) was stronger for mild limbic (Racine 0: staring (str), 1–2: chewing and head-waving (C-HW)) than convulsive seizures (Racine 3: forelimb clonus (FLC), 4: rearing, 5: falling) overall (**p<0.01 between each seizure behavior with post-hoc Newman-Keuls pairwise comparisons, vehicle: n=12, blue; fadrozole: n=9, orange). Fadrozole reduced the cross-correlation for some types of seizures (*p<0.05 between vehicle- and fadrozole-treated rats, unpaired t-tests). (F–H) Mean ± SEM percent time spent in seizures plotted in 5 min bins for all behaviors more severe than staring (Racine 1–5, F), mild limbic (Racine 1–2, G) or convulsive (Racine 3–5, H) seizures showing that behavioral seizure escalation evident in vehicle-treated rats was inhibited by fadrozole (*p<0.05 between vehicle- and fadrozole-treated rats, post-hoc unpaired t-tests). (I) Percentages of vehicle (blue, left)- and fadrozole (orange, right)-treated rats in behavioral SE are shown in 5 min bins. Fadrozole decreased the incidence of behavioral SE throughout 2 hrs (*p<0.05, ANOVA). (J) Percentages of vehicle- and fadrozole-treated rats in electrographic SE, which occurred only during the 2nd hr, are shown in 5 min bins. Fadrozole decreased the incidence of electrographic SE during the 2nd hr (*p<0.05, post-hoc unpaired t-tests). DOI: http://dx.doi.org/10.7554/eLife.12917.006
Figure 3.
Figure 3.. Microdialysis controls and basal neurosteroid E2 synthesis in the hippocampus.
(A) Probe recovery was similar (~30%) at both E2 concentrations tested and in both 1st (closed circle) and 2nd (open circle) 30 min samples, indicating a fast response in dialysate to changes in external E2 concentration (n=6 probes). (B) Dialysate and bath E2 concentrations were linearly correlated, with little difference between the 1st (closed circles) and the 2nd (open circles) 30 min samples at each concentration. (C) Carryover of E2 was evident in the 1st (closed circle) but not in the 2nd (open circle) 30 min samples after transferring a probe from an E2-containing to an E2-free bath. (D) E2 was detected in the hippocampus within 30 min of systemic E2 injection (10 μg in 25% ethanol/saline, s.c., n=2), followed by a gradual decline over 2 hr. (E) Retrodialysis of androstenedione (4-dione, 1 ng/ml, blue box), increased hippocampal E2 concentration by +8.9 ± 3.2 pg/ml (310 ± 67%, n=10, *p<0.05 relative to baseline (BL), paired t-tests). DOI: http://dx.doi.org/10.7554/eLife.12917.007
Figure 3—figure supplement 1.
Figure 3—figure supplement 1.. Synthetic pathway for C19 and C18 steroids and the results of cross-reactivity/interference testing for EIA.
(A) Synthetic pathway for C19 and C18 steroids. The gray boxes indicate steroids that we tested for cross-reactivity/interference, and blue steroids are those tested by the manufacturer. Estradiol is shown in red. (B) Table listing results of all our cross-reactivity/interference tests for glucocorticoids, androgens, estrogens and other neuroactive steroids. These results showed that the EIA used has little to no cross-reactivity with non-estrogens. DOI: http://dx.doi.org/10.7554/eLife.12917.008
Figure 4.
Figure 4.. Hippocampal neurosteroid E2 levels increase during KA seizures.
(A) Mean ± SEM percent baseline (BL) E2 before and after KA showing that KA-induced seizures increased hippocampal E2 concentration (**p<0.001 relative to BL, post-hoc paired t-tests). (B-D) Time in Racine 1–5 seizures (left) was used to classify rats into those experiencing mild (<30 min, B), moderate (30–90 min, C), or severe (>90 min, D) seizures, and E2 levels (right) were measured before and after KA. Rats with mild seizures (B) showed a small delayed increase in hippocampal E2, whereas rats with moderate seizures (C) showed a large (x3 BL) increase within 30 min (*p<0.05, **<0.01 relative to BL, paired post-hoc t-tests). E2 levels did not change in rats with the most severe seizures (D). (E) Mean ± SEM E2 concentrations during baseline (BL) and after KA injection (KA) for rats with mild/moderate vs. severe seizures shows that basal E2 was significantly higher in rats in which KA produced severe seizures (*p<0.05, t-test), whereas E2 increased from low to high levels in rats in which KA produced mild/moderate seizures (*p<0.05, t-test). DOI: http://dx.doi.org/10.7554/eLife.12917.009
Figure 4—figure supplement 1.
Figure 4—figure supplement 1.. Placements of microdialysis probes.
(A) A representative photomicrograph showing a microdialysis probe track extending into the hippocampus. Damage from the probe extended into the dentate gyrus due to the glue plug (~0.2 mm) at the tip of the probe. Scale = 1 mm. (B) The locations of dialysis probe active membranes (yellow boxes, 1 mm length) for rats used in experiments to investigate seizure-induced changes in hippocampal E2 levels. The numbers in the center indicate rostral-caudal coordinates from bregma (Paxinos and Watson, 2004). There were no differences in basal E2 concentration due to rostral-caudal probe placement (p=0.51, one-way ANOVA). DOI: http://dx.doi.org/10.7554/eLife.12917.010
Figure 4—figure supplement 2.
Figure 4—figure supplement 2.. No difference in seizure-induced changes in hippocampal E2 by sex or hemisphere.
The seizure-induced increase in hippocampal E2 was similar in both males (A) and females (B) (p=0.35, two-way mixed ANOVA) and in the left (C) and right (D) hippocampus (p=0.63, two-way mixed ANOVA). BL = baseline. DOI: http://dx.doi.org/10.7554/eLife.12917.011
Figure 5.
Figure 5.. Acute intra-hippocampal aromatase inhibition suppresses electrographic seizures in gonadectomized rats.
(A) Representative time-synched behavioral (top) and electrographic seizures (bottom) following KA. (B) Magnified views of early (left) and middle (right) electrographic seizures and accompanying seizure behaviors. (C, D) Mild limbic seizures (Racine 0: staring (str), and 1–2: chewing and head-waving (C-HW)) showed higher correlation with normalized hippocampal EEG amplitude (C) and β-low γ power (D) than convulsive seizure behaviors (Racine 3: forelimb clonus (FLC), 4: rearing, 5: falling) (**p<0.001 between each behavior, post-hoc Newman-Keuls pairwise comparisons, vehicle: n=11, blue; fadrozole: n=10, orange). Intra-hippocampal infusion of fadrozole did not alter these relationships. (E) Mean ± SEM normalized power spectrogram plotted in 1 Hz bins for δ-θ (1–10 Hz), β-low γ (10–50 Hz), and ripple (100–200 Hz) frequency ranges for vehicle and fadrozole rats showing the seizure-induced increase in power in the β-low γ range in both groups. (F) Fadrozole attenuated the seizure-induced increase in power in the β-low γ range (*p<0.05, unpaired t-test) but not the δ-θ or ripple ranges. (G) Representative normalized power spectrum from one vehicle- (top) and one fadrozole- (bottom) treated rat. Teal bars above heat maps indicate seizures detected by 5x baseline power in the β-low γ range as the threshold. (H) Fadrozole decreased time that power in the β-low γ range exceeded 5x baseline (*p<0.05, unpaired t-test). DOI: http://dx.doi.org/10.7554/eLife.12917.012
Figure 6.
Figure 6.. Acute intra-hippocampal aromatase inhibition delays seizure onset and suppresses behavioral seizures in gonadectomized rats.
(A) Fadrozole (Fad, n=29) increased latency to the 1st occurrence of staring compared to vehicle (Veh, n=29, **p<0.05, unpaired t-tests). (B) Fadrozole significantly reduced the proportions of rats exhibiting behavioral seizures beyond staring (*p<0.05 and **p<0.01 relative to Veh, X2-tests). Among the rats that reached particular seizure stages, fadrozole reduced the time spent in those seizures during the 2nd hr, considering any seizure stage beyond staring (Racine 1–5, C) or mild limbic seizures (Racine 1–2, D) (*p<0.05, **p<0.01 compared to Veh, post-hoc unpaired t-tests). DOI: http://dx.doi.org/10.7554/eLife.12917.013
Figure 6—figure supplement 1.
Figure 6—figure supplement 1.. Behavioral seizures shown in individual rats.
(A–D) Heatmaps illustrating the progression of seizures in individual male (A, B) and female (C, D) rats treated with either intra-hippocampal vehicle (A, C) or fadrozole (B, D). Each row represents data from an individual animal. The highest seizure stage reached in each 1 min bin is shown with the color scheme above the heatmaps (A, B). Although females spent significantly more time than males did in behavioral seizures overall (Racine 0–5: F1,54=7.90), beyond staring (Racine 1–5: F1,54=8.94), in mild limbic seizures specifically (Racine 1–2: F1,54=7.90), and in convulsive seizures (Racine 3–5: F1,54=7.90, all p<0.01, two-way mixed ANOVAs), no sex x drug interaction was statistically significant, indicating fadrozole is similarly effective in attenuating behavioral seizures in both sexes. DOI: http://dx.doi.org/10.7554/eLife.12917.014
Figure 6—figure supplement 2.
Figure 6—figure supplement 2.. No effect of intra-hippocampal aromatase inhibition on seizure-induced cell death in the hippocampus of gonadectomized rats.
Photomicrographs showing Fluoro-Jade B positive cells in CA1 (A), CA3 (B), and the hilus of dentate gyrus (C). Scale bar = 50 µm. (D) There was no effect of fadrozole (Fad) on the density of Fluoro-Jade B (FJB)-positive cells in any subregion. DOI: http://dx.doi.org/10.7554/eLife.12917.015
Figure 7.
Figure 7.. Systemic inhibition of aromatase after seizure onset suppresses electrographic seizures in gonadally intact rats.
(A) Schematic of experimental design. (B, C) Representative EEG (B) and normalized power spectrum (C) from one vehicle (Veh, top)- and one letrozole (Let, bottom)-treated rat. For EEG, the initial seizure in each animal is shown on the left. Teal bars above heatmaps indicate seizures detected by 5x baseline power in the β-low γ (10–50 Hz) range as the threshold. (D) Mean ± SEM normalized EEG amplitude plotted in 10 min bins for vehicle (blue, n=11)- and letrozole (orange, n=10)-treated rats. The seizure-related increase in EEG amplitude was suppressed by letrozole throughout 6 hrs of recording (p<0.05 post-hoc unpaired t-tests). (E) Mean ± SEM percent time in seizure using 5x baseline thresholds of EEG amplitude showing that the progressive increase in time in seizure evident in vehicle-treated rats was suppressed by letrozole (p<0.05 post-hoc unpaired t-tests). (F) Mean ± SEM normalized power spectrogram plotted in 1 Hz bins for δ-θ (1–10 Hz), β-low γ (10–50 Hz), and ripple (100–200 Hz) frequency ranges for vehicle (blue)- and letrozole (orange)-treated rats are shown for each 2 hr epoch. (H) Seizure-induced increases in power relative to baseline were lower in letrozole- than vehicle-treated rats in δ-θ and β-low γ ranges (ANCOVA, *p<0.05 and **p<0.01 between vehicle- and letrozole-treated rats, post-hoc unpaired t-tests). BL = baseline. DOI: http://dx.doi.org/10.7554/eLife.12917.016
Figure 7—figure supplement 1.
Figure 7—figure supplement 1.. No difference in characteristics of 1st seizures in gonadally intact rats subsequently treated with vehicle or letrozole.
There were no significant group differences between rats that subsequently received vehicle or letrozole in (A) latency to seizure onset, (B) seizure duration, (C) amplitude, (D) β-low γ power, or (E) time to i.v. injection (i.e., the time between KA injection and the start of 6 hr testing). P values were >0.41 for all parameters, unpaired t-tests. DOI: http://dx.doi.org/10.7554/eLife.12917.017
Figure 8.
Figure 8.. Systemic inhibition of aromatase after seizure onset suppresses status epilepticus in gonadally intact rats.
Behavioral (A) and electrographic (B) seizures from a representative vehicle-treated rat with periods of SE (status epilepticus) highlighted in gray. All Racine 0–5 seizure behaviors were scored for the first 2 hrs whereas only Racine 3–5 seizure behaviors were scored for the remaining 4 hrs. (C) Percentages of vehicle (blue, left, n=11)- and letrozole (orange, right, n=10)-treated rats in behavioral SE plotted in 10 min bins. Letrozole decreased the incidence of behavioral SE (*p<0.05, ANCOVA). (D) Percentages of the same vehicle- and letrozole-treated rats in electrographic SE plottedin 10 min bins. Letrozole decreased the incidence of electrographic SE (*p<0.05, ANCOVA). DOI: http://dx.doi.org/10.7554/eLife.12917.018
Figure 8—figure supplement 1.
Figure 8—figure supplement 1.. Castration attenuated behavioral, but not electrographic seizures.
Gonadally intact males spent significantly more time in behavioral (A, p<0.01, ANOVA), but not in electrographic (B, p>0.5, ANOVA), seizures than castrates did. BL = baseline. DOI: http://dx.doi.org/10.7554/eLife.12917.019
Figure 8—figure supplement 2.
Figure 8—figure supplement 2.. No effect of systemic aromatase inhibition on seizure-induced cell death in the hippocampus of gonadally intact rats.
Photomicrographs showing Fluoro-Jade B positive cells in CA1 (A), CA3 (B), and the hilus of dentate gyrus (C). Scale bar = 50 µm. (D) There was no effect of letrozole (Let) on the density of Fluoro-Jade B (FJB)-positive cells in any subregion. DOI: http://dx.doi.org/10.7554/eLife.12917.020

Similar articles

Cited by

References

    1. Bäckström T. Epileptic seizures in women related to plasma estrogen and progesterone during the menstrual cycle. Acta Neurologica Scandinavica. 1976;54:321–347. doi: 10.1111/j.1600-0404.1976.tb04363.x. - DOI - PubMed
    1. Balthazart J, Baillien M, Ball GF. Rapid control of brain aromatase activity by glutamatergic inputs. Endocrinology. 2006;147:359–366. doi: 10.1210/en.2005-0845. - DOI - PubMed
    1. Betjemann JP, Lowenstein DH. Status epilepticus in adults. The Lancet. Neurology. 2015;14:615–624. doi: 10.1016/S1474-4422(15)00042-3. - DOI - PubMed
    1. Bhatnagar AS. The discovery and mechanism of action of letrozole. Breast Cancer Research and Treatment. 2007;105 Suppl 1:7–17. doi: 10.1007/s10549-007-9696-3. - DOI - PMC - PubMed
    1. Boulware MI, Weick JP, Becklund BR, Kuo SP, Groth RD, Mermelstein PG. Estradiol activates group I and II metabotropic glutamate receptor signaling, leading to opposing influences on cAMP response element-binding protein. Journal of Neuroscience. 2005;25:5066–5078. doi: 10.1523/JNEUROSCI.1427-05.2005. - DOI - PMC - PubMed

MeSH terms

LinkOut - more resources