. 2016 Jul 5;7(27):41123-41141.
doi: 10.18632/oncotarget.8636.

Characterization of Lgr5+ progenitor cell transcriptomes in the apical and basal turns of the mouse cochlea

Affiliations

Characterization of Lgr5+ progenitor cell transcriptomes in the apical and basal turns of the mouse cochlea

Muhammad Waqas et al. Oncotarget. .

Abstract

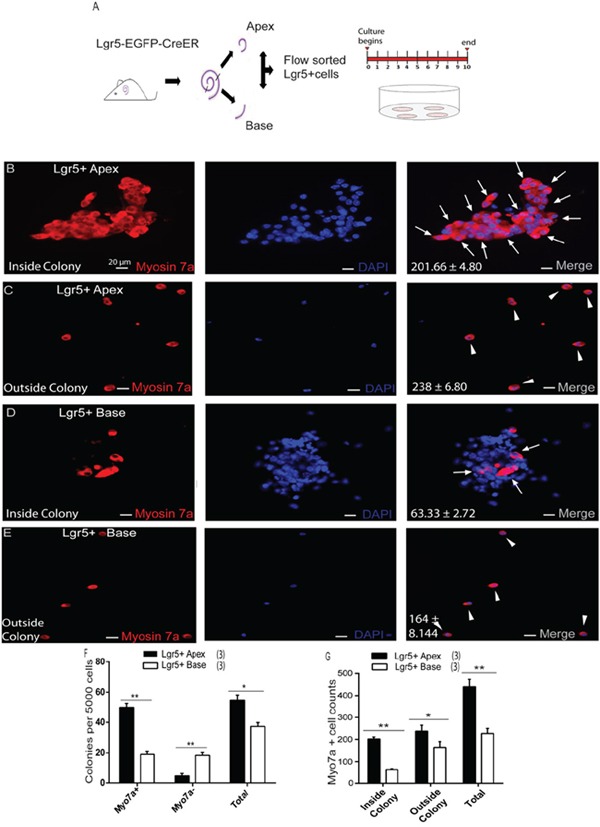
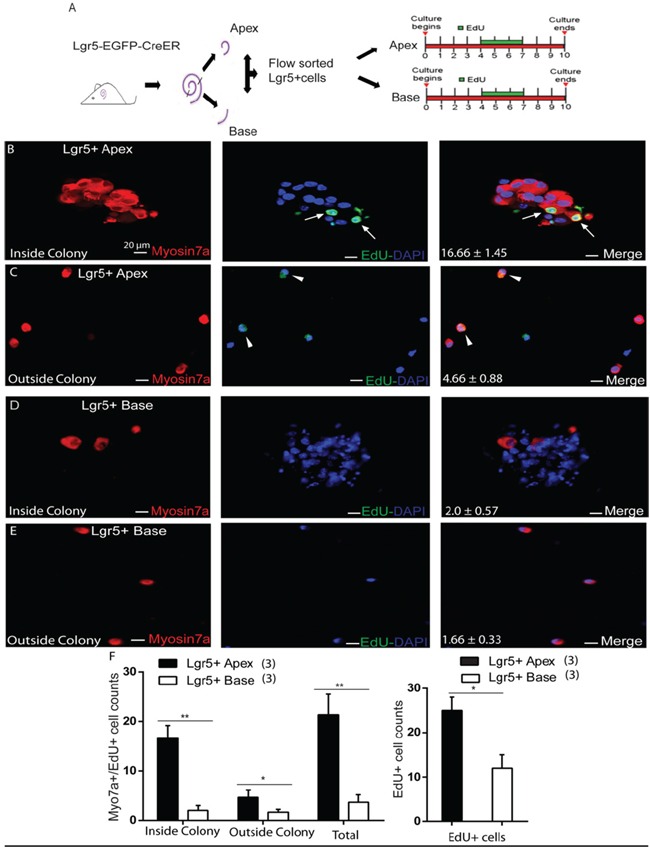
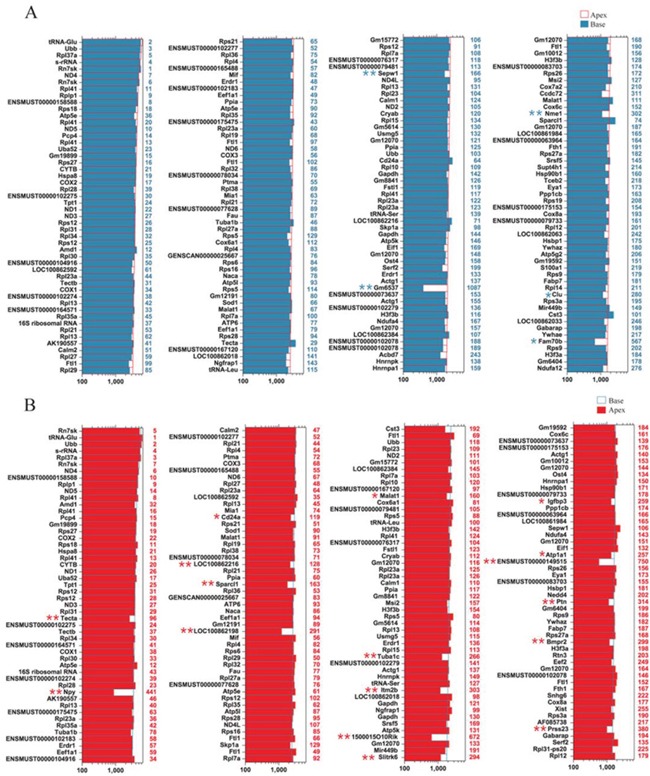
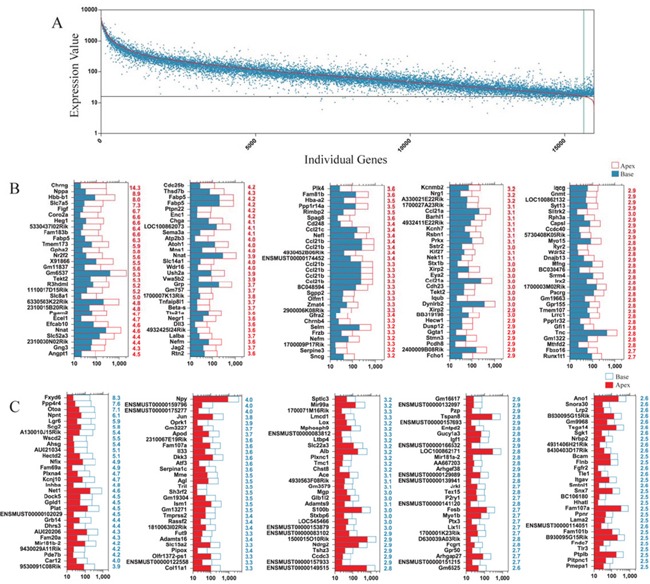
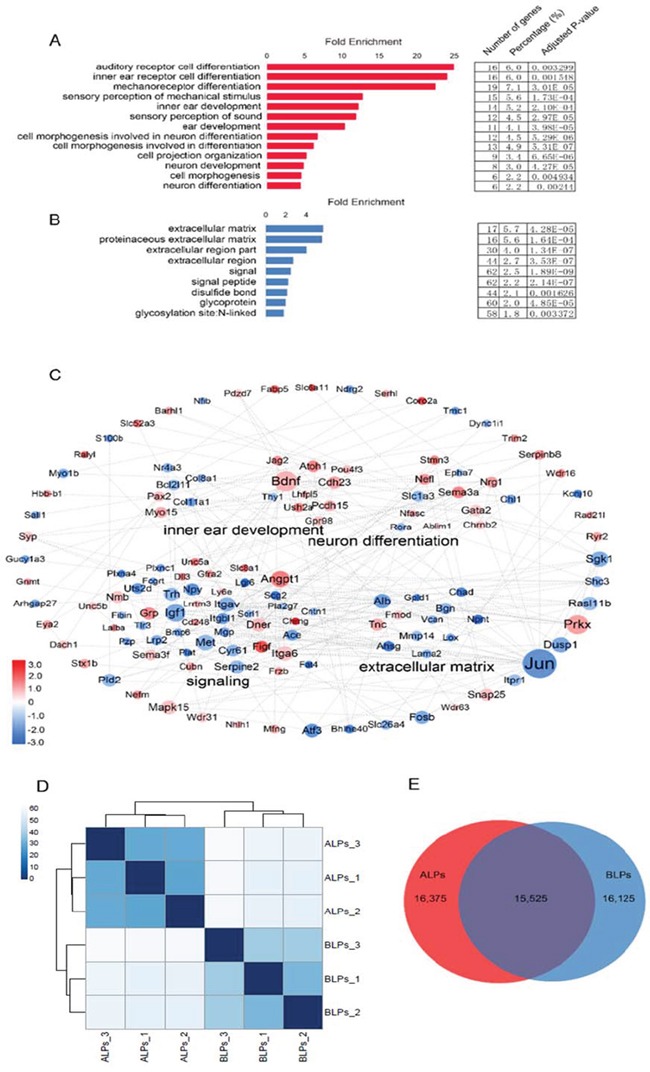
Lgr5+ supporting cells (SCs) are enriched hair cell (HC) progenitors in the cochlea, and several studies have shown a difference in the proliferation and HC regeneration ability of SCs between the apical and basal turns. However, the detailed differences between the transcriptomes of the apical and basal Lgr5+ SCs have not yet been investigated. We found that when isolated by FACS, Lgr5+ cells from the apex generated significantly more HCs and had significantly higher proliferation and mitotic HC regeneration ability compared to those from the base. Next, we used microarray analysis to determine the transcriptome expression profiles of Lgr5+ progenitors from the apex and the base. We first analyzed the genes that were enriched and differentially expressed in Lgr5+ progenitors from the apex and the base. Then we analyzed the cell cycle genes and the transcription factors that might regulate the proliferation and differentiation of Lgr5+ progenitors. Lastly, to further analyze the role of differentially expressed genes and to gain an overall view of the gene network in cochlear HC regeneration, we created a protein-protein interaction network. Our datasets suggest the possible genes that might regulate the proliferation and HC regeneration ability of Lgr5+ progenitors, and these genes might provide new therapeutic targets for HC regeneration in the future.

Keywords: Lgr5; Wnt signaling; cochlea; proliferation; regeneration.


Conflict of interest statement

The authors declare that they have no competing interests.

Figures

Figure 1
Figure 1. In vivo lineage tracing of Lgr5+ cells in the apical and basal turns of the postnatal cochlea
A. Tamoxifen was injected intraperitoneally into P1 Lgr5-EGFP-creER/Rosa26-tdTomato mice, and the apical and basal regions were examined at P3 and P7. B. Counting data showed significantly higher numbers of tdTomato and tdTomato/Myo7a+ cells in the apex than in the base of the postnatal cochlea. C and D. Low-magnification images of the apical and basal regions show the expression of tdTomato and Myo7a. E. Traced tdTomato/Myo7a+ cells were found in the outer hair cell subset (arrow) in the apex. F. Few traced tdTomato/Myo7a+ cells were observed in the base. *p < 0.01. In panel B, n is shown in parentheses. Scale bars are 20 μm in C-F.
Figure 2
Figure 2. Re-sort analysis, immunostaining, and quantitative PCR of flow-sorted Lgr5+ cells from the apical and basal turns of the postnatal cochlea
A. Lgr5-EGFP-CreER cochleae were dissected and separated into apical and basal fractions, and GFP+ and GFP− cells from each fraction were sorted by flow cytometry. B. Re-sort analysis of ALPs and BLPs demonstrated >90% purity. C. Immediate immunostaining after sorting of Lgr5+ cells from the apex showed a high percentage of Sox2+ (95.6%) and GFP+ (93%) cells but no Myo7a+ cells (0.0%). D. Immunostaining of Lgr5+ cells from the base also showed a high percentage of Sox2+ (94.2%) and GFP+ (94.6%) cells, and no Myo7a+ (0.0%) cells were found in the sorted cells. E. Quantitative PCR results showed the relative expression of Lgr5, Sox2, and Brn3.1 in ALPs and BLPs.
Figure 3
Figure 3. Lgr5+ SCs in the apex acted as hair cell progenitors in vitro
A. Lgr5+ cells from the apical and basal turns of the cochlea were sorted by flow cytometry. B. Lgr5+ cells were isolated from the apex of Lgr5-EGFP-CreER mice culture for 10 days, and the majority of cells generated Myo7a+ hair cells (arrows) inside the colony. DAPI was used to stain the nuclei. C. More Myo7a+ hair cells (arrowheads) were also observed outside the colony. D. Lgr5+ cells were isolated from the base of the cochlea of Lgr5-EGFP-CreER mice cultured for 10 days, and only a few cells generated Myo7a+ hair cells (arrows) inside the colony. E. Relatively fewer Myo7a+ hair cells (arrowhead) were observed outside the colony. F. Lgr5+ cells from the apex formed more colonies than those from the base. Ninety percent of the colonies from the apex contained Myo7a+ cells. G. Lgr5+ cells from the apex generated significantly more Myo7a+ cells inside the colony compared with the base. Data are presented as mean ± SD. *p < 0.01; **p < 0.001. In panels F and G, n is shown in parentheses. Scale bars are 20 μm in B-E.
Figure 4
Figure 4. EdU labeling measures the proliferation ability of Lgr5+ cells from the apex and the base
A. Flow-sorted Lgr5+ cells from cultures of the apex and base for 10 days (EdU was included in the culture from day 4 to day 7). B. Lgr5+ cells from the apex produced more Myo7a+/Edu+ cells (arrow) inside the colony. C. Fewer Myo7a+/Edu+ cells were observed outside the colony (arrowhead). D and E. Lgr5+ cells from the base showed a lack of Myo7a/EdU labeling inside and outside the colony F. Graph showing the significantly higher number of Myo7a+/EdU+ cells inside the colonies from the apex compared to the base, and only the EdU+ cell number was also comparatively higher in the apex than the base. In panel F, n is shown in parentheses. Data are presented as mean ± SD. *p < 0.01; **p < 0.001. Scale bars are 20 μm.
Figure 5
Figure 5. Neurosphere passage and differentiation assay
A. Flow-sorted apical and basal Lgr5+ cells cultured for 5 days in ultra-low-attachment dishes for sphere passage assay. B. Lgr5+ cells from the apex generated significantly more neurospheres than those from the base. C. Neurospheres from Lgr5+ cells in the apex had a significantly higher rate of expansion than those from the base. D. No significant difference was observed in the diameter of neurospheres generated from Lgr5+ cells from the apex as compared to the base. E. Neurospheres derived from ALPs and BLPs were separated from the first generation to perform the differentiation assay. F. Upon differentiation of Lgr5+ neurospheres from the apex, a substantial proportion of Myo7a+ cells (arrows) were observed that also incorporated EdU (arrowhead). G. A smaller number of Myo7a+ cells (arrow) were observed upon differentiation of basal Lgr5+ neurospheres. H. Each Lgr5+ differentiated neurosphere from the apex generated significantly more Myo7a+ HCs than the base. I. Graph showing the significant difference in HC generation between apical and basal Lgr5+ neurospheres. J. More Myo7a+/EdU+ cells were found in differentiated neurospheres from the apex compared to the base. Data are presented as mean ± SD. In panels C, D, and G-I, n is shown in parentheses. *p < 0.05; **p < 0.01. Scale bars are 50 μm in B and 20 μm in E and F.
Figure 6
Figure 6. Expression levels of the top 200 genes in ALPs and BLPs
A. Expression levels of the top 200 genes in ALPs in descending order. Numbers in blue on the right side of each panel represent the ranking of the same genes in BLPs. B. Expression levels of the top 200 genes in BLPs in descending order. Numbers in red on the right side of each panel represent the ranking of the same genes in ALPs.
Figure 7
Figure 7. Differentially expressed genes in ALPs and BLPs
A. All differentially expressed genes in ALPs and BLPs. The red line represents the expression level of 16,975 transcripts from ALPs, and each blue dot represents the expression level of the same transcripts from BLPs. B. The 150 most differentially expressed genes in 575 ALPs. The numerical values in red on the right side of each panel represent the fold difference in expression for ALPs versus BLPs. C. The 150 most differentially expressed genes in BLPs. The numerical values in red on the right side of each panel represent the fold difference in expression for BLPs versus ALPs.
Figure 8
Figure 8. Genes regulating the cell cycle and transcription factors
A. Expression levels of 60 genes that are important for cell cycle regulation. B. Expression levels of differentially expressed transcription factors. C and D. Quantitative RT-PCR analysis of the nine cell cycle regulatory genes and the nine transcription factors that are differentially highly expressed in ALPs and BLPs as identified by microarray analysis. Data are presented as the relative fold change in expression. Student's paired t-test; *p < 0.05; **p < 0.01; ***p < 0.001.
Figure 9
Figure 9. Gene ontology (GO) and network analysis of the genes differentially expressed in ALPs and BLPs, and PCA analysis
A. GO analysis of genes differentially expressed in ALPs. B. GO analysis of genes differentially expressed in BLPs. C. STRING protein-protein interaction analysis of genes differentially expressed in ALPs (red) and BLPs (blue). The dashed lines indicate protein-protein interactions reported by the STRING analysis. The DAVID GO annotation was used to cluster the genes by biological function. D. Sample clustering analysis for all replicates of ALPs and BLPs. E. Venn diagram showing genes expressed in ALPs and BLPs.

Similar articles

Cited by

References

    1. Corwin JT, Cotanche DA. Regeneration of sensory hair cells after acoustic trauma. Science. 1988;240:1772–1774. - PubMed
    1. Balak KJ, Corwin JT, Jones JE. Regenerated hair cells can originate from supporting cell progeny: evidence from phototoxicity and laser ablation experiments in the lateral line system. The Journal of neuroscience. 1990;10:2502–2512. - PMC - PubMed
    1. Ma EY, Rubel EW, Raible DW. Notch signaling regulates the extent of hair cell regeneration in the zebrafish lateral line. The Journal of neuroscience. 2008;28:2261–2273. - PMC - PubMed
    1. Bramhall NF, Shi F, Arnold K, Hochedlinger K, Edge AS. Lgr5-positive supporting cells generate new hair cells in the postnatal cochlea. Stem cell reports. 2014;2:311–322. - PMC - PubMed
    1. Cox BC, Chai R, Lenoir A, Liu Z, Zhang L, Nguyen DH, Chalasani K, Steigelman KA, Fang J, Rubel EW, Cheng AG, Zuo J. Spontaneous hair cell regeneration in the neonatal mouse cochlea in vivo. Development (Cambridge, England) 2014;141:816–829. - PMC - PubMed

Substances