. 2016:2016:2532371.
doi: 10.1155/2016/2532371. Epub 2016 Mar 16.

Antipsychotic Drugs Inhibit Platelet Aggregation via P2Y 1 and P2Y 12 Receptors

Affiliations

Antipsychotic Drugs Inhibit Platelet Aggregation via P2Y 1 and P2Y 12 Receptors

Chang-Chieh Wu et al. Biomed Res Int. 2016.

Abstract

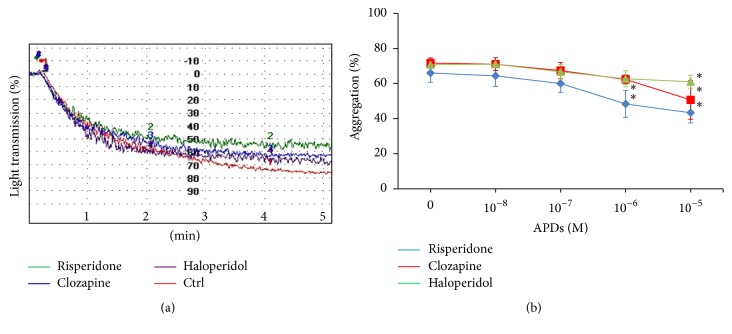
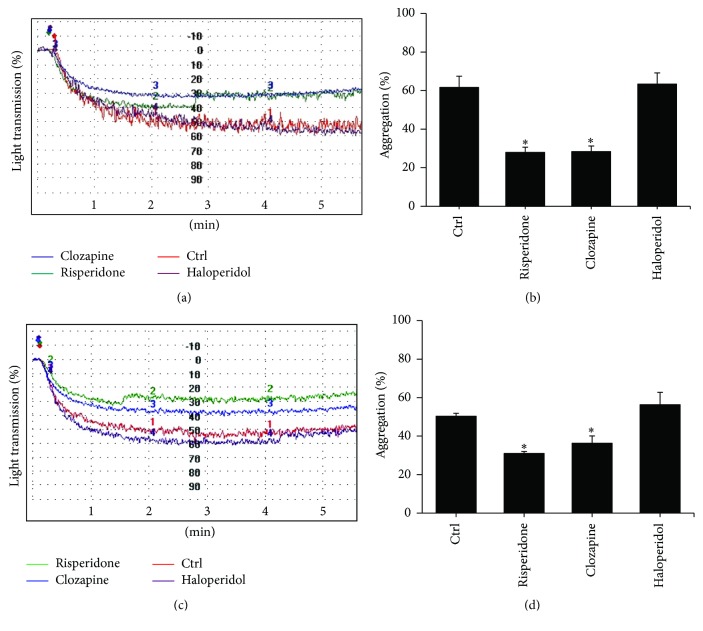
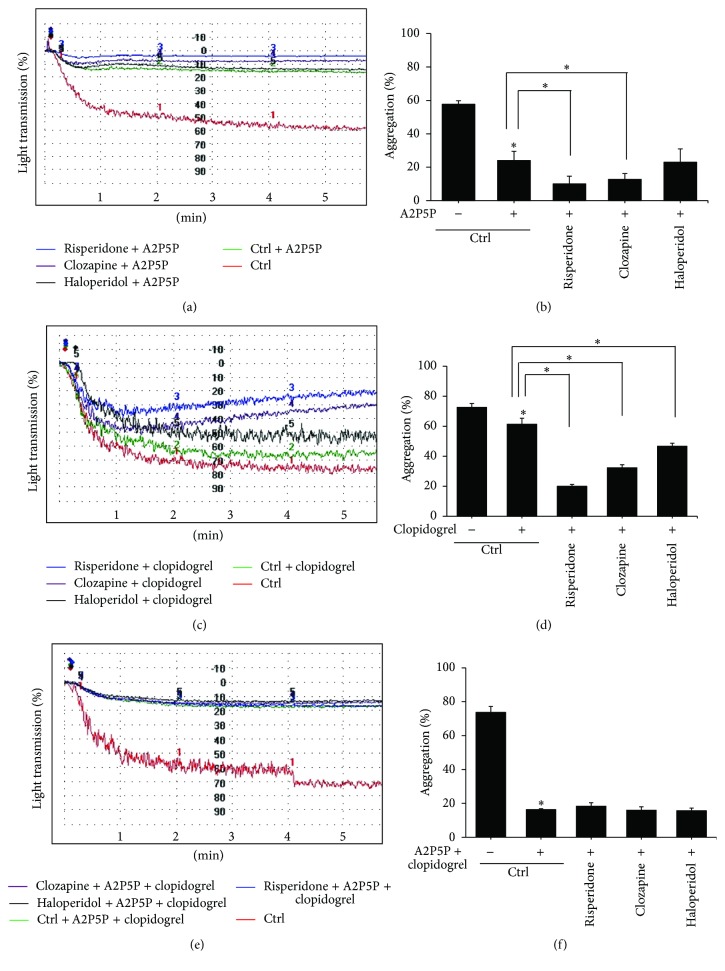
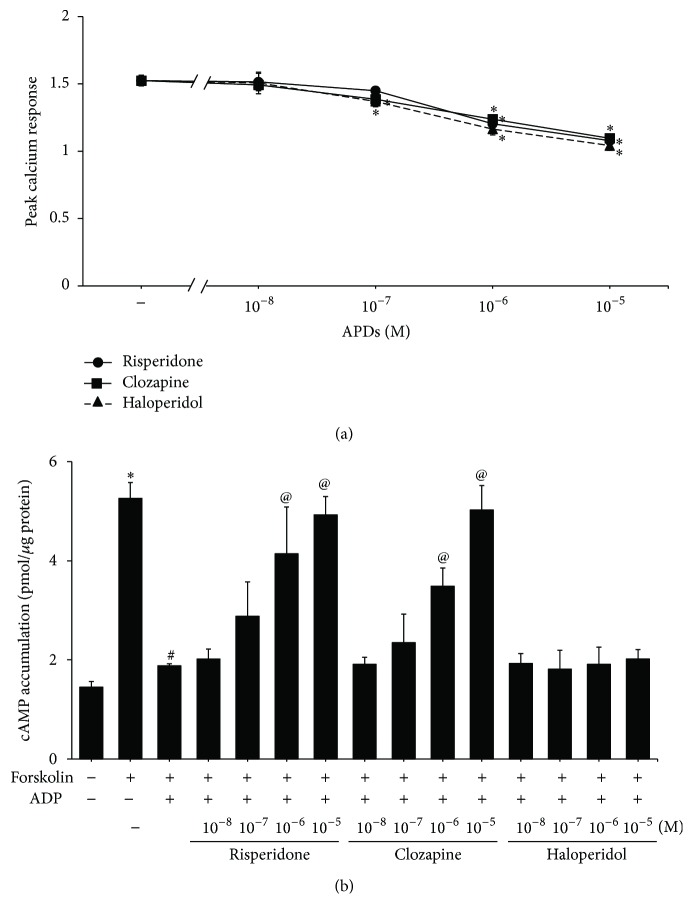
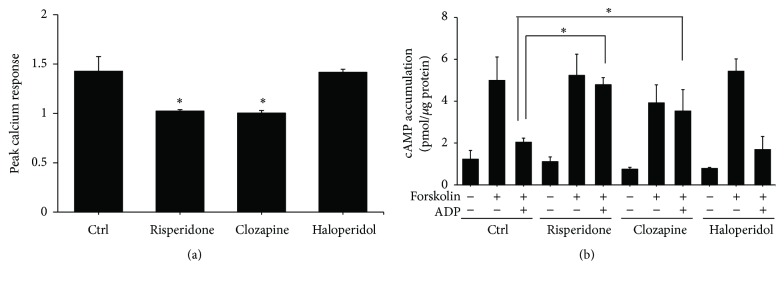
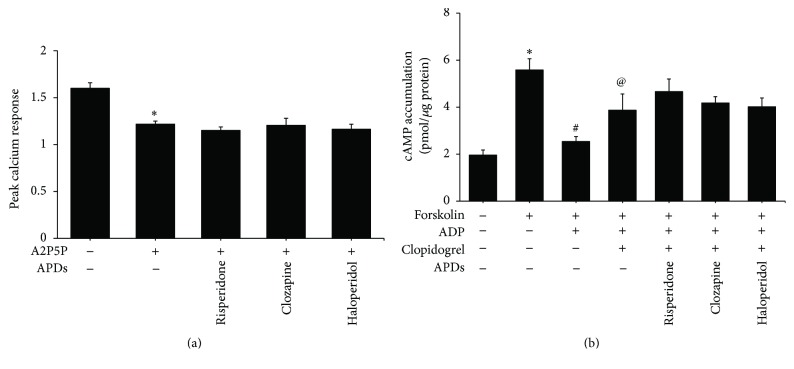
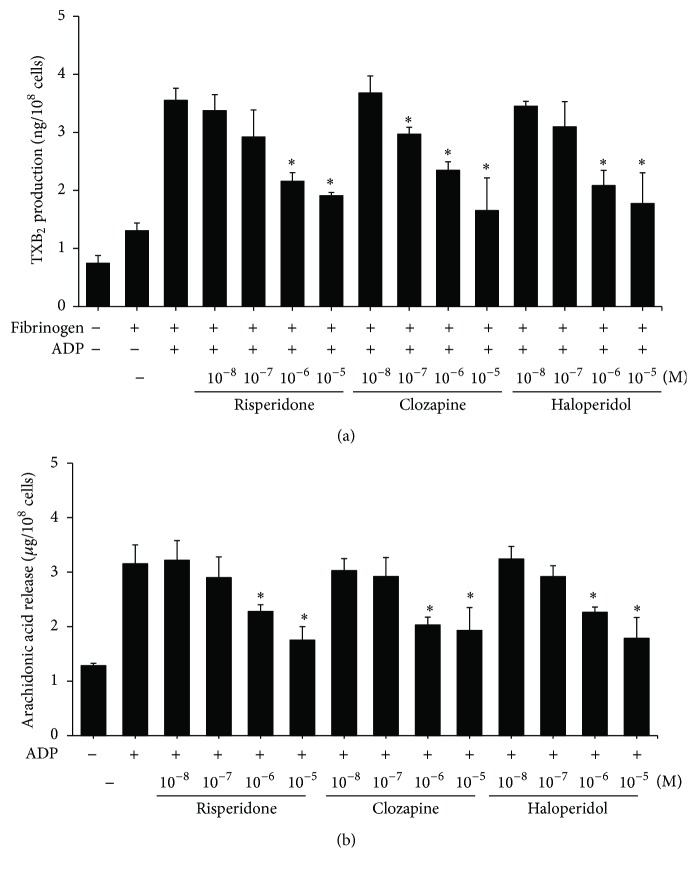
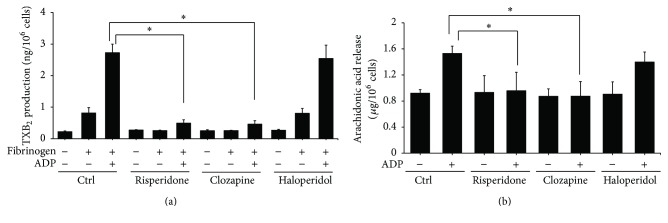
Antipsychotic drugs (APDs) used to treat clinical psychotic syndromes cause a variety of blood dyscrasias. APDs suppress the aggregation of platelets; however, the underlying mechanism remains unknown. We first analyzed platelet aggregation and clot formation in platelets treated with APDs, risperidone, clozapine, or haloperidol, using an aggregometer and rotational thromboelastometry (ROTEM). Our data indicated that platelet aggregation was inhibited, that clot formation time was increased, and that clot firmness was decreased in platelets pretreated with APDs. We also examined the role two major adenosine diphosphate (ADP) receptors, P2Y1 and P2Y12, play in ADP-mediated platelet activation and APD-mediated suppression of platelet aggregation. Our results show that P2Y1 receptor stimulation with ADP-induced calcium influx was inhibited by APDs in human and rats' platelets, as assessed by in vitro or ex vivo approach, respectively. In contrast, APDs, risperidone and clozapine, alleviated P2Y12-mediated cAMP suppression, and the release of thromboxane A2 and arachidonic acid by activated platelets decreased after APD treatment in human and rats' platelets. Our data demonstrate that each APD tested significantly suppressed platelet aggregation via different mechanisms.


Figures

Figure 1
Figure 1
The effect of APDs on ADP-induced platelet aggregation in human platelets. PRPs were preincubated with 1 × 10⁻⁶ M (a) or indicated concentration (b) of APDs before stimulation with 10 μM ADP. This is a representative graph illustrating the aggregometer readings from one of three independent experiments (a). Experimental results are summarized as mean (±SD) percentage of aggregation in PRP (b). p < 0.05.
Figure 2
Figure 2
The effect of chronic APDs on ADP-induced platelet aggregation in platelets from rats. Rats were treated with haloperidol (1 mg/kg), clozapine (20 mg/kg), risperidone (1 mg/kg), or saline for 7 days (a and b) or 28 days (c and d) as described in Section 2. PRPs were prepared and stimulated with 10 μM ADP. These are representative graphs illustrating the aggregometer readings from one of three independent experiments (a and c). Experimental results are summarized as mean (±SD) percentage of aggregation in PRPs (b and d). p < 0.05.
Figure 3
Figure 3
The effect of P2 receptor antagonists on APDs-mediated platelet aggregative suppression. PRPs were preincubated with 1 × 10⁻⁶ M APDs before stimulation with 10 μM ADP alone or in the presence of 1 mM A2P5P (a and b), 30 μM clopidogrel (c and d), or both A2P5P and clopidogrel (e and f). These are representative graphs illustrating the aggregometer readings from one of three independent experiments (a, c, and e). Experimental results are summarized as mean (±SD) percentage of aggregation in PRPs (b, d, and f). p < 0.05.
Figure 4
Figure 4
The effect of APDs on P2Y1 and P2Y12 in human platelets. (a) PRPs were treated with the indicated APD concentrations for 1 hour. They were then incubated with Fura-2AM at 37°C. Platelets were harvested and ADP-induced calcium responses were measured. The peak responses were compared with those in nonpretreated control rats. p value < 0.05. (b) PRPs were treated with the indicated APD concentrations for 1 hour. Isolated platelets were then incubated with 10 μM forskolin and 10 μM ADP at 37°C. Cell lysates were prepared and the levels of cAMP were measured using an enzyme immunoassay. Data are represented as the mean ± SEM (n = 3). p value < 0.05 for the control group compared to control group treated with forskolin. # p value < 0.05 for the control group treated with forskolin and ADP compared to the control group treated with forskolin only. @ p value < 0.05 for cells treated with APDs followed by forskolin and ADP stimulation compared to cells stimulated with forskolin and ADP alone.
Figure 5
Figure 5
The effect of chronic APDs on P2Y1 and P2Y12 in platelets from rats. Chronic APD-treated PRPs were produced by treating rats with the indicated concentration of APDs as described in Section 2. (a) Platelets were harvested at day 28 and ADP-induced calcium responses were measured. The peak responses were compared with those in nonpretreated ADP platelets. p value < 0.05 for cells treated with chronic APDs followed by ADP stimulation compared to control cells stimulated with ADP alone. (b) Isolated platelets were harvested at day 28 and then incubated with 10 μM forskolin and 10 μM ADP at 37°C. Cell lysates were prepared and the levels of cAMP were measured using an enzyme immunoassay. Data are represented as the mean ± SEM (n = 3). p value < 0.05 for cells treated with chronic APDs followed by forskolin and ADP stimulation compared to control cells stimulated with forskolin and ADP alone.
Figure 6
Figure 6
The effect of P2 receptor antagonists on APDs-mediated P2Y1 and P2Y12 receptors signaling in human platelets. (a) PRPs were pretreated with 1 × 10⁻⁶ M APDs for 1 hour and then incubated with Fura-2AM at 37°C. Platelets were harvested and then treated with 1 mM A2P5P for 3 min. ADP was added and subsequent calcium responses were measured. p value < 0.05 for the control group compared to control group treated with A2P5P. (b) PRPs were pretreated with 1 × 10⁻⁶ M APDs for 1 hour. Isolated platelets were then incubated with 10 μM forskolin, 30 μM clopidogrel, and 10 μM ADP at 37°C. Cell lysates were prepared and the levels of cAMP were measured using an enzyme immunoassay. Data are represented as the mean ± SEM (n = 3). p value < 0.05 for the control group compared to control group treated with forskolin. # p value < 0.05 for the control group treated with forskolin and ADP compared to the control group treated with forskolin only. @ p value < 0.05 for cells treated with clopidogrel followed by forskolin and ADP stimulation compared to cells stimulated with forskolin and ADP alone.
Figure 7
Figure 7
The effect of APDs on APD-induced TXA2 and arachidonic acid production in human platelets. PRPs were treated with the indicated concentrations of APDs for 1 hour. Isolated platelets were then stimulated with 3 μM fibrinogen and 10 μM ADP at 37°C for 3 minutes. Reactions were stopped and the content of thromboxane B2 (a) or arachidonic acid (b) was measured using an enzyme immunoassay. Data represent the mean ± SEM (n = 3). p value < 0.05.
Figure 8
Figure 8
The effect of chronic APDs on APD-induced TXA2 and arachidonic acid production in platelets from rats. Chronic APD-treated PRPs were produced by treating rats with the indicated concentration of APDs as described in Section 2. Isolated platelets were harvested at day 28 and then stimulated with 3 μM fibrinogen and 10 μM ADP at 37°C for 3 minutes. Reactions were stopped and the content of thromboxane B2 (a) or arachidonic acid (b) was measured using an enzyme immunoassay. Data represent the mean ± SEM (n = 3). p value < 0.05 for cells treated with chronic APDs followed by fibrinogen and ADP stimulation compared to control cells stimulated with fibrinogen and ADP alone.

Similar articles

Cited by

References

    1. Erbağci A. B., Herken H., Köylüoglu O., Yilmaz N., Tarakçioglu M. Serum IL-1β, sIL-2R, IL-6, IL-8 and TNF-α in schizophrenic patients, relation with symptomatology and responsiveness to risperidone treatment. Mediators of Inflammation. 2001;10(3):109–115. - PMC - PubMed
    1. Zhang X. Y., Zhou D. F., Cao L. Y., Zhang P. Y., Wu G. Y., Shen Y. C. Changes in serum interleukin-2, -6, and -8 levels before and during treatment with risperidone and haloperidol: relationship to outcome in schizophrenia. Journal of Clinical Psychiatry. 2004;65(7):940–947. doi: 10.4088/jcp.v65n0710. - DOI - PubMed
    1. Cazzullo C. L., Sacchetti E., Galluzzo A., et al. Cytokine profiles in schizophrenic patients treated with risperidone: a 3-month follow-up study. Progress in Neuro-Psychopharmacology & Biological Psychiatry. 2002;26(1):33–39. doi: 10.1016/s0278-5846(01)00221-4. - DOI - PubMed
    1. Kim D.-J., Kim W., Yoon S.-J., et al. Effect of risperidone on serum cytokines. International Journal of Neuroscience. 2001;111(1-2):11–19. doi: 10.3109/00207450108986549. - DOI - PubMed
    1. Drzyzga Ł., Obuchowicz E., Marcinowska A., Herman Z. S. Cytokines in schizophrenia and the effects of antipsychotic drugs. Brain, Behavior, and Immunity. 2006;20(6):532–545. doi: 10.1016/j.bbi.2006.02.002. - DOI - PubMed

Publication types

Substances

LinkOut - more resources