Review
. 2016 Mar 15;6(2):975-1003.
doi: 10.1002/cphy.c150038.

Hemodynamics

Affiliations
Review

Hemodynamics

Timothy W Secomb. Compr Physiol. .

Abstract

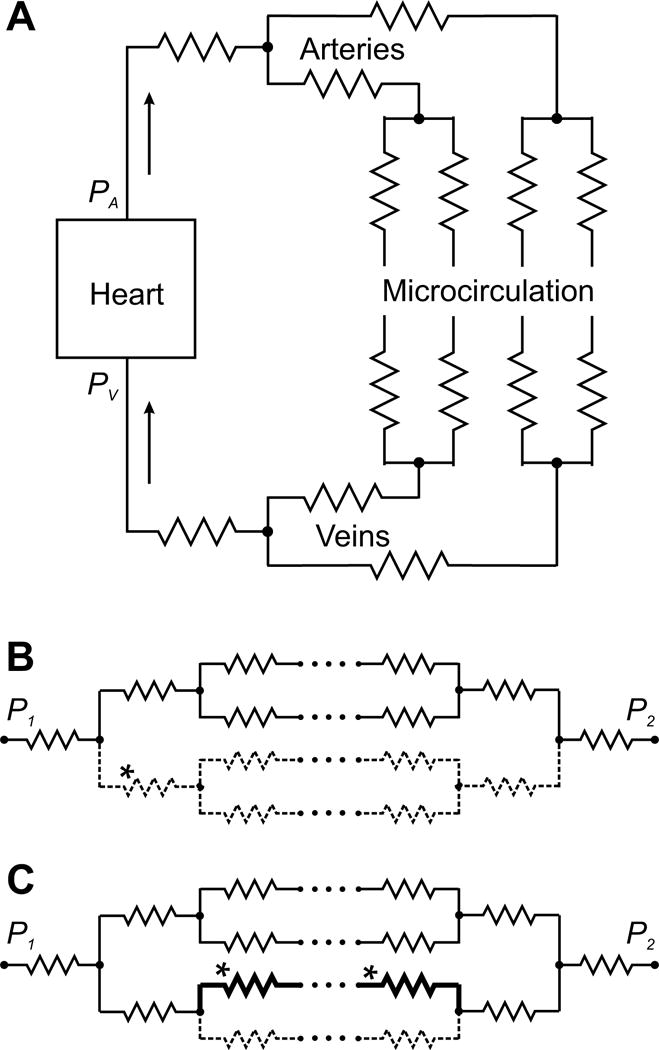
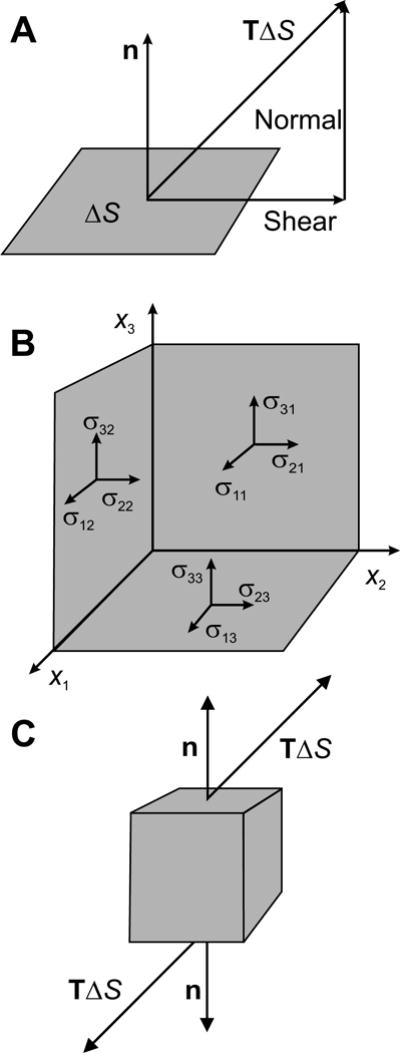
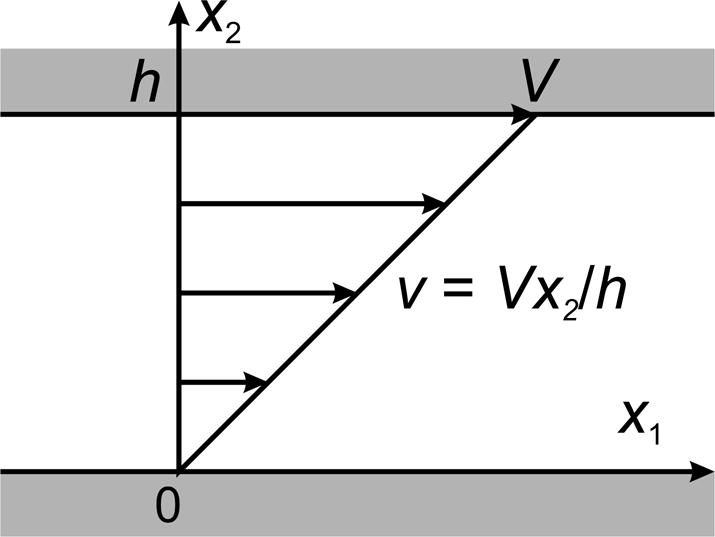
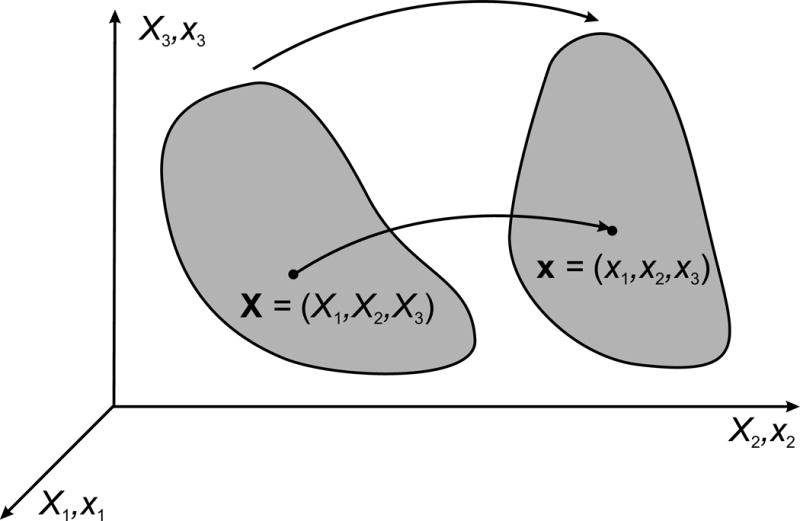
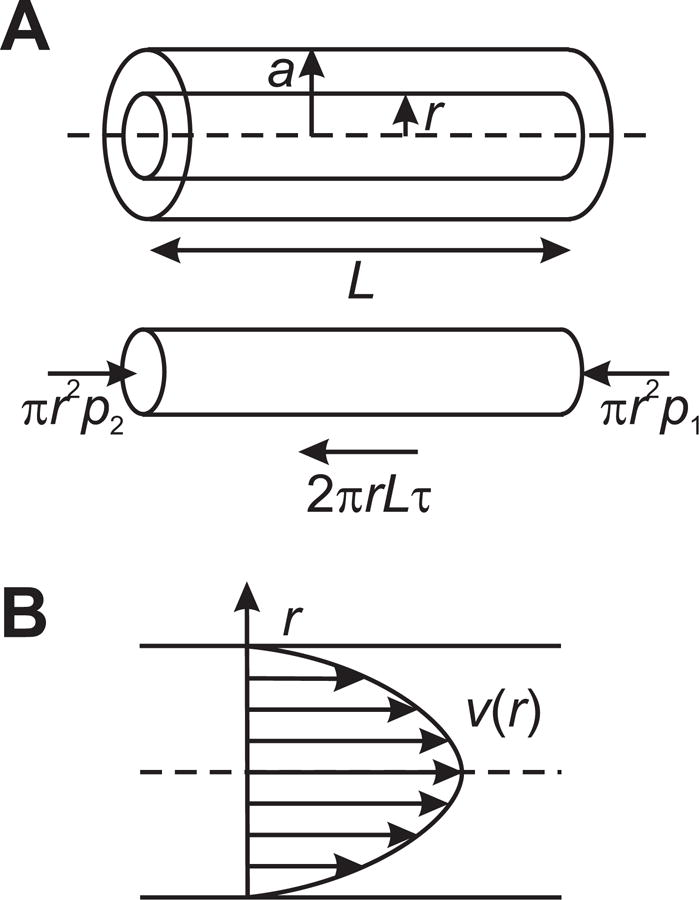
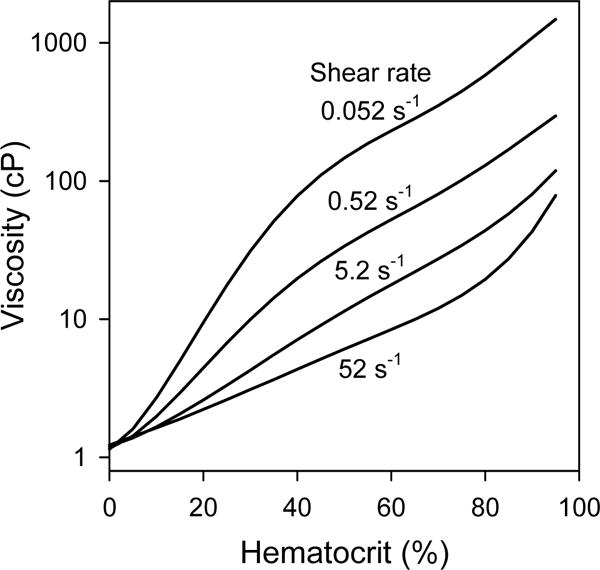
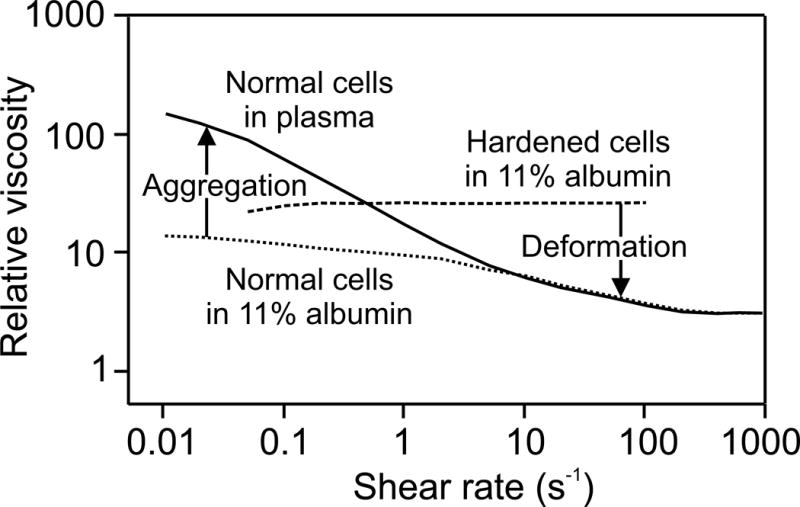
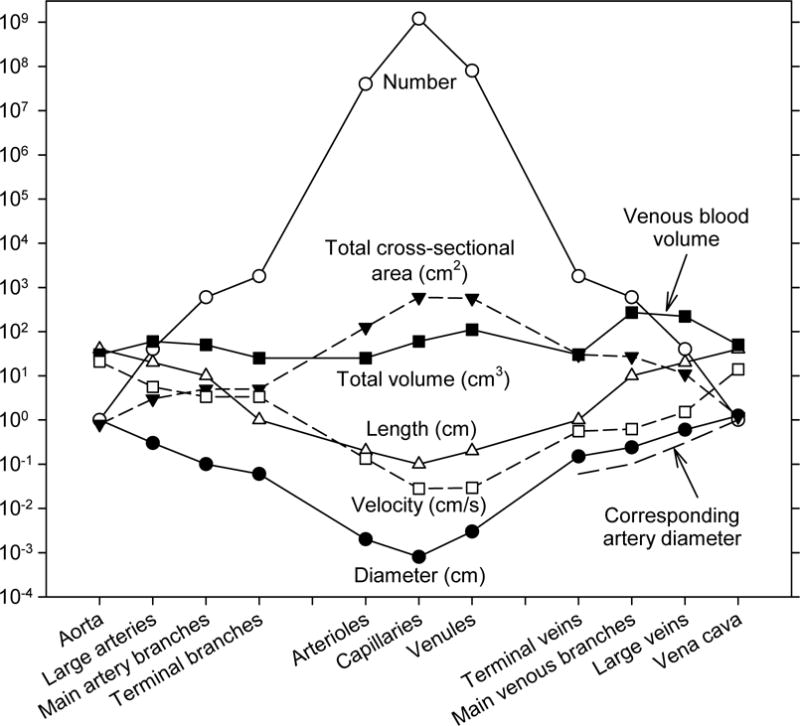
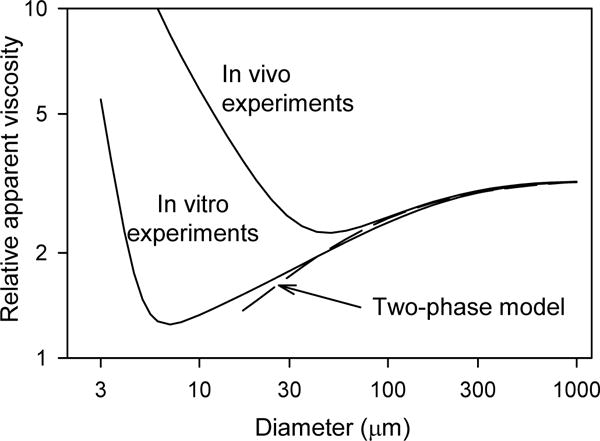
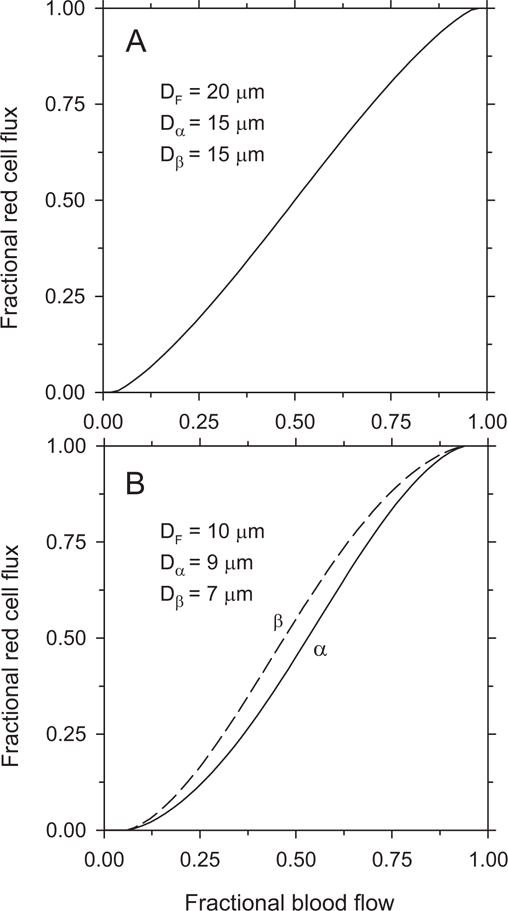
A review is presented of the physical principles governing the distribution of blood flow and blood pressure in the vascular system. The main factors involved are the pulsatile driving pressure generated by the heart, the flow characteristics of blood, and the geometric structure and mechanical properties of the vessels. The relationship between driving pressure and flow in a given vessel can be understood by considering the viscous and inertial forces acting on the blood. Depending on the vessel diameter and other physical parameters, a wide variety of flow phenomena can occur. In large arteries, the propagation of the pressure pulse depends on the elastic properties of the artery walls. In the microcirculation, the fact that blood is a suspension of cells strongly influences its flow properties and leads to a nonuniform distribution of hematocrit among microvessels. The forces acting on vessel walls include shear stress resulting from blood flow and circumferential stress resulting from blood pressure. Biological responses to these forces are important in the control of blood flow and the structural remodeling of vessels, and also play a role in major disease processes including hypertension and atherosclerosis. Consideration of hemodynamics is essential for a comprehensive understanding of the functioning of the circulatory system.


Figures

Figure 1
Figure 1
Schematic representation of the systemic circulation as a network of resistances. A. Basic elements of the systemic circulation. The pressure gradient between arterial pressure PA generated by the left heart and venous pressure PV drives blood through a network of blood vessels, consisting of the arteries, the microcirculation and the veins. Vascular segments are indicated by zigzag symbols, as in electrical circuits. The pulmonary circulation (not shown) has the same overall structure. B, C. Hemodynamic interactions within a network of resistances, with flow driven by a pressure difference P1P2. Arrays of dots signify additional levels of branching in the network. B. Increased flow resistance in one segment (*) (e.g. due to constriction or occlusion) causes a decrease in flow along all flow pathways containing that segment (dashed lines). C. Decreased flow resistance along one flow pathway (*) (e.g. due to formation of a shunt pathway) causes increased flow on that pathway (heavy black lines) but reduced flow on parallel pathways (dashed lines).
Figure 2
Figure 2
Illustration of concepts underlying the definition of the stress tensor in a material. A. The stress vector or traction T is defined as the force per unit area acting on a small surface ΔS in the material. In general, this vector has components parallel to the surface (shear force) and normal to the surface (normal force). B. The traction acting on an arbitrarily oriented surface can be fully described in terms of the stress tensor σ. Each component σij of the stress tensor represents the i component of the traction acting on a surface oriented perpendicular to the coordinate axis xj. C. The net force on a small cuboid of material resulting from a stress in the material is zero if the stress is uniform, because the traction vectors acting on opposite faces of the cuboid are equal and opposite. However, if the stress distribution is not uniform, the traction vectors do not cancel and a net force is generated.
Figure 3
Figure 3
Definition of simple shear flow of a fluid.
Figure 4
Figure 4
Coordinate systems used to describe the deformation of a body in continuum mechanics.
Figure 5
Figure 5
A. Definition of geometry and forces, used in derivation of Poiseuille’s law. B. Parabolic velocity profile in Poiseuille flow.
Figure 6
Figure 6
Dependence of the bulk viscosity of human blood on hematocrit, for indicated shear rates. Curves are derived from polynomial expressions given by Chien et al. (14), based on measurements using a coaxial-cylinder viscometer.
Figure 7
Figure 7
Dependence of the relative bulk viscosity on shear rate for three different types of red blood cell suspensions as described in the text. Vertical arrows indicate effect of aggregation to increase viscosity relative to non-aggregating cells at very low shear rates, and effect of deformation to decrease viscosity relative to rigid cells, an effect that increases with shear rate.
Figure 8
Figure 8
Dimensions and numbers of vessels of various classification in the canine vasculature, based on observations of the mesenteric vascular bed by Mall (7,60). Also included is an estimate of flow velocity in each type of segment, assuming a cardiac output of 2 l/min. Dashed lines at lower right hand side of figure indicate diameters of arteries corresponding to the veins of each classification, to show the difference in diameters between arteries and veins.
Figure 9
Figure 9
Intravascular pressure as a function of vessel diameter in different tissues and species. The “present data” refers to data obtained from mathematical model calculations for six mesenteric networks (82). The other data are from Zweifach (124), Gore (30), Richardson and Zweifach (90) and Fronek and Zweifach (26). Figure reproduced with permission from Pries et al. (82).
Figure 10
Figure 10
Analysis of stresses in a pressurized cylindrical tube. A. Thin-walled theory, for a segment of length L and radius r. Pressure forces acting on the wall (dashed arrows) must balance tension in the wall (solid arrows), implying the Law of Laplace, T = (pipo)r. B. Thick-walled theory. The balance of forces is applied to a thin cylindrical shell of radius r and thickness dr. See text for details.
Figure 11
Figure 11
Schematic illustration of the mechanics of pulse propagation in an artery. Graphs show spatial variation of pressure and flow rate. Large arrow shows direction of propagation. Gray area represents artery, and small arrows indicate local fluid velocities. A. Short high-pressure pulse propagating in positive x-direction. At the leading edge of the pulse, fluid is accelerated by the negative pressure gradient. This produces a negative spatial gradient of flow rate. By conservation of mass, fluid accumulates in this region, and wall must move outwards. At the trailing edge of the pulse, fluid is decelerated by the positive pressure gradient, producing a positive spatial gradient of flow rate, and inward wall movement. B. Short high-pressure pulse propagating in positive x-direction. Mechanism is as in A, but with reversed velocities. Note that an arbitrary (positive or negative) x-independent velocity can be superimposed on the indicated velocities without affecting the mechanism. The x-scale is greatly compressed here for illustrative purposes. In reality, the systolic pulse wave is much longer than the diameter (and the length) of the artery.
Figure 12
Figure 12
Analysis of wave propagation at an arterial bifurcation. An incident wave in branch zero gives rise to transmitted waves in branches 1 and 2 and a reflected wave in branch 0.
Figure 13
Figure 13
Sequences of velocity profiles in a tube with a sinusoidally varying pressure gradient, for indicated values of unsteadiness parameter α. Velocity profiles represent one half of a complete cycle of the oscillation. Bottom profile corresponds to moment of maximum pressure gradient.
Figure 14
Figure 14
Development of boundary layer (shaded area) in fluid entering a tube. Velocity profiles indicate approach to fully developed flow.
Figure 15
Figure 15
Sketch of flow phenomena occurring during steady flow in a human carotid artery bifurcation, based on observations in a transparent postmortem sample (68). Dashed lines indicate fluid streamlines. Curves across vessel diameters indicate local velocity profiles. Shaded area indicates region of flow separation, with separation point at the upstream end and reattachment point at the downstream end.
Figure 16
Figure 16
Two-phase model for blood flow in a microvessel, with radius a. A central core region containing red blood cells, with viscosity μc and radius λa, is surrounded by a cell-free or cell-depleted layer, with viscosity μp and width δ. A typical resulting velocity profile is shown.
Figure 17
Figure 17
Variation of apparent viscosity with tube diameter for hematocrit HD = 0.45. The lower solid curve represents an empirical fit to experimental in-vitro data (77). The upper solid curve represents the dependence deduced from in-vivo experiments (87). The dashed curve corresponds to a two-phase model with cell-free layer width 1.8 μm, as discussed in the text.
Figure 18
Figure 18
Red blood cell partition in diverging microvascular bifurcations. Curves giving red blood cell flux fraction in one branch as a function of overall flow fraction entering that branch are derived from empirically derived relationships as described in the text, assuming a discharge hematocrit of 0.4 in the parent vessel. Assumed diameters of parent vessel, DF, and branches, Dα and Dβ, are indicated on each plot. A. Symmetric bifurcation. B. Asymmetric bifurcation.

Similar articles

Cited by

References

    1. Alastruey J, Khir AW, Matthys KS, Segers P, Sherwin SJ, Verdonck PR, Parker KH, Peiro J. Pulse wave propagation in a model human arterial network: Assessment of 1-D visco-elastic simulations against in vitro measurements. J Biomech. 2011;44:2250–2258. - PMC - PubMed
    1. Asmar R, Rudnichi A, Blacher J, London GM, Safar ME. Pulse pressure and aortic pulse wave are markers of cardiovascular risk in hypertensive populations. Am J Hypertens. 2001;14:91–97. - PubMed
    1. Avolio AP, Van Bortel LM, Boutouyrie P, Cockcroft JR, McEniery CM, Protogerou AD, Roman MJ, Safar ME, Segers P, Smulyan H. Role of pulse pressure amplification in arterial hypertension: experts’ opinion and review of the data. Hypertension. 2009;54:375–383. - PubMed
    1. Batchelor GK. An Introduction to Fluid Mechanics. Cambridge University Press; 1967.
    1. Bertram CD, Butcher KS. Possible sources of discrepancy between sphygmomanometer cuff pressure and blood pressure quantified in a collapsible-tube analogue. J Biomech Eng. 1992;114:68–77. - PubMed

Publication types

LinkOut - more resources