Describing the Prevalence of Neural Tube Defects Worldwide: A Systematic Literature Review
- PMID: 27064786
- PMCID: PMC4827875
- DOI: 10.1371/journal.pone.0151586
Describing the Prevalence of Neural Tube Defects Worldwide: A Systematic Literature Review
Abstract
Background: Folate-sensitive neural tube defects (NTDs) are an important, preventable cause of morbidity and mortality worldwide. There is a need to describe the current global burden of NTDs and identify gaps in available NTD data.
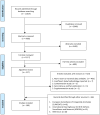
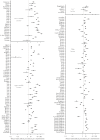
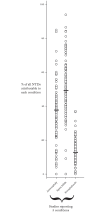
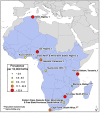
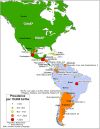
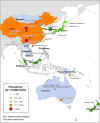
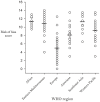
Methods and findings: We conducted a systematic review and searched multiple databases for NTD prevalence estimates and abstracted data from peer-reviewed literature, birth defects surveillance registries, and reports published between January 1990 and July 2014 that had greater than 5,000 births and were not solely based on mortality data. We classified countries according to World Health Organization (WHO) regions and World Bank income classifications. The initial search yielded 11,614 results; after systematic review we identified 160 full text manuscripts and reports that met the inclusion criteria. Data came from 75 countries. Coverage by WHO region varied in completeness (i.e., % of countries reporting) as follows: African (17%), Eastern Mediterranean (57%), European (49%), Americas (43%), South-East Asian (36%), and Western Pacific (33%). The reported NTD prevalence ranges and medians for each region were: African (5.2-75.4; 11.7 per 10,000 births), Eastern Mediterranean (2.1-124.1; 21.9 per 10,000 births), European (1.3-35.9; 9.0 per 10,000 births), Americas (3.3-27.9; 11.5 per 10,000 births), South-East Asian (1.9-66.2; 15.8 per 10,000 births), and Western Pacific (0.3-199.4; 6.9 per 10,000 births). The presence of a registry or surveillance system for NTDs increased with country income level: low income (0%), lower-middle income (25%), upper-middle income (70%), and high income (91%).
Conclusions: Many WHO member states (120/194) did not have any data on NTD prevalence. Where data are collected, prevalence estimates vary widely. These findings highlight the need for greater NTD surveillance efforts, especially in lower-income countries. NTDs are an important public health problem that can be prevented with folic acid supplementation and fortification of staple foods.
Conflict of interest statement
Figures






Similar articles
-
Folic acid supplementation and malaria susceptibility and severity among people taking antifolate antimalarial drugs in endemic areas.Cochrane Database Syst Rev. 2022 Feb 1;2(2022):CD014217. doi: 10.1002/14651858.CD014217. Cochrane Database Syst Rev. 2022. PMID: 36321557 Free PMC article.
-
Reducing inequities in preventable neural tube defects: the critical and underutilized role of neurosurgical advocacy for folate fortification.Neurosurg Focus. 2018 Oct;45(4):E20. doi: 10.3171/2018.7.FOCUS18231. Neurosurg Focus. 2018. PMID: 30269587 Free PMC article.
-
Estimates of global and regional prevalence of neural tube defects for 2015: a systematic analysis.Ann N Y Acad Sci. 2018 Feb;1414(1):31-46. doi: 10.1111/nyas.13548. Epub 2018 Jan 24. Ann N Y Acad Sci. 2018. PMID: 29363759
-
Folic acid to reduce neonatal mortality from neural tube disorders.Int J Epidemiol. 2010 Apr;39 Suppl 1(Suppl 1):i110-21. doi: 10.1093/ije/dyq028. Int J Epidemiol. 2010. PMID: 20348114 Free PMC article. Review.
-
Impact of folic acid fortification of flour on neural tube defects: a systematic review.Public Health Nutr. 2013 May;16(5):901-11. doi: 10.1017/S1368980012003576. Epub 2012 Jul 31. Public Health Nutr. 2013. PMID: 22850218 Free PMC article. Review.
Cited by
-
Global birth defects app: An innovative tool for describing and coding congenital anomalies at birth in low resource settings.Birth Defects Res. 2021 Aug 15;113(14):1057-1073. doi: 10.1002/bdr2.1898. Epub 2021 May 5. Birth Defects Res. 2021. PMID: 33949803 Free PMC article.
-
Pathogenesis of neural tube defects: The regulation and disruption of cellular processes underlying neural tube closure.WIREs Mech Dis. 2022 Sep;14(5):e1559. doi: 10.1002/wsbm.1559. Epub 2022 May 3. WIREs Mech Dis. 2022. PMID: 35504597 Free PMC article. Review.
-
Potentially harmful medication use and the associated factors among pregnant women visiting antenatal care clinics in Mbarara Regional Referral Hospital, Southwestern Uganda.J Clin Transl Res. 2022 Dec 28;9(1):16-25. eCollection 2023 Feb 25. J Clin Transl Res. 2022. PMID: 36687297 Free PMC article.
-
Point-of-Care Quantification of Serum Alpha-Fetoprotein for Screening Birth Defects in Resource-Limited Settings: Proof-of-Concept Study.JMIR Biomed Eng. 2021 Jan-Mar;6(1):e23527. doi: 10.2196/23527. Epub 2020 Aug 14. JMIR Biomed Eng. 2021. PMID: 34746648 Free PMC article.
-
Posterior axis formation requires Dlx5/Dlx6 expression at the neural plate border.PLoS One. 2019 Mar 19;14(3):e0214063. doi: 10.1371/journal.pone.0214063. eCollection 2019. PLoS One. 2019. PMID: 30889190 Free PMC article.
References
-
- Christianson AL, Howson CP, Modell B. Global report on birth defects: the hidden toll of dying and disabled children. White Plains (NY): March of Dimes Birth Defects Foundation; 2006.
-
- World Health Organization. Global health estimates (GHE)–Cause-specific mortality. 2015. Available:http://www.who.int/healthinfo/global_burden_disease/estimates/en/index1..... Accessed 2015 Apr 14.
-
- World Health Organization. Global health estimates (GHE)–Disease burden. 2015. Available: http://www.who.int/healthinfo/global_burden_disease/estimates/en/index2..... Accessed 2015 Apr 14.
-
- Rudan I, Chan KY, Zhang JS, Theodoratou E, Feng XL, Salomon JA, et al. Causes of deaths in children younger than 5 years in China in 2008. The Lancet. 2010; 375: 1083–1089. - PubMed
Publication types
MeSH terms
Grants and funding
LinkOut - more resources
Full Text Sources
Other Literature Sources
Medical
Miscellaneous

