

Enhancer-promoter interactions are encoded by complex genomic signatures on looping chromatin
- PMID: 27064255
- PMCID: PMC4910881
- DOI: 10.1038/ng.3539
Enhancer-promoter interactions are encoded by complex genomic signatures on looping chromatin
Abstract
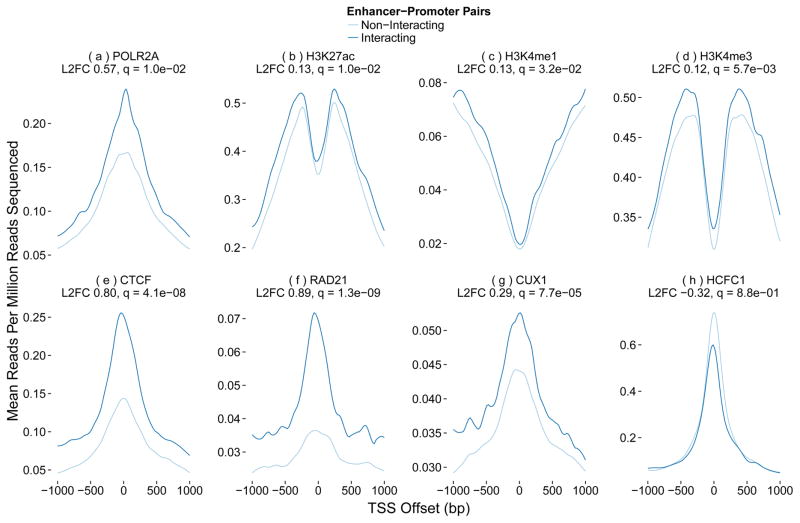
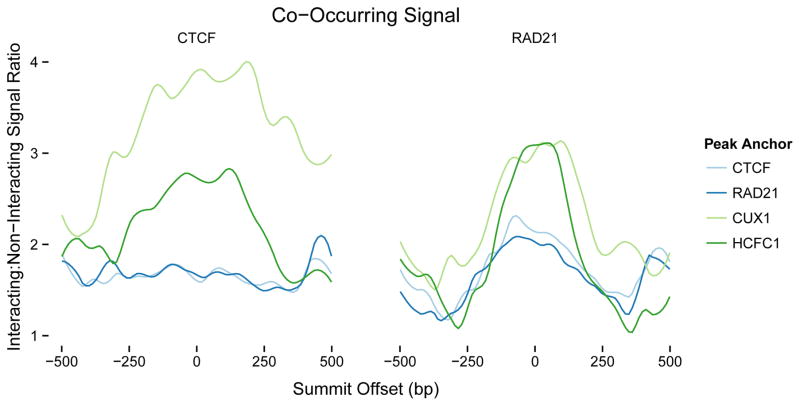
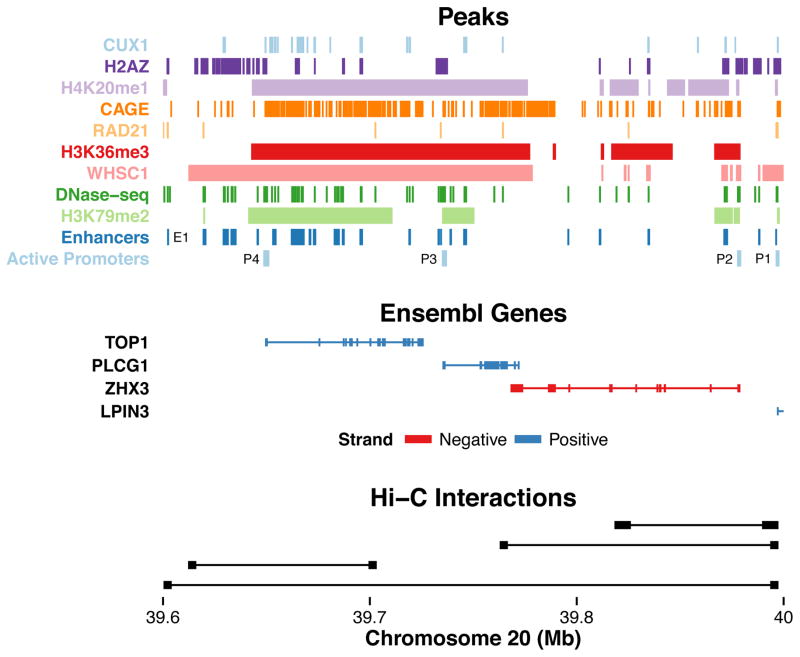
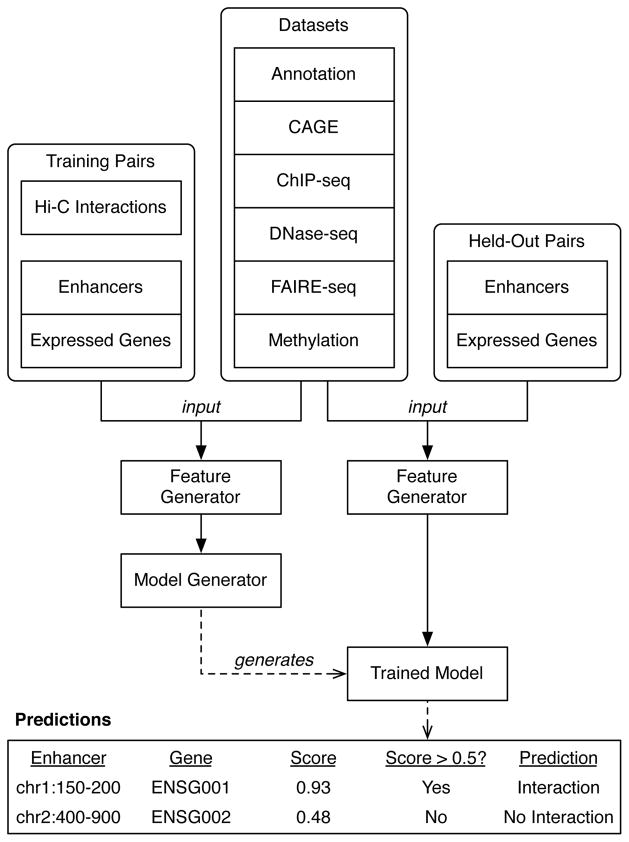
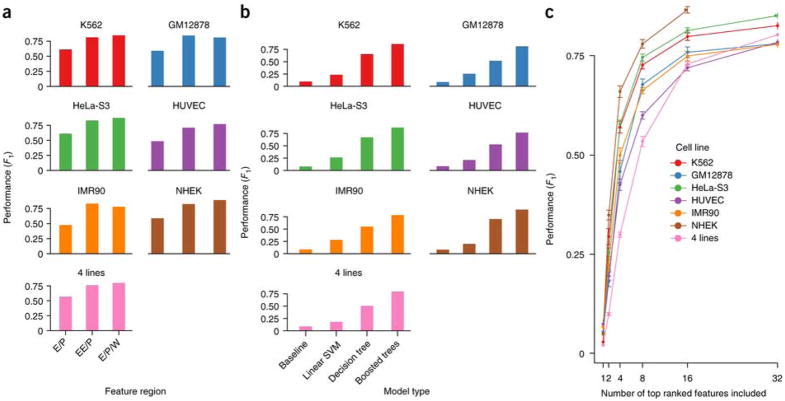
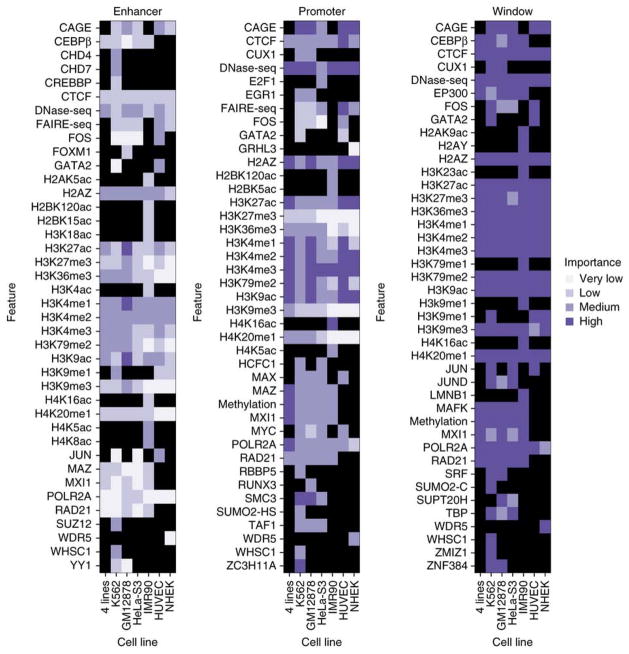
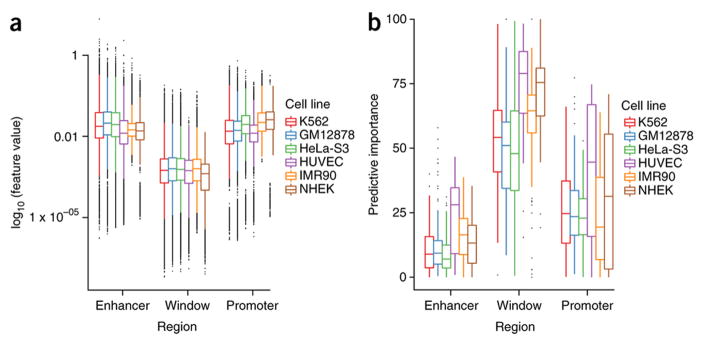
Discriminating the gene target of a distal regulatory element from other nearby transcribed genes is a challenging problem with the potential to illuminate the causal underpinnings of complex diseases. We present TargetFinder, a computational method that reconstructs regulatory landscapes from diverse features along the genome. The resulting models accurately predict individual enhancer-promoter interactions across multiple cell lines with a false discovery rate up to 15 times smaller than that obtained using the closest gene. By evaluating the genomic features driving this accuracy, we uncover interactions between structural proteins, transcription factors, epigenetic modifications, and transcription that together distinguish interacting from non-interacting enhancer-promoter pairs. Most of this signature is not proximal to the enhancers and promoters but instead decorates the looping DNA. We conclude that complex but consistent combinations of marks on the one-dimensional genome encode the three-dimensional structure of fine-scale regulatory interactions.
Conflict of interest statement
Competing interests
The authors declare that they have no competing interests.
Figures
Comment in
-
Gene regulation: Finding genetic target sites.Nat Rev Genet. 2016 Jun;17(6):314-5. doi: 10.1038/nrg.2016.53. Epub 2016 Apr 18. Nat Rev Genet. 2016. PMID: 27087501 No abstract available.
-
Connecting the regulatory genome.Nat Genet. 2016 Apr 27;48(5):479-80. doi: 10.1038/ng.3553. Nat Genet. 2016. PMID: 27120444
-
Reply to 'Inflated performance measures in enhancer-promoter interaction-prediction methods'.Nat Genet. 2019 Aug;51(8):1198-1200. doi: 10.1038/s41588-019-0473-0. Nat Genet. 2019. PMID: 31332377 No abstract available.
-
Inflated performance measures in enhancer-promoter interaction-prediction methods.Nat Genet. 2019 Aug;51(8):1196-1198. doi: 10.1038/s41588-019-0434-7. Nat Genet. 2019. PMID: 31332378 No abstract available.
Similar articles
-
Three-dimensional genome architectural CCCTC-binding factor makes choice in duplicated enhancers at Pcdhα locus.Sci China Life Sci. 2020 Jun;63(6):835-844. doi: 10.1007/s11427-019-1598-4. Epub 2020 Apr 2. Sci China Life Sci. 2020. PMID: 32249388
-
Chromatin loops as allosteric modulators of enhancer-promoter interactions.PLoS Comput Biol. 2014 Oct 23;10(10):e1003867. doi: 10.1371/journal.pcbi.1003867. eCollection 2014 Oct. PLoS Comput Biol. 2014. PMID: 25340767 Free PMC article.
-
A predictive modeling approach for cell line-specific long-range regulatory interactions.Nucleic Acids Res. 2015 Oct 15;43(18):8694-712. doi: 10.1093/nar/gkv865. Epub 2015 Sep 3. Nucleic Acids Res. 2015. PMID: 26338778 Free PMC article.
-
Coming full circle: On the origin and evolution of the looping model for enhancer-promoter communication.J Biol Chem. 2022 Aug;298(8):102117. doi: 10.1016/j.jbc.2022.102117. Epub 2022 Jun 9. J Biol Chem. 2022. PMID: 35691341 Free PMC article. Review.
-
Enhancers and chromatin structures: regulatory hubs in gene expression and diseases.Biosci Rep. 2017 Apr 28;37(2):BSR20160183. doi: 10.1042/BSR20160183. Print 2017 Apr 30. Biosci Rep. 2017. PMID: 28351896 Free PMC article. Review.
Cited by
-
Comparative Methylome Analyses Identify Epigenetic Regulatory Loci of Human Brain Evolution.Mol Biol Evol. 2016 Nov;33(11):2947-2959. doi: 10.1093/molbev/msw176. Epub 2016 Aug 25. Mol Biol Evol. 2016. PMID: 27563052 Free PMC article.
-
A machine learning framework for the prediction of chromatin folding in Drosophila using epigenetic features.PeerJ Comput Sci. 2020 Nov 30;6:e307. doi: 10.7717/peerj-cs.307. eCollection 2020. PeerJ Comput Sci. 2020. PMID: 33816958 Free PMC article.
-
Prediction of Enhancer-Gene Interactions Using Chromatin-Conformation Capture and Epigenome Data Using STARE.Methods Mol Biol. 2025;2856:327-339. doi: 10.1007/978-1-0716-4136-1_20. Methods Mol Biol. 2025. PMID: 39283462
-
Regulatory de novo mutations underlying intellectual disability.Life Sci Alliance. 2023 Feb 28;6(5):e202201843. doi: 10.26508/lsa.202201843. Print 2023 May. Life Sci Alliance. 2023. PMID: 36854624 Free PMC article.
-
PINES: phenotype-informed tissue weighting improves prediction of pathogenic noncoding variants.Genome Biol. 2018 Oct 25;19(1):173. doi: 10.1186/s13059-018-1546-6. Genome Biol. 2018. PMID: 30359302 Free PMC article.
References
Publication types
MeSH terms
Substances
Grants and funding
LinkOut - more resources
Full Text Sources
Other Literature Sources
