. 2016 Apr 5:6:23894.
doi: 10.1038/srep23894.

Molecular Interactions between Tarantula Toxins and Low-Voltage-Activated Calcium Channels

Affiliations

Molecular Interactions between Tarantula Toxins and Low-Voltage-Activated Calcium Channels

Autoosa Salari et al. Sci Rep. .

Abstract

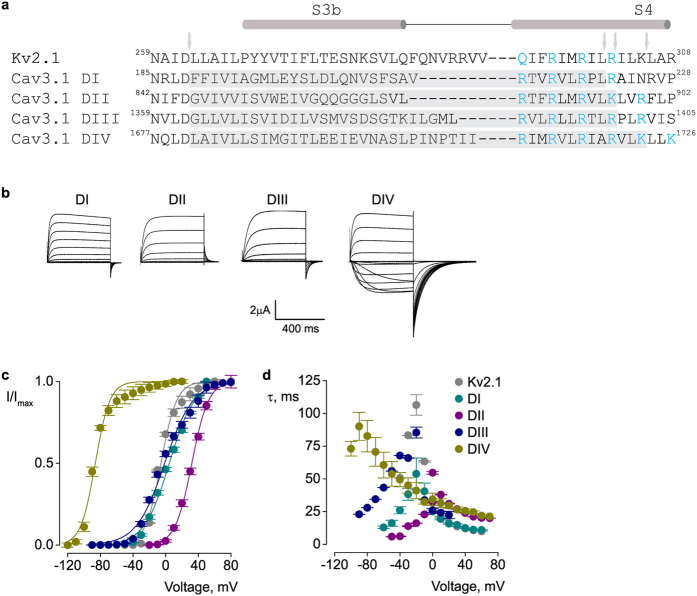
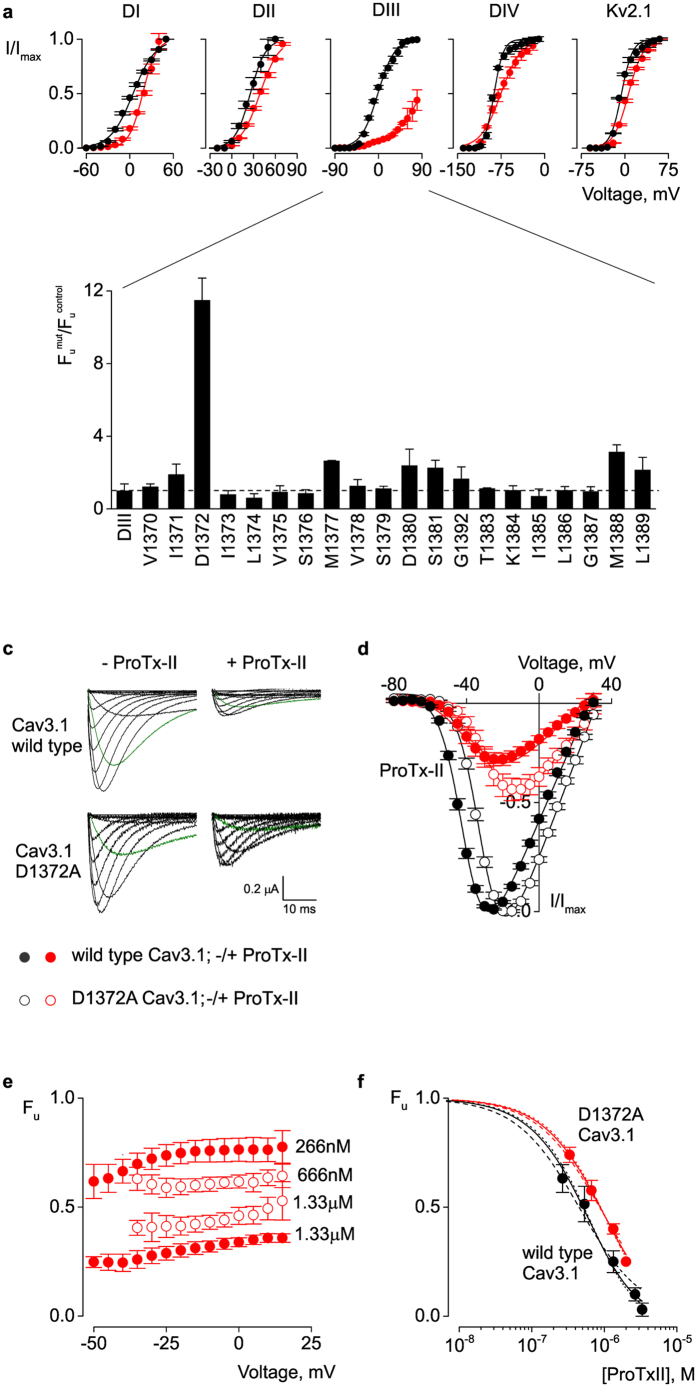
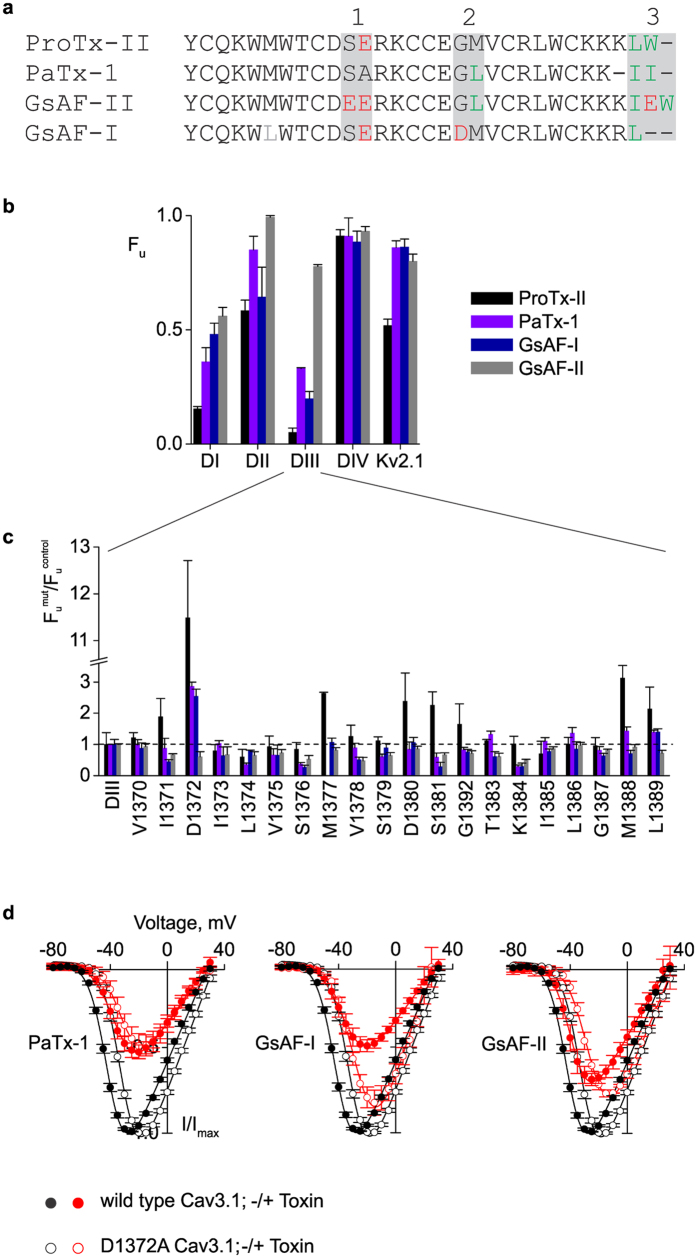
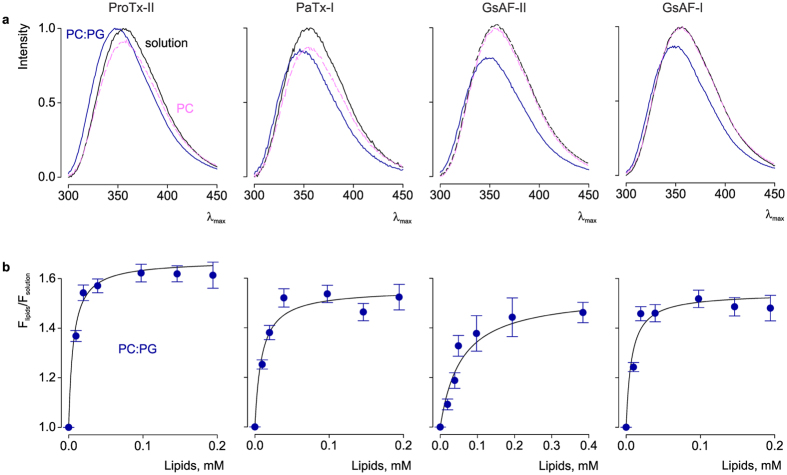
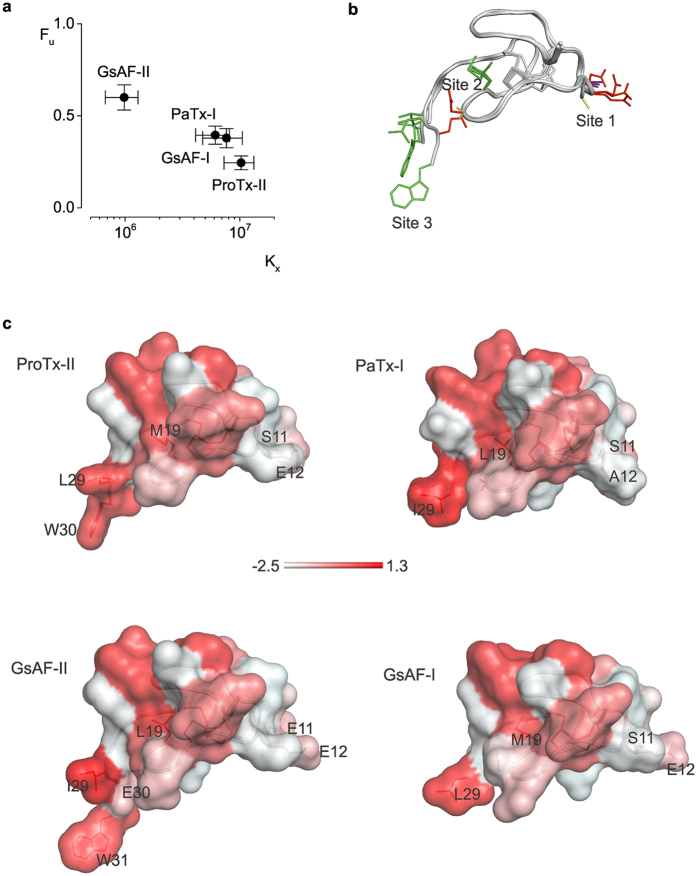
Few gating-modifier toxins have been reported to target low-voltage-activated (LVA) calcium channels, and the structural basis of toxin sensitivity remains incompletely understood. Studies of voltage-gated potassium (Kv) channels have identified the S3b-S4 "paddle motif," which moves at the protein-lipid interface to drive channel opening, as the target for these amphipathic neurotoxins. Voltage-gated calcium (Cav) channels contain four homologous voltage sensor domains, suggesting multiple toxin binding sites. We show here that the S3-S4 segments within Cav3.1 can be transplanted into Kv2.1 to examine their individual contributions to voltage sensing and pharmacology. With these results, we now have a more complete picture of the conserved nature of the paddle motif in all three major voltage-gated ion channel types (Kv, Nav, and Cav). When screened with tarantula toxins, the four paddle sequences display distinct toxin binding properties, demonstrating that gating-modifier toxins can bind to Cav channels in a domain specific fashion. Domain III was the most commonly and strongly targeted, and mutagenesis revealed an acidic residue that is important for toxin binding. We also measured the lipid partitioning strength of all toxins tested and observed a positive correlation with their inhibition of Cav3.1, suggesting a key role for membrane partitioning.


Figures

Figure 1
Figure 1. Paddle motifs in Cav3.1 voltage-sensor domains.
(a) Sequence alignment of the paddle region of Kv2.1 and S3–S4 regions of the four Cav3.1 domains (DI–DIV). The conserved charged residues involved in voltage-sensing are shown in blue. Grey regions and arrows indicate the sequences that were swapped between the two channels to create paddle chimaeras. The numbers correspond to the amino acid residues within the parent channel. (b) Potassium currents for Cav3.1/Kv2.1 chimaeras. (c) Voltage-activation data and Boltzmann fits for Kv2.1 and Cav3.1/Kv2.1 paddle chimaeras. Conductance was determined from normalized tail currents. V1/2 values are (mV): 4.4 ± 0.9 (DI), 25.5 ± 0.7 (DII), 1.3 ± 1 (DIII), −87.1 ± 1 (DIV), and −5.8 ± 1 (Kv2.1). (d) Time constants (τ) of activation and deactivation determined from single exponential fits at each voltage. Data shown in (b–d) were obtained with the following voltage-step protocol: holding voltage −100 mV (Kv2.1 and DI-DIII) or −120 mV (DIV); test pulse duration 500 ms; tail voltage −60 mV (Kv2.1, DI and DIII), −10 mV (DII), or −120 mV (DIV). I/Imax (c) is the normalized tail current amplitude. In all panels, data points are mean ± SEM (n = 6).
Figure 2
Figure 2. ProTx-II binding sites on Cav3.1 voltage-sensors.
(a) Voltage-activation data and Boltzmann fits in the absence (black) and presence (red) of 1.33 μM ProTx-II for Kv2.1 and Cav3.1/Kv2.1 chimaeras. I/Imax is the normalized tail current amplitude. In the presence of toxin, the V1/2 values are (mV): 17.7 ± 1.8 (DI), 38.8 ± 0.7 (DII), 75.4 ± 1.4 (DIV), 6.3 ± 1 (Kv2.1). A meaningful fit could not be obtained for DIII. (b) Alanine scan of DIII chimaera. Fraction of uninhibited current in the presence of 1.33 μM ProTx-II for alanine mutants (Fumut) normalized to DIII construct (Fucontrol). (c) Barium currents for wild type and D1372A Cav3.1 channels in the absence (left) and presence (right) of 1.33 μM ProTx-II. Current elicited at −40 mV is highlighted in green. (d) Voltage-activation relationships for wild type (solid circles) and D1372A Cav3.1 (open circles) in the absence (black) and presence (red) of 1.33 μM ProTx-II. Curves are Boltzmann fits with V1/2 values of −41 ± 0.4 mV and −31 ± 0.3 mV for wild type and D1372A channels, respectively, in the absence of toxin; and −34 ± 1 mV and −25 ± 1 mV, in the presence of toxin. (e) Fraction of uninhibited current of wild type (solid circles) and D1372 (open circles) Cav3.1 channels in the presence of two ProTx-II concentrations. (f) Dose-response data and fit curves for wild type (solid circles) and D1372A (open circles) channels. Data were fit with both n and Kd as free parameters (solid lines), or with Kd as free parameter and n constrained to 1 (dashed lines), 2, or 3 (dotted lines). With two free parameters, the best fit values are Kd = 1.30 ± 0.6 μM and n = 2.11 ± 0.8 for wild type, and Kd = 1.44 ± 0.3 μM and n = 1.45 ± 0.25 for D1372A. Fu was calculated at −40 mV for the wild type and −30 mV for the mutant channel. In all panels, data points are mean ± SEM (n = 6).
Figure 3
Figure 3. Tarantula toxins effects on Cav3.1 and Cav3.1/Kv2.1 chimaeras.
(a) Sequence alignment of ProTx-II and three tarantula gating-modifier toxins. Regions of amino acid differences (sites 1–3) are highlighted in grey. Acidic residues are shown in red and hydrophobic residues in green. (b) Relative affinity of toxins for Kv2.1 and Cav3.1/Kv2.1 chimaeras. Data points are mean ± SEM (n = 6–9). (c) Alanine scan of DIII chimaera. Fraction of uninhibited current in the presence of ProTx-II, PaTx-1, GsAF-I, and GsAF-II for alanine mutants (Fumut) normalized to DIII construct (Fucontrol). Data points are mean ± SEM (n = 3–6). (d) Voltage-activation data and Boltzmann fits for wild type (solid circles) and D1372A (open circles) Cav3.1 channels, in the absence (black, same data as in Fig. 2d) and presence (red) of PaTx-1, GsAF-I, and GsAF-II. V1/2 values are −35 ± 0.7 mV, −34 ± 0.6 mV, and −38 ± 0.5 mV for the wild type channel, and −31 ± 0.6 mV, −25 ± 0.8 mV, and −25 ± 0.8 mV for the D1372A channel. Toxin concentration was 1.33 μM. Data points are mean ± SEM (n = 6).
Figure 4
Figure 4. Interaction of tarantula toxins with lipid vesicles.
(a) Intrinsic tryptophan fluorescence emission spectra of toxins in the absence (black) and presence of lipid vesicles composed of 1-palmitoyl-2-oleoyl-sn-glycero-3-phosphocholine (PC; pink) or a 1:1 ratio of 1-palmitoyl-2-oleoyl-sn-glycero-3-phosphocholine and 1-palmitoyl-2oleoyl-sn-glycero-3-[phosphor-rac-(1-glycerol) (PC:PG; blue). The lipid concentration was 1.5 mM. (b) Fluorescence intensity at 320 nm plotted vs. available lipid concentration (60% of total lipids). Curves are partition function fits with Kx = 10 ± 3 × 106 and Flipids/Fsolution = 1.65 ± 0.02 for ProTx-II; Kx = 6.1 ± 2 × 106 and Flipids/Fsolution = 1.32 ± 0.02 for PaTx-I; Kx = 9.8 ± 3 × 105 and Flipids/Fsolution = 1.53 ± 0.05 for GsAF-II, Kx = 7.6 ± 2 × 106 and Flipids/Fsolution = 1.27 ± 0.02 for GsAF-I. In all panels, data points are mean ± SEM (n = 3).
Figure 5
Figure 5. Comparison of related toxins on Cav3.1 inhibition and membrane partitioning strength.
(a) Cav3.1 inhibition vs. strength of membrane partitioning. (b) ProTx-II, PaTx-1, GsAF-I, and GsAF-II structures superimposed based on their backbone fold. Side chains of residues within sites 1–3 are colored red (acidic), green (hydrophobic), purple (serine), and yellow (glycine and alanine). (c) Toxin surface profiles, colored based on the normalized Eisenberg hydrophobicity scale. The most hydrophobic residues are in red, following a color gradient to the most hydrophilic residues in white.

Similar articles

Cited by

References

    1. Catterall W. A. Voltage-gated calcium channels. Cold Spring Harbor perspectives in biology 3, a003947, 10.1101/cshperspect.a003947 (2011). - DOI - PMC - PubMed
    1. Perez-Reyes E. et al. Molecular characterization of a neuronal low-voltage-activated T-type calcium channel. Nature 391, 896–900, 10.1038/36110 (1998). - DOI - PubMed
    1. Pantazis A., Savalli N., Sigg D., Neely A. & Olcese R. Functional heterogeneity of the four voltage sensors of a human L-type calcium channel. Proceedings of the National Academy of Sciences of the United States of America 111, 18381–18386, 10.1073/pnas.1411127112 (2014). - DOI - PMC - PubMed
    1. Jiang Y., Ruta V., Chen J., Lee A. & MacKinnon R. The principle of gating charge movement in a voltage-dependent K+ channel. Nature 423, 42–48, 10.1038/nature01581 (2003). - DOI - PubMed
    1. Lee S. Y., Lee A., Chen J. & MacKinnon R. Structure of the KvAP voltage-dependent K+ channel and its dependence on the lipid membrane. Proceedings of the National Academy of Sciences of the United States of America 102, 15441–15446, 10.1073/pnas.0507651102 (2005). - DOI - PMC - PubMed

Publication types

MeSH terms

LinkOut - more resources