. 2016 Apr 19;113(16):4302-7.
doi: 10.1073/pnas.1602244113. Epub 2016 Apr 4.

Mass-tag labeling reveals site-specific and endogenous levels of protein S-fatty acylation

Affiliations

Mass-tag labeling reveals site-specific and endogenous levels of protein S-fatty acylation

Avital Percher et al. Proc Natl Acad Sci U S A. .

Abstract

Fatty acylation of cysteine residues provides spatial and temporal control of protein function in cells and regulates important biological pathways in eukaryotes. Although recent methods have improved the detection and proteomic analysis of cysteine fatty (S-fatty) acylated proteins, understanding how specific sites and quantitative levels of this posttranslational modification modulate cellular pathways are still challenging. To analyze the endogenous levels of protein S-fatty acylation in cells, we developed a mass-tag labeling method based on hydroxylamine-sensitivity of thioesters and selective maleimide-modification of cysteines, termed acyl-PEG exchange (APE). We demonstrate that APE enables sensitive detection of protein S-acylation levels and is broadly applicable to different classes of S-palmitoylated membrane proteins. Using APE, we show that endogenous interferon-induced transmembrane protein 3 is S-fatty acylated on three cysteine residues and site-specific modification of highly conserved cysteines are crucial for the antiviral activity of this IFN-stimulated immune effector. APE therefore provides a general and sensitive method for analyzing the endogenous levels of protein S-fatty acylation and should facilitate quantitative studies of this regulated and dynamic lipid modification in biological systems.

Keywords: IFITM3; PEGylation; fatty-acylation; influenza virus; palmitoylation.


Conflict of interest statement

The authors declare no conflict of interest.

Figures

Fig. 1.
Fig. 1.
Mass-tag analysis of protein S-fatty acylation. (A) S-fatty acylation controls the trafficking, stability, and function of membrane proteins and are regulated by DHHC-protein acyltransferases (DHHC-PATs), and esterases. (B) With APE, cell lysates are reduced with TCEP, and then free cysteine residues are capped with NEM. S-fatty acid groups are removed by NH2OH, and the exposed cysteines are reacted with mPEG-Mal. Proteins are separated by SDS/PAGE and analyzed by Western blot, enabling the detection of both unmodified and S-fatty acylated proteins.
Fig. S1.
Fig. S1.
Methods for protein S-fatty acylation analysis. (A) For metabolic labeling, cells are incubated with alkyne-labeled palmitate (alk-16). Proteins are reacted with an azide-functionalized reagents by CuAAC and analyzed by in-gel fluorescence, as previously described (1). (B) For ABE, cell lysates are reduced with TCEP, cysteines labeled with NEM. Thioesters are then cleaved with NH2OH and newly generated cysteines are reacted with HPDP-Biotin, as previously described (2). Following streptavidin bead enrichment, selectively captured proteins are then eluted with reducing agents and then analyzed by Western blot. (C) In acyl-RAC exchange, cell lysates are prepared similarly to ABE but reacted with activated thiol-Sepharose beads, instead of HPDP-Biotin. Selectively captured proteins are then eluted with reducing agents and then analyzed by Western blot.
Fig. 2.
Fig. 2.
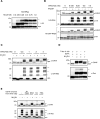
APE enables robust detection of protein S-fatty acylation levels. (A) HEK293T transfected with HA-HRas were lysed and total cell lysates were subjected to APE with NEM (25 mM), NH-2OH (0.75 M), and mPEG-Mal (1 mM), and compared with negative controls. Samples were analyzed by Western blot using anti-HA and anti-CANX antibodies. The number of PEGylation events are indicated by asterisks (*). Apo refers to non-PEGylated protein. (B) HeLa cells were subjected to APE and endogenous Ras palmitoylation measured by Western blot with a pan-Ras antibody. (C) HEK293T cells expressing HA-tagged WT or palmitoylation-deficient (P△) constructs (HRas C181,184S; IRGM1 C371, -373, -374, -375A; mIFITM3 C71, -72, -105A; CD9 C9, -78, -79, -87, -218, -219A) of known S-palmitoylated proteins were analyzed with the APE. Representative of multiple experiments for all constructs.
Fig. S2.
Fig. S2.
Optimization of APE conditions. HEK293T cells overexpressing wild-type HA-HRas were analyzed with the APE, with different concentrations of (A) NH2OH, with 1-h incubation, and (B) 5 kDa mPEG-Mal with 2-h incubation. HA-GFP-Rab7, a prenylated endosome membrane marker demonstrates a NH2OH independent mass shift, emphasizing the importance of NH2OH controls for initial optimization. The number of PEGylation events are indicated by asterisks (*). (C) To ensure the complete mass shift of CANX and IFITM3, a higher range of mPEG-Mal concentrations were titrated with 2-h incubation. (D) Alkylation with mPEG-Mal without 0.2% Triton X-100 or EDTA reveals that, EDTA but not the detergent is essential for completion of the di-PEGylation (**) for both CANX and Ras. (E) EDTA is critical during treatment with NH2OH. HEK293T cells were analyzed by APE, and EDTA removed from individual stages of the protocol.
Fig. S3.
Fig. S3.
Comparison of NH2OH-mediated protein S-acylation detection methods. (A) Aliquots from the same Raw264.7 macrophage lysate were analyzed with the APE, ABE, and the acyl-RAC assay; representative of triplicate. Flow-through was further incubated with mPEG-mal to detect if ABE or acyl-RAC failed to enrich a portion of S-acylated proteins. (B) Comparison of APE with PSA in HEK293T cells. To test whether NH2OH interferes with the cysteine labeling of mPEG-Mal, NH2OH was incubated either separately, or together with mPEG-Mal (as described in the PSA protocol) for the duration of the reported mPEG-Mal incubation. The number of PEGylation events are indicated by asterisks (*). NT, not treated. Completion of APE is dependent on separation of thioester cleavage from PEGylation and inclusion of EDTA. PSA was performed as described, unless otherwise noted (3).
Fig. 3.
Fig. 3.
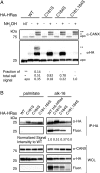
APE reveals site-specific S-fatty acylation levels. (A) HEK293T cells transfected with HA-HRas wild-type or cysteine mutants were labeled for 2 h with 50 μM alk-16 in DMEM containing charcoal-dextran–treated FBS. Samples were lysed, subjected to APE, separated by SDS/PAGE, and analyzed by Western blot. NT refers to nontreated control. The number of PEGylation events are indicated by asterisks (*). (B) Samples from the same cell lysate as in A were immunoprecipitated with anti-HA agarose-beads, and reacted with azide-rhodamine (az-rho) by Cu(I)-catalyzed azide-alkyne cycloaddition (CuAAC). Whole-cell lysate (WCL) was reacted with az-rho by CuAAC and included for comparison. Samples were separated by SDS/PAGE and analyzed by in-gel fluorescence and Western blot.
Fig. 4.
Fig. 4.
Murine IFITM3 S-fatty acylation levels, sites of modification and antiviral activity. (A) NIH 3T3 or Raw264.7 macrophages were activated with 500 ng/mL LPS, 100 U/mL IFN-γ for 16 h, subjected to APE, and analyzed by Western blot. (B) NIH 3T3 cells transfected with WT HA-mIFITM3, or Cys to Ala mutant constructs were subjected to APE and analyzed by Western blot. The number of PEGylation events are indicated by asterisks (*). Analysis of whole-cell lysate (WCL) indicates levels of protein expression without APE. (C) NIH 3T3 cells transfected with HA-mIFITM3 constructs were metabolically labeled for 2 h with 50 μM alk-16. Cell lysates prepared with 1% Brij 97 were subjected to immunoprecipitation with anti-HA agarose-beads, reacted with az-rho by CuAAC, separated by SDS/PAGE, and visualized by fluorescence gel scanning. Comparable protein loading was confirmed by anti-HA Western blotting. (D) NIH 3T3 cells were transfected with HA-mIFITM3 constructs, followed by infection with PR8 influenza virus at a multiplicity of infection of 5 for 18 h. Cells were fixed, permeabilized with 0.1% Triton X-100, and stained with anti-influenza NP antibody and analyzed by flow cytometry. Graph shows anti-influenza NP+ cells for each condition; average of triplicate. Error bar represents SEM, n = 3.
Fig. S4.
Fig. S4.
S-acylation level of endogenous and overexpressed mIFITM3. (A) Biological replicate of Fig. 4A. Macrophages were subjected to APE and analyzed by Western blot for endogenous IFITM3. (B) Biological replicate of Fig. 4B, where NIH 3T3 cells overexpressing wild-type HA-mIFITM3 or cysteine to alanine mutant constructs were analyzed with the APE. The number of PEGylation events are indicated by asterisks (*). (C) HEK293T cells overexpressing wild-type mIFITM3 or cysteine mutants were metabolically labeled for 2 h with 50 µM alk-16. Cell lysates prepared with 1% Brij 97 were subjected to immunoprecipitation with anti-HA beads, reacted with az-rho by CuAAC, separated by SDS/PAGE and visualized by fluorescence gel scanning. Protein loading was confirmed by anti-HA Western blotting.
Fig. S5.
Fig. S5.
Fatty-acylation of human IFITM3 cysteine mutant constructs. (A) A549 cells were activated with 500 ng/mL LPS, 100 μg/mL IFN-γ, or IFN-α for 16 h, subjected to APE, separated by SDS/PAGE and analyzed by Western blot. A third mass shift was not detected. (B) HA-hIFITM3 constructs were transfected in HEK293T cells, subjected to APE, and analyzed by Western blot. The number of PEGylation events are indicated by asterisks (*). (C) HEK293T cells expressing wild-type, or cysteine mutant human IFITM 1–3 were metabolically labeled with 50 µM alk-16. Cell lysates prepared with 1% Brij 97 were subjected to immunoprecipitation with anti-HA beads, reacted with az-rho, and analyzed in-gel fluorescence. (D) HEK293T cells expressing wild-type or cysteine mutant human IFITM3 were metabolically labeled for 2 h with 50 µM alk-16. Cell lysates prepared with 1% Brij 97 were subjected to immunoprecipitation with anti-HA beads, reacted with az-rho and analyzed by in-gel fluorescence. Protein loading was confirmed by anti-HA Western blotting.
Fig. S6.
Fig. S6.
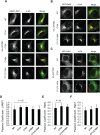
Immunofluorescence analysis of mIFITM3 localization. (A–C) NIH 3T3 cells were cotransfected with HA-mIFITM3 and (A) lysosomal marker LAMP1-GFP, (B) early endosome marker GFP-Rab5, and (C) late endosome marker GFP-Rab7. (Scale bar, 5 μm.) (D–F) Quantification of HA-mIFITM3 colocalization using Pearson coefficient. Sample sizes per condition are: (D) n = 10, (E) n = 20, and (F) n = 20. Error bar represent SD.
Fig. S7.
Fig. S7.
Immunofluorescence analysis of hIFITM3 localization. (A and B) HEK293T cells were transfected with LAMP1-GFP, and HA-hIFITM3 WT, C72A, or S-palmitoylation deficient (C71, 72, 105A) constructs. Cells were fixed and stained with primary anti-HA antibody, Alexa-647 secondary antibody, and imaged with a Zeiss confocal microscope. (Scale bar, 5 μm.) (B) Quantification of HA-hIFITM3 colocalization using Pearson coefficient was done using Imaris software. n = 20 cells per condition. Error bar represents SD.
Fig. S8.
Fig. S8.
Antiviral activity of HA-tagged IFITM3 constructs (A) Example of flow cytometry data of antiviral activity of overexpressed murine IFITM3 cysteine mutants. NIH 3T3 cells transfected overnight with wild-type, and cysteine mutant constructs of HA-mIFITM3, followed by infection with PR8 influenza virus at an MOI of 5 for 18 h. Cells were fixed, permeabilized with 0.1% Triton X-100, and labeled with anti-HA and anti-influenza NP antibodies expressed in HEK293T cells. (B) HEK293T cells transfected overnight with wild-type, and cysteine mutant constructs of HA-mIFITM3, followed by infection with PR8 influenza virus at an MOI of 5 for 18 h. Cells were fixed, permeabilized with 0.1% Triton X-100 and stained with anti-influenza NP antibodies. Graph of influenza-NP+ cells for each condition. Error bars represent SEM, n = 3. (C) HEK293T cells transfected overnight with wild-type, and cysteine mutant constructs of HA-human IFITM3, followed by infection with PR8 influenza virus at an MOI of 5 for 18 h. Cells were fixed, permeabilized with 0.1% Triton X-100, and stained with anti-influenza NP antibodies. Graph of influenza-NP+ cells for each condition. Error bars represent SEM, n = 3.
Fig. S9.
Fig. S9.
Alignment and conservation of IFITM protein sequences and their relative levels of S-fatty acylation. Comparison of previously compiled database of IFITM family proteins (23), using MEME motif comparison (meme-suite.org), shows relative conservation of residues within the CD225 domain. Cysteines 71, 72, and 105 are differentially palmitoylated (Fig. 4B), represented by the size of the thiol-coupled palmitate beneath the residue frequency plot. Plot prepared using WebLogo (weblogo.berkeley.edu).

Similar articles

Cited by

References

    1. Chamberlain LH, Shipston MJ. The physiology of protein S-acylation. Physiol Rev. 2015;95(2):341–376. - PMC - PubMed
    1. Peng T, Thinon E, Hang HC. Proteomic analysis of fatty-acylated proteins. Curr Opin Chem Biol. 2016;30:77–86. - PMC - PubMed
    1. Liang X, et al. Heterogeneous fatty acylation of Src family kinases with polyunsaturated fatty acids regulates raft localization and signal transduction. J Biol Chem. 2001;276(33):30987–30994. - PubMed
    1. Brett K, et al. Site-specific S-acylation of influenza virus hemagglutinin: the location of the acylation site relative to the membrane border is the decisive factor for attachment of stearate. J Biol Chem. 2014;289(50):34978–34989. - PMC - PubMed
    1. Fukata Y, Fukata M. Protein palmitoylation in neuronal development and synaptic plasticity. Nat Rev Neurosci. 2010;11(3):161–175. - PubMed

Publication types