. 2016 Apr 19;113(16):4356-61.
doi: 10.1073/pnas.1516767113. Epub 2016 Apr 4.

Heterotrimeric G-protein shuttling via Gip1 extends the dynamic range of eukaryotic chemotaxis

Affiliations

Heterotrimeric G-protein shuttling via Gip1 extends the dynamic range of eukaryotic chemotaxis

Yoichiro Kamimura et al. Proc Natl Acad Sci U S A. .

Abstract

Chemotactic eukaryote cells can sense chemical gradients over a wide range of concentrations via heterotrimeric G-protein signaling; however, the underlying wide-range sensing mechanisms are only partially understood. Here we report that a novel regulator of G proteins, G protein-interacting protein 1 (Gip1), is essential for extending the chemotactic range ofDictyosteliumcells. Genetic disruption of Gip1 caused severe defects in gradient sensing and directed cell migration at high but not low concentrations of chemoattractant. Also, Gip1 was found to bind and sequester G proteins in cytosolic pools. Receptor activation induced G-protein translocation to the plasma membrane from the cytosol in a Gip1-dependent manner, causing a biased redistribution of G protein on the membrane along a chemoattractant gradient. These findings suggest that Gip1 regulates G-protein shuttling between the cytosol and the membrane to ensure the availability and biased redistribution of G protein on the membrane for receptor-mediated chemotactic signaling. This mechanism offers an explanation for the wide-range sensing seen in eukaryotic chemotaxis.

Keywords: dynamic range extension; eukaryotic chemotaxis; gradient sensing; heterotrimeric G protein.


Conflict of interest statement

The authors declare no conflict of interest.

Figures
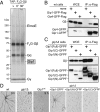
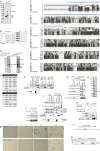
Fig. 1.
Fig. 1.
Gip1 is an interactor of trimeric G protein. (A) TAP using Flag×2-GFP-Gβ (F2G-Gβ) in vegetative growth (v) and before (0'') and 30 s after (30'') cAMP stimulation. Silver staining showed F2G-Gβ copurified with Gip1 along with ElmoE, Gα, and Gγ. (B) Gip1-GFP-Flag (Gip1-GFPF) and Gα4-GFP-Flag (Gα4-GFPF) proteins were expressed in WT cells and immunoprecipitated (IP) with α-Flag antibody from WCE. Copurification of Gβ (Upper) and GFP-Flag (Lower) was evaluated by immunoblotting. Gα4-GFPF was used as a positive control and confirmed the coprecipitation of Gβ. (C) Full-length Gip1 and its C and N termini tagged with GFP-Flag (Gip1-GFPF) were immunoprecipitated with α-Flag antibody from WCE. Copurification of Gβ (Upper) and GFP-Flag (Lower) was evaluated by immunoblotting. (D) Cells were starved on nonnutrient DB agar. Gip1OE cells are WT cells with full-length Gip1 overexpression.
Fig. S1.
Fig. S1.
Gip1 is an interactor of trimeric G protein. (A) TAP was carried out using WCEs prepared from WT cells expressing nothing (−), Flag×2-GFP (F2G), or F2G-Gβ in vegetative growth. Silver staining shows F2G-Gβ copurified with Gip1 along with ElmoE, Gα, and Gγ. (B) Schematic representation of Gip1 with an N-terminal PH domain. D. discoideum Gip1 was the query sequence in a BLAST search, and results are presented along with similarity (percentage of similar amino acids in similar regions) for Polysphodylium pallidum (P.p.), Dictyostelium fasciculatum (D.f.), Entamoeba histolytica (E.h.), and Acanthamoeba castellanii (A.c.). TNFAIP8 in Homo sapiens (H.s.) shares homology with the Gip1 C terminus. (C) Amino acid sequences of Gip1 and its homologs were aligned by CLUSTAL W2. BOXSHADE 3 was used to show identical residues and similar ones, which are highlighted in black and gray, respectively. The PH domain of Gip1 is indicated by a blue line. (D) TAP was applied to Gip1-GFP-Flag in gip1Δ cells (Left panel). V, vector control experiment. Bands indicated by 1 and 2 copurified with Gip1-GFP-Flag and included (1) a mixture of Gα4, Gα5, Gα9, and Gα2 subtypes or (2) Gβ. An asterisk denotes a nonspecific band. TAP was applied to F2G-Gβ in WT or gip1Δ cells (Right panel). ElmoE was present in both cell lines according to MS analysis. (E) Proteins from Fig. S1D (bands 1 and 2) were identified by MS; results are summarized in the Upper and Lower panels, respectively. (F) F2GFP, Gα2-GFP-Flag (Gα2-GFPF), and Gα4-GFP-Flag (Gα4-GFPF) proteins were immunoprecipitated with α-Flag antibody from WCEs. Copurification of Gip1 (Upper Left) and GFP-Flag (Lower Left) was evaluated by immunoblotting. Gα2-GFPF and Gα4-GFPF proteins were expressed in WT or gip1Δ cells and immunoprecipitated with α-Flag antibody from WCEs. Copurification of Gip1 (Upper Right) and GFP-Flag (Lower Right) was evaluated by immunoblotting. (G) Gip1-GFPF was immunoprecipitated with α-Flag antibody from WCE in the presence of nothing (−), 50 μM GDP, or 50 μM GTPγS. The indicated proteins were visualized by immunoblotting. V, vector control experiment. (H) Gip1 protein was purified from bacteria and 0.2 μg was stained by Coomassie Brilliant Blue (CBB). (I) F2G-Gβ was purified with α-Flag antibody beads. These beads were incubated with the indicated amount of bacterially purified Gip1 (see H) for 30 min. Then, bound Gα2 and Gip1 were evaluated by immunoblotting. Gα2 proteins bound to the F2G-Gβ beads independently of Gip1 addition, suggesting that Gip1 does not affect the complex formation of G proteins. (J) The indicated proteins were purified with α-Flag antibody beads in RIPA buffer, where G proteins were dissociated into α and βγ subunits as shown by immunoblotting with anti-Gα2 and anti-Gβ antibodies. These beads were incubated with 0.2 μg of bacterially purified Gip1 (see H), and the bound Gip1 was evaluated by immunoblotting. *F2G-Gβ and *F2GFP, degraded F2G-Gβ and F2GFP were nonspecifically cross-reacted by α-Gα2 and –Gβ, respectively. (K) Gip1-GFPF and Gα2-GFPF proteins were immunoprecipitated with α-Flag antibodies from WCEs. Copurification of Gα2 (Top), Gβ (Middle), and GFP-Flag (Bottom) was evaluated by immunoblotting. Binding of Gip1 to G proteins was dependent on Gβγ. (L) Schematic representation of gip1 genomic DNA and the region replaced by the BSR gene. (M) Cells were starved on nonnutrient DB agar. Gip1OE/WT, overexpression of full-length Gip1 in WT cells. Images were acquired at the indicated time. Multicellular structure formation was delayed in Gip1OE/WT cells. (N) WT and gip1Δ cells were starved in DB buffer and allowed to develop, and cAR1 expression level was determined by immunoblotting; both cell types had comparable expression kinetics, indicating a normal developmental program in mutants.
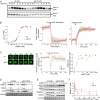
Fig. 2.
Fig. 2.
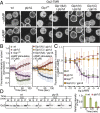
Chemotactic dynamic range is extended to higher concentrations via Gip1. (A) Chemical gradients were applied to WT and gip1Δ cells from a micropipette tip filled with 100 μM cAMP. Representative images of cell trajectories (red lines) are shown before (0') and 60 or 150 min after (60' and 150', respectively) the start of the assay. Cells are highlighted in green. (Scale bar, 50 µm.) (B) CI and motility speed were calculated from the assay in A following application of 10 or 100 μM cAMP at different distances from the micropipette tip. Each bar represents the average of at least 10 cells. (C) The chemotactic response to different cAMP concentrations was evaluated by the small population assay (Fig. S2B). Data represent the mean ± SEM of three experiments.
Fig. S2.
Fig. S2.
The chemotactic dynamic range is extended to higher concentrations via Gip1. (A) High-resolution images of Fig. 2A (Upper and Middle) and the cAMP gradient visualized by mixing ATTO 532 (ATTO-TEC) with cAMP solution (Upper Right). WT and gip1Δ cells were applied to chemical gradients emitted from a micropipette tip filled with 100 μM cAMP. Representative images of cell trajectories (red lines) are shown before (0') and 60 and/or 150 min after (60' and 150', respectively) the start of the assay (see Movies S1–S5). (Scale bar, 50 µm.) gip1Δ cells expressing the full-length or N or C terminus of Gip1 tagged with GFP-Flag (Gip1-GFPF) were exposed to gradients emitted from a micropipette tip filled with 100 μM cAMP (Bottom). Representative images of cell trajectories are shown 150' after the start of the assay. Chemotactic defects of gip1Δ cells were rescued by full-length Gip1 but not by the N or C terminus. Cells are highlighted in green. (B) Schematic image of the small population assay (Upper). Shown are representative droplets of WT (Lower Left) and gip1Δ (Lower Right) cell suspensions juxtaposed with 100 µM cAMP droplets. cAMP droplets were located to the right of the cell suspension droplets. (Scale bar, 200 µm.) (C) Chemotactic responses of WT and Gip1(full)-GFPF–expressing gip1Δ cells to different cAMP concentrations were evaluated by the small population assay. Data represent the mean ± SEM of three experiments.
Fig. S3.
Fig. S3.
gip1Δ cells exhibit normal cAMP-related responses. (A) cAR1 and Gα2 phosphorylation in WT and gip1Δ cells upon cAMP stimulation was evaluated by mobility shifts. Proteins were detected by immunoblots with each specific antibody. (B) G-protein activation was monitored by FRET changes between Gα2-Cerulean and Venus-Gβ. The dose–response for cAMP was measured with a fluorometer. Cells were mixed with cAMP at the indicated final concentrations for 1 min, and the loss of FRET, which represents the dissociation or activation of G proteins, was measured. Data represent the mean ± SEM of four experiments (Left). Upon the addition of 10 μM cAMP, FRET was measured at 1-s intervals in cells placed on coverslips. Values represent the mean ± SD of the normalized fluorescence ratio of Venus to Cerulean (n ≥ 40 cells). cAMP triggered a decrease in FRET (Middle). Cells were pretreated with 10 μM cAMP, and upon cAMP removal, FRET recovery was measured. Each value represents the mean ± SD of the normalized fluorescence ratio of Venus to Cerulean (n ≥ 50 cells) (Right). (C) Cells expressing the AKT PH domain fused to GFP (PHAKT-GFP; a live reporter of PIP3) were stimulated with 10 μM cAMP in the presence of 5 μM latrunculin A. Images were acquired at 2-s intervals. (Left) Representative images of PHAKT-GFP translocated from the cytosol to the plasma membrane within 8 s in WT and gip1Δ cells, indicating normal activation of the PIP3 pathway. Cytosolic intensity of PHAKT-GFP was monitored before and after application of 10 μM cAMP. The reduction in fluorescence intensity in the cytosol corresponded to PIP3 production at the plasma membrane (Middle). The dose–response of cells expressing PHAKT-GFP is plotted. Curves were similar for WT and gip1Δ cells, indicating that both cell types were equally sensitive to cAMP (Right). (D) Phosphorylation levels of PKBR1 and PKBA or Erk2 were assessed by immunoblotting with anti-phospho-PKC (pan) and anti-phospho Erk1/2 antibodies, respectively. The blot was stained with Amido Black to visualize the loading control. (E) WT and gip1Δ cells were stimulated by the indicated cAMP concentrations, and the phosphorylated forms of cAR1, Gα2, PKBR1, and Erk2 were assessed. Both cell types responded similarly at each cAMP concentration. (F) Quantitative analysis of F-actin formation triggered by 1 μM cAMP stimulation.
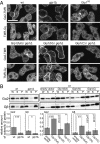
Fig. 3.
Fig. 3.
Gip1 regulates shuttling of trimeric G protein between the cytosol and the plasma membrane. (A) Intracellular distribution of Gα2-TMR and TMR-Gγ, respectively. Gip1(full), Gip1(N), and Gip1(C) represent the coexpression of the full-length (full), N terminus, and C terminus of Gip1, respectively. (Scale bar, 10 µm.) (B) WCEs (W) prepared from the indicated cell lines were separated into supernatant (S) and pellet (P) fractions. Endogenous Gα2 and Gβ were detected by immunoblotting (Top). The fraction of the supernatant was calculated by band intensities (Bottom). *P < 0.05, **P < 0.01, ***P < 0.005, t test.
Fig. S4.
Fig. S4.
Gip1 regulates shuttling of trimeric G protein between the cytosol and the plasma membrane. (A) Ratios of fluorescence intensities at the plasma membrane and in the cytosol for the data shown in Fig. 3A. Data represent the mean ± SD (n = 10 cells) for Gα2-TMR (Left) and TMR-Gγ (Right). The increased ratios signified that the cytosolic localization of these proteins was reduced in gip1Δ cells. (B) Full-length (full; blue), C-terminal (yellow), or N-terminal (red) Gip1 was expressed in gip1Δ cells along with Gα2-Halo proteins. Cells were stained with tetramethylrhodamine (TMR). GFP signal intensity and the ratio of TMR-labeled Gα2-Halo proteins at the plasma membrane and in the cytosol are plotted. The fraction of Gα2 at the plasma membrane was inversely proportional to the expression level of full-length and C-terminal Gip1 but was unrelated to the expression level of N-terminal Gip1, indicating that both full-length and C-terminal Gip1 were sufficient to retain Gα2 proteins in the cytosol. (C) The intracellular distribution of full-length, N-terminal, and C-terminal Gip1-GFPF in WT cells was determined by biochemical fractionation (Top) and GFP imaging (Bottom). (Scale bar, 10 µm.) (D) Localization of Gip1 was determined by cell fractionation. Endogenous Gip1 was detected by immunoblotting. In the WT cell, the upper band represents Gip1, which was absent in gip1Δ. The asterisk denotes a nonspecific band. (E) Gip1-GFPF–expressing cells were stimulated with 10 μM cAMP in the presence of 5 μM latrunculin A. Representative images are presented before and after stimulation. (Scale bar, 10 μm.) (F) The cytosolic fluorescence intensity of the Gip1-GFPF (mean ± SD) of E was quantified at 4-s intervals and showed that the intracellular localization of Gip1 was not affected upon cAMP stimulation.
Fig. 4.
Fig. 4.
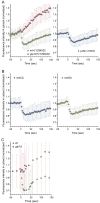
Gip1 modulates spatial regulation of trimeric G protein in response to chemoattractants. (A) Fluorescent images of Gα2-TMR. Cells were treated with cAMP in the presence of 5 μM latrunculin A. (Scale bar, 10 μm.) (B) Cells expressing Gα2-TMR were stimulated with cAMP, and fluorescence intensity in the cytosol (mean ± SD) was quantified at 4-s intervals. (C) Translocation of Gα2-TMR to the plasma membrane was assessed quantitatively by the decrease in cytosolic fluorescence intensity. Gα2-TMR protein was expressed in WT and gip1Δ cells harboring Gip1-GFPF (full-length and C terminus). A dose-dependent curve was plotted (mean ± SD). (D) Cells were fractionated before and after stimulation with 1 μM cAMP for 0.5 and 2 min (Left). The signal intensity of the supernatant fraction relative to that of WT cells at 0 min was quantified (Right).
Fig. S5.
Fig. S5.
Spatial regulation of trimeric G protein in response to chemoattractants is independent of PIP3, Ras activity, and the actin state. (A) Translocation of Gα2-TMR upon 10 μM cAMP was assessed in cells treated with 60 μM LY294002 and pi3k1Δ2Δ cells. A normal response was observed in cells that had PIP3 production inhibited pharmacologically or genetically. (B) Translocation of Gα2-TMR upon 10 μM cAMP stimulation was assessed in rasCΔ and rasGΔ cells. A normal response was observed in these mutant cells. (C) Translocation of Gα2-TMR upon 10 μM cAMP stimulation was assessed in the absence of latrunculin A. F-actin did not influence the translocation response.
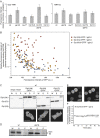
Fig. 5.
Fig. 5.
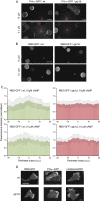
Gip1 is involved in the signal transduction of chemical gradients. (A) Gradient sensing monitored by a PIP3 probe, PHAKT-GFP. Cells were treated with 5 µM latrunculin A and stimulated with a micropipette tip containing 10 or 0.1 μM cAMP. The cell perimeter was divided into 40 points (Top); relative intensities (mean ± SD) of PHAKT-GFP in WT and gip1Δ cells are shown as histograms in green and red, respectively. (B) Representative temporal changes of PHAKT-GFP localization in WT (Top) and gip1Δ (Bottom) cells when stimulated by a micropipette containing 10 μM cAMP. Red arrows show the direction of the gradient source. Fluorescence intensities at the near (orange diamond) or far (blue circle) side of a cell from the micropipette were plotted over time as the mean ± SD. (Scale bar, 10 µm.) (C) Gα2 localization under steep cAMP gradients. Cells expressing Gα2-TMR were stimulated by a theta micropipette with two separate chambers containing either 0 or 10 nM cAMP (Top Left), and Gα2-TMR localization was visualized (Bottom). The left and right images show pre- and poststimulation, respectively. Ratios of the fluorescence intensities in the regions a and b were measured (Top Right, mean ± SD). (Scale bar, 10 µm.)
Fig. S6.
Fig. S6.
Gip1 processes chemoattractant gradient information. (A) Shown are 5 µM latrunculin A-treated cells expressing PHAKT-GFP that were exposed to a gradient of 10 (Upper) or 0.1 (Lower) μM cAMP in a micropipette tip (*). The images after 3 min of gradient stimulation are shown. (Scale bar, 10 µm.) (B) The same experiment was performed using the RBD of Raf (RBD)-GFP to detect the active form of Ras proteins. (Scale bar, 10 µm.) (C) The cell perimeter was divided into 40 points as in Fig. 5, and the relative intensities (mean ± SD) of RBD-GFP in WT and gip1Δ cells are shown as histograms in green and red, respectively. (D) Molecular distributions of activated Ras, PIP3, and F-actin were observed by RBD-GFP, PHAKT-GFP, and LimEΔcoil-RFP, respectively, at 3 min after application of the cAMP gradient, which was applied using a micropipette. gip1Δ cells exhibited less polarity and more variations in the direction of activated Ras, PIP3, and F-actin accumulation. (Scale bar, 10 µm.)
Fig. S7.
Fig. S7.
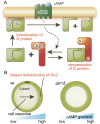
Model of Gip1-dependent trimeric G-protein shuttling. (A) Gip1 regulates G-protein shuttling by binding to its C terminus in the cytosol. Receptor stimulation causes the dissociation of G protein from Gip1, leading to G-protein translocation to the plasma membrane. (B) Gip1-mediated translocation of G proteins leads to redistribution along the chemical gradient in WT but not in gip1Δ cells. This reaction may be critical for the transduction of gradient information, especially at high chemical concentrations, to expand the range of sensitivity.

Similar articles

Cited by

References

    1. Trepat X, Chen Z, Jacobson K. Cell migration. Compr Physiol. 2012;2(4):2369–2392. - PMC - PubMed
    1. Kolaczkowska E, Kubes P. Neutrophil recruitment and function in health and inflammation. Nat Rev Immunol. 2013;13(3):159–175. - PubMed
    1. Van Haastert PJM, Devreotes PN. Chemotaxis: Signalling the way forward. Nat Rev Mol Cell Biol. 2004;5(8):626–634. - PubMed
    1. Artemenko Y, Lampert TJ, Devreotes PN. Moving towards a paradigm: Common mechanisms of chemotactic signaling in Dictyostelium and mammalian leukocytes. Cell Mol Life Sci. 2014;71(19):3711–3747. - PMC - PubMed
    1. Zigmond SH. Ability of polymorphonuclear leukocytes to orient in gradients of chemotactic factors. J Cell Biol. 1977;75(2 Pt 1):606–616. - PMC - PubMed

Publication types

MeSH terms

Substances