. 2016 Apr 4;5(4):e213.
doi: 10.1038/oncsis.2016.18.

Ultraconserved region-containing Transformer 2β4 controls senescence of colon cancer cells

Affiliations

Ultraconserved region-containing Transformer 2β4 controls senescence of colon cancer cells

K Kajita et al. Oncogenesis. .

Abstract

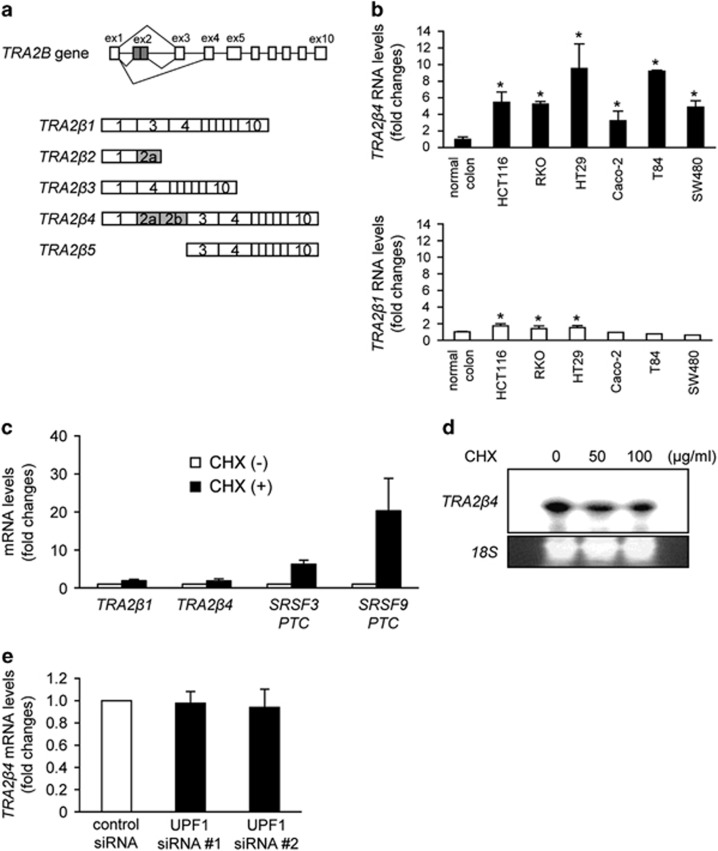
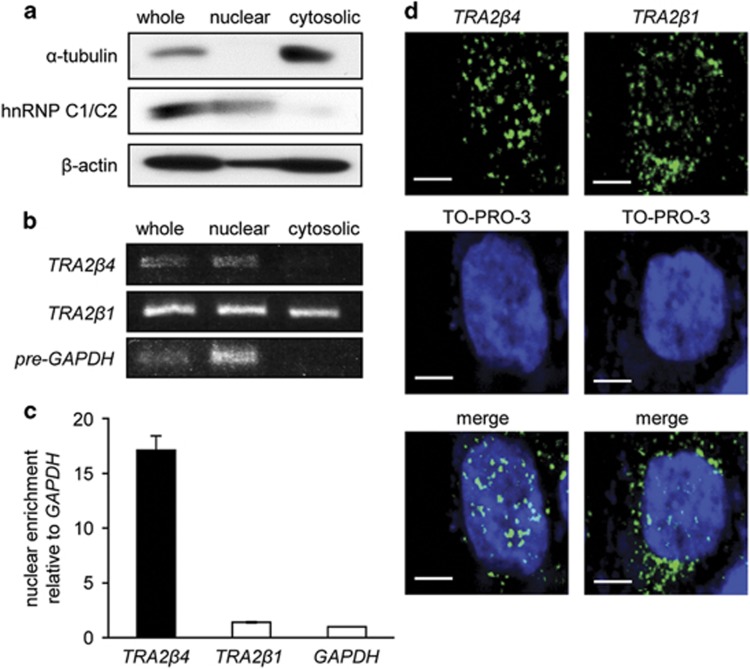
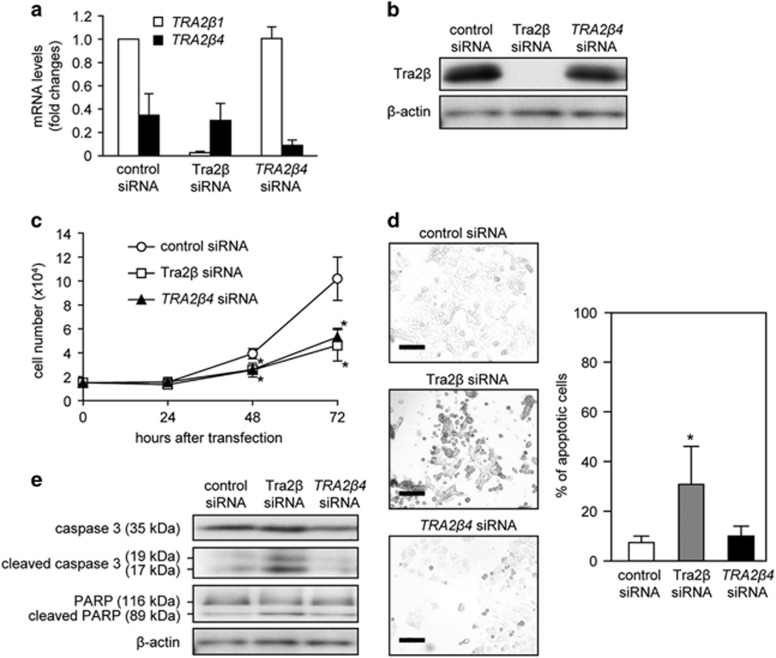
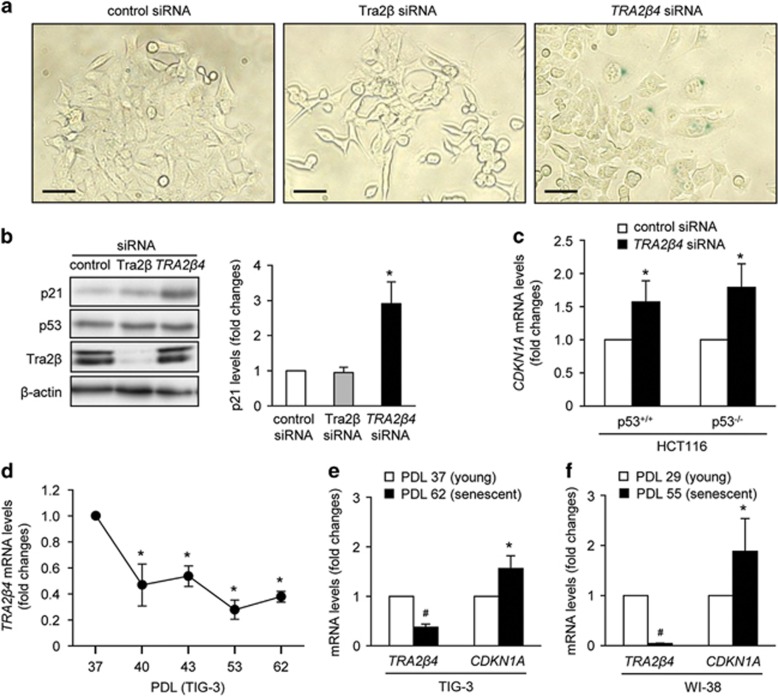
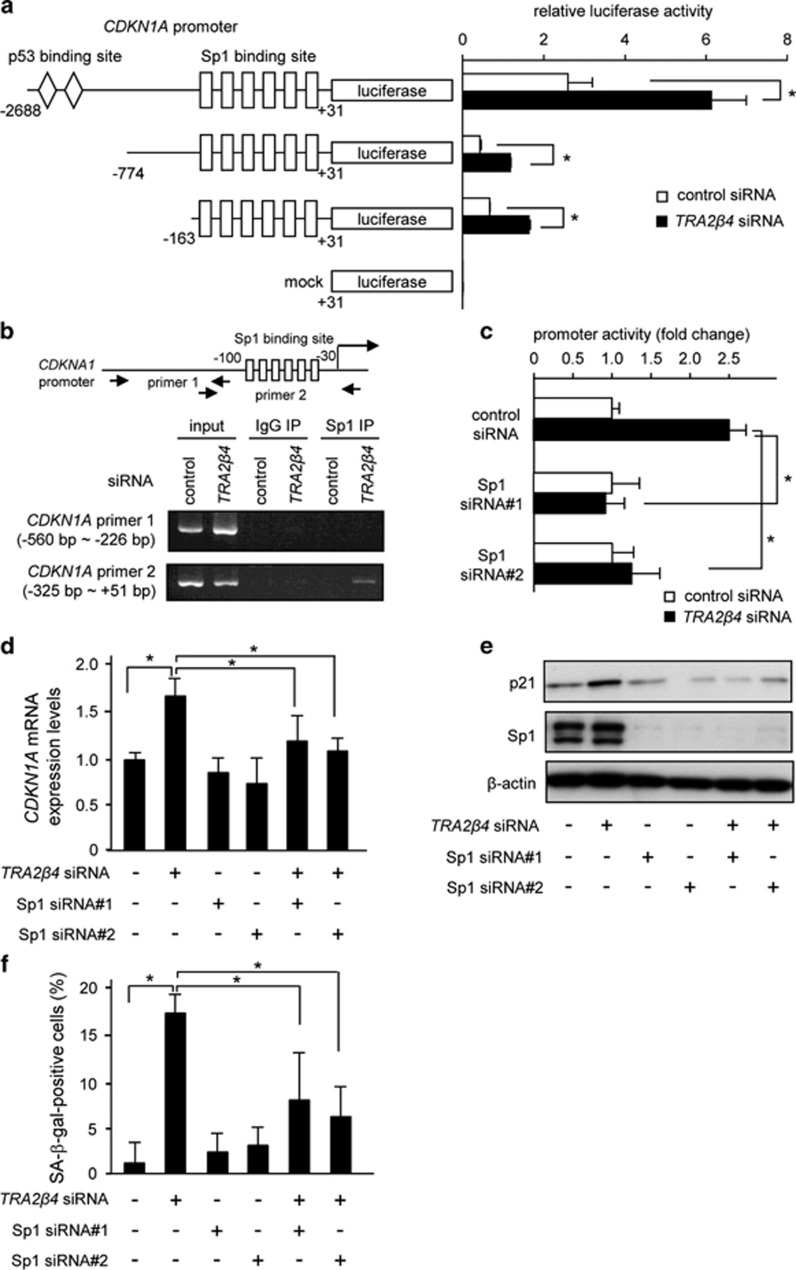
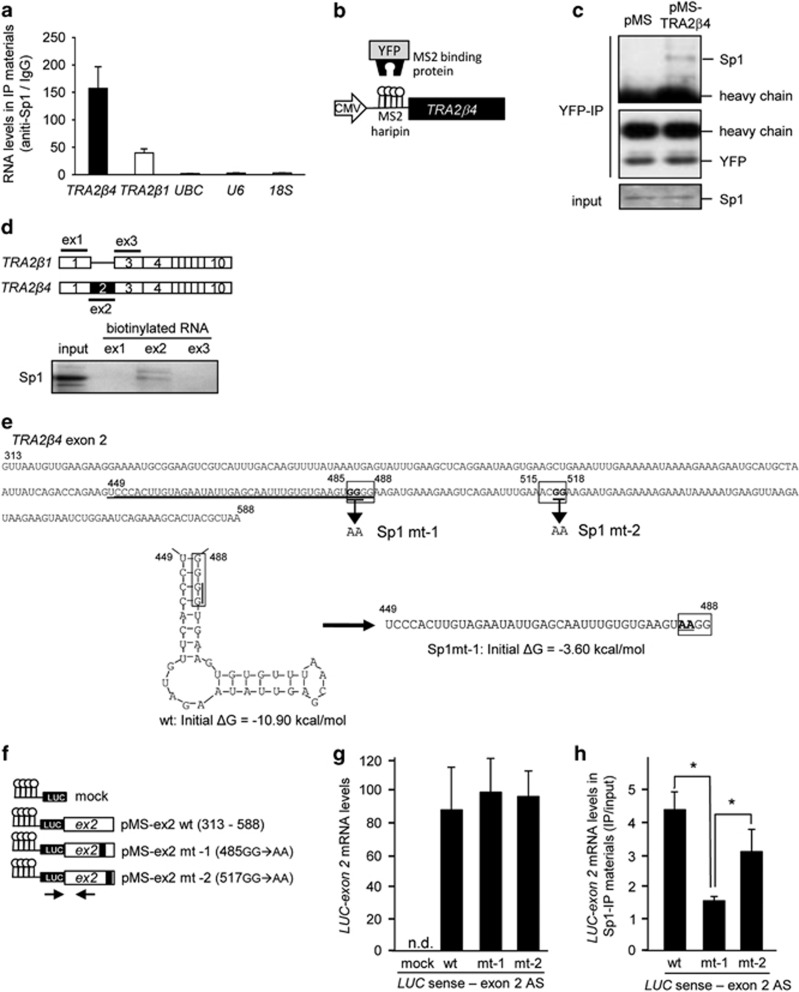
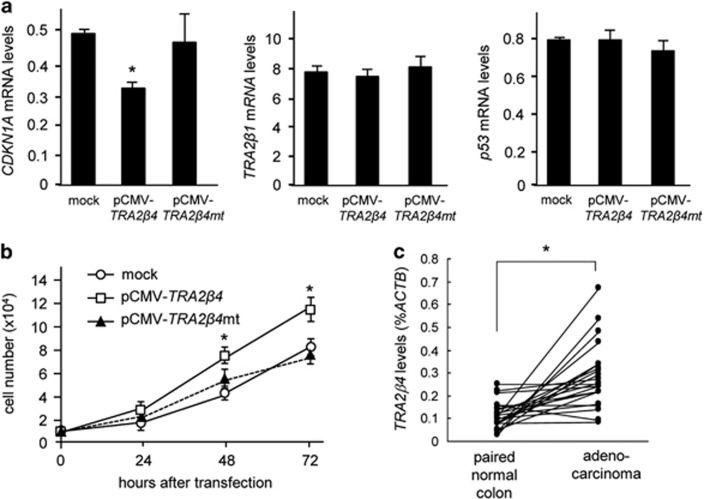
Ultraconserved regions (UCRs) are >200 bp genomic segments with perfect human-to-rodent sequence identity. Transcribed UCRs constitute a new category of noncoding RNAs whose functions remain poorly understood. The human transformer 2β (TRA2B) gene contains a 419-bp UCR spanning the 276-bp exon 2 and its neighboring introns. TRA2B exon 2 has premature stop codons, whereas an exon 2-containing splice variant (TRA2β4) was expressed preferentially in the nuclei of human colon cancer cells. TRA2β4 knockdown p53-independently stimulated CDKN1A transcription and increased p21, resulting in the appearance of senescent cells. Biotin pull-down and RNA immunoprecipitation assays revealed that TRA2β4 interacted with Sp1 through a Sp1-binding sequence (485-GGGG-488) in a stem-loop structure of exon 2. Mutation of this sequence (485-AAGG-488) disrupted the stem-loop structure, blocked the interaction with Sp1 and increased CDKN1A transcription. Overexpression of TRA2β4 significantly decreased CDKN1A mRNA levels and accelerated cell growth, but the introduction of the mutation in the Sp1-binding sequence completely canceled these effects. Taken together, TRA2β4 may sequester Sp1 from occupying promoters of target genes including CDKN1A, promoting cell growth by interrupting the senescence-related gene expression program. This novel function of TRA2β4 may uncover an oncogenic function of transcribed UCRs.


Figures

Figure 1
Figure 1
Expression of TRA2β1 and TRA2β4 in colon cancer cell lines. (a) Schematic diagram of the human TRA2B gene. Exons (ex) are indicated by open boxes and Arabic numbers. Filled boxes denote the ultraconserved exon 2. Five splice variants generated from TRA2B and the use of each exon are shown. (b) Amounts of TRA2β4 (upper panel) and TRA2β1 (lower panel) mRNAs in normal human colon and colon cancer cell lines (HCT116, RKO, HT29, Caco-2, T84 and SW480) were measured by qPCR using GAPDH mRNA as an endogenous quantity control. Values are means±s.d. from three independent experiments. *Significantly different by analysis of variance (ANOVA) and Bonferroni test (P<0.05). (c) HCT116 cells were treated with 10 μg/ml cycloheximide (CHX) for 4 h to inhibit NMD. Then, changes in mRNA levels of TRA2β1, TRA2β4, SRSF3 PTC and SRSF9 PTC were measured by qPCR using GAPDH mRNA as an endogenous quantity control. Values are means±s.d. from three independent experiments. (d) After treatment of HCT116 cells with 50 or 100 μg/ml CHX for 4 h, TRA2β4 levels were assayed by Northern hybridization with a locked nucleic acid (LNA) probe targeting for exon 2. 18S rRNA was used as a loading control. (e) After treatment of HCT116 cells with 10 nm of two different UPF1 siRNAs for 48 h, changes in TRA2β4 mRNA levels were measured by qPCR using GAPDH mRNA as an endogenous quantity control. Values are means±s.d. from three independent experiments.
Figure 2
Figure 2
Subcellular distribution of TRA2β4 in HCT116 cells. (a) After nuclear and cytosolic fractions were prepared from HCT116 cells, the purity of each fraction was monitored by measuring a cytosolic protein (α-tubulin) and a nuclear protein (heterogeneous nuclear ribonucleoprotein (hnRNP) C1/C2) by western blotting. (b) Total RNA was extracted from each fraction and TRA2β1 mRNA or TRA2β4 was amplified by RT–PCR using specific primer sets. The purity of each faction was also assessed by RT–PCR measurement of GAPDH pre-mRNA. (c) TRA2β1, TRA2β4 and GAPDH mRNA levels in each fraction were measured by qPCR. Nuclear-to-cytosolic distribution ratio of each mRNA was calculated. Nuclear enrichment of TRA2β1 mRNA or TRA2β4 is indicated by comparing values to nuclear/cytosolic distribution ratio of GAPDH mRNA. Values are means±s.d. from three independent experiments. (d) Subcellular localization of TRA2β4 and TRA2β1 mRNA in HCT116 cells was examined by RNA fluorescence in situ hybridization (RNA-FISH) using locked nucleic acid (LNA) probes against exon 2 and exon 1–3 junction of TRA2β1 mRNA (green), respectively, as described in Materials and methods section. Cells were counterstained with TO-PRO-3 (blue). Scale bars, 5 μm.
Figure 3
Figure 3
Effect of TRA2β4 silencing on cell proliferation and apoptosis. (a) After HCT116 cells were treated with 10 nm of TRA2β4 or Tra2β siRNA for 48 h, TRA2β1 mRNA and TRA2β4 levels were measured by qPCR using GAPDH as an endogenous quantity control. Values are means±s.d. from six independent experiments. (b) HCT116 cells were treated with 10 nm TRA2β4, Tra2β or control siRNA for 48 h, and then the amounts of Tra2β were measured by western blotting using β-actin as a loading control. (c) HCT116 cells (1.5 × 10⁴ cells) were seeded in 35-mm-diameter dishes and transfected with 10 nm TRA2β4, Tra2β or control siRNA. Subsequently, growing cells were harvested and counted at the indicated times. Values are means±s.d. from four independent experiments. *Significantly different by analysis of variance (ANOVA) and Bonferroni test (P<0.05). (d) After HCT116 cells were treated with 10 nm TRA2β4, Tra2β or control siRNA for 24 h, they were labeled using the DeadEnd Colorimetric TUNEL system (left panels), and the percentages of TUNEL-positive cells were determined (right panel). Values are means±s.d. from three independent experiments. *Significantly different by ANOVA and Bonferroni test (P<0.05). Scale bars, 50 μm. (e) After treatment of HCT116 cells with 10 nm TRA2β4, Tra2β or control siRNA for 48 h, whole-cell lysates were prepared from these cells. The levels of unprocessed or cleaved caspase-3 and PARP were measured by western blotting using β-actin as a loading control.
Figure 4
Figure 4
TRA2β4 knockdown induces cellular senescence. (a) HCT116 cells were transfected with 10 nm Tra2β, TRA2β4 or control siRNA for 72 h. They were then subjected to SA-β-gal staining. Scale bars, 10 μm. (b) After the transfection for 48 h, amounts of p21and p53 were measured by western blotting with respective antibodies (left panel). P21 levels were quantified using the Image J software (NIH, Bethesda, MD, USA) (right panel). β-Actin was used as a loading control. (c) After wild-type (p53+/+) or p53−/− HCT116 cells were treated with 10 nm TRA2β4 or control siRNAs for 48 h, CDKN1A mRNA levels were determined by qPCR using GAPDH mRNA as an endogenous quantity control. Data are expressed as fold changes compared with those in control siRNA-treated cells. Values are means±s.d. (n=5). (d) TRA2β4 levels in TIG cells at population doubling levels (PDL) 37, 40, 43, 53 and 62 were measured by qPCR using GAPDH mRNA as an endogenous quantity control. Data were expressed as fold changes relative to the levels in PDL 37 TIG-3 cells. Values are means±s.d. (n=3). (e and f) TRA2β4 and CDKN1A mRNA levels in young (PDL 37) and senescent (PDL 62) TIG-3 cells as well as young (PDL 29) and senescent (PDL 55) WI-38 cells were measured by qPCR using GAPDH mRNA as an endogenous quantity control. Values are means±s.d. from three independent experiments. *Significantly different by analysis of variance (ANOVA) and Bonferroni test (P<0.05) compared with those in control siRNA-treated cells.
Figure 5
Figure 5
TRA2β4 modifies promoter activity of the CDKN1A gene. (a) Twenty-four hours after transfection with 10 nm TRA2β4 or control siRNA, HCT116 cells were transiently transfected with luciferase reporter plasmids driven by −2688/+31, −774/+31 or −163/+31 bp promoter fragments of CDKN1A for 24 h. Luciferase activities in these cells were measured using the Dual-Luciferase Reporter Assay System. *Significantly decreased compared with control siRNA-treated cells (P<0.05 by analysis of variance (ANOVA) and Bonferroni test). (b) After treatment with TRA2β4 or control siRNA for 48 h, HCT116 cells were subjected to chromatin immunoprecipitation (ChIP) assays. Formaldehyde-crosslinked nuclear extracts were immunoprecipitated with an anti-Sp1 antibody or normal rabbit IgG (IgG). PCR was performed using an input nuclear chromatin fraction as a template (input). Specific PCR products corresponding to the region of the CDKN1A promoter containing the Sp1-binding sites were amplified and separated by agarose gel electrophoresis followed by ethidium bromide staining. (c) After treatment with 10 nm Sp1, TRA2β4 or control siRNA for 24 h, HCT116 cells were transiently transfected with the luciferase plasmid (pGL3-CDKN1A −163/+31) for 24 h. Luciferase activities in these cells were measured using the Dual-Luciferase Reporter Assay System. Values are means±s.d. (n=4). *Significantly different (P<0.05 by ANOVA and Bonferroni test). (d and e) After HCT116 cells were treated with TRA2β4 and/or Sp1 siRNA nos 1/2 as indicated for 24 h, expression levels of CDKN1A mRNA and p21 were analyzed by qPCR and western blotting. (f) After silencing of TRA2β4 and/or Sp1 nos 1/2, the cells were stained with SA-β-gal and then one hundred cells per individual sample in three independent fields were measured. *Significantly different (P<0.05 by ANOVA and Bonferroni test).
Figure 6
Figure 6
TRA2β4 binds to Sp1 via exon 2. (a) Nuclear lysates prepared from UV-crosslinked HCT116 cells were subjected to an RIP assay using an anti-Sp1 antibody or normal mouse IgG. Immunoprecipitated RNAs were quantified by qPCR. Data are shown as enrichment relative to values obtained with normal mouse IgG. Values are means±s.d. (n=4). (b) Scheme for full-length TRA2β4 bearing bacteriophage MS2 hairpins (pMS-TRA2β4). YFP, yellow fluorescence protein. (c) After HCT116 cells were co-transfected with pMS2-YFP and pMS-TRA2β4 or control mock (pMS), association between Sp1 and TRA2β4 was analyzed using immunoprecipitaion with anti-YFP antibody and western blotting with anti-Sp1 antibody. (d) Nuclear fractions (40 μg) prepared from HCT116 cells were incubated with 1 μg of biotinylated transcripts designed as exon 1 (ex1), exon 2 (ex2) and exon 3 (ex3) of TRA2β4 in 10 mm Tris-HCl buffer, pH 8.0, containing 1 mm EDTA, 250 mm NaCl and 0.5% Triton X-100 for 1 h at room temperature. RNA–protein complexes were isolated with paramagnetic streptavidin-conjugated Dynabeads, and bound Sp1 was detected by western blotting. (e) Nucleotide sequence of TRA2β4 exon 2. Two consensus Sp1-binding sites are boxed. Formation of stem-loop structure of TRA2β4 exon 2 RNA (449–488 nt) and its disruption by the mutation of 485-GGGG-488 to 485-AAGG-488 are shown below. These structures were predicted using CentroidFold and M-FOLD programs. (f) Scheme for pMS2-LUC (Renilla luciferase gene (LUC)), pMS2-LUC-exon 2 wild-type (pMS-ex2 wt), pMS2-LUC-exon 2 mt-1 (pMS-ex2mt-1), and pMS2-LUC-exon 2 mt-2 (pMS-ex2mt-2). Arrows indicate a primer set used. (g and h) Nuclear lysates prepared from UV-crosslinked HCT116 cells were subjected to an RIP assay using an anti-Sp1 antibody. Immunoprecipitated LUC-fused exon 2 RNAs were measured by qPCR. Data are shown as enrichment relative to values obtained from amount of each input. Values are means±s.d. (n=4).
Figure 7
Figure 7
Expression of TRA2β4 in colon cancers. (a) HCT116 cells were transfected with pcDNA3.1 (mock), pCMV-TRA2β4 or pCMV-TRA2β4 mutated in the stem-loop motif (pCMV-TRA2β4mt, 485-AAGG-488) for 48 h. mRNA levels were measured by qPCR using GAPDH as an endogenous quantity control. *Significantly decreased compared with mock-treated cells (P<0.05 by Student's t-test). (b) After transfection of HCT116 cells (1 × 10⁴ cells per 24-well dish) with pcDNA3.1 (mock), pCMV-TRA2β4 or pCMV-TRA2β4mt, the number of growing cells were measured using CellTiter96 AQueous Cell Proliferation Assay (MTS). Values expressed as means±s.d. (n=3). *Significantly increased compared with mock-transfected cells (P<0.05 by Student's t-test). (c) Using human colon cancer tissue qPCR arrays (TissueScan, HCRT103), TRA2β4 expressed in cDNAs from adenocarcinomas of the colon and surrounding normal colon tissues were measured by qPCR in 24 patients. Values were normalized to ACTB mRNA levels.

Similar articles

Cited by

References

    1. Modrek B, Lee C. A genomic view of alternative splicing. Nat Genet 2002; 30: 13–19. - PubMed
    1. Srebrow A, Kornblihtt AR. The connection between splicing and cancer. J Cell Sci 2006; 119: 2635–2641. - PubMed
    1. Wang ET, Sandberg R, Luo S, Khrebtukova I, Zhang L, Mayr C et al. Alternative isoform regulation in human tissue transcriptomes. Nature 2008; 456: 470–476. - PMC - PubMed
    1. Venables JP, Klinck R, Koh C, Gervais-Bird J, Bramard A, Inkel L et al. Cancer-associated regulation of alternative splicing. Nat Struct Mol Biol 2009; 16: 670–676. - PubMed
    1. Kondo S, Yamamoto N, Murakami T, Okumura M, Mayeda A, Imaizumi K. Tra2 beta, SF2/ASF and SRp30c modulate the function of an exonic splicing enhancer in exon 10 of tau pre-mRNA. Genes Cells 2004; 9: 121–130. - PubMed