

Effect of IL-7 and IL-15 on T cell phenotype in myelodysplastic syndromes
- PMID: 27036031
- PMCID: PMC5053665
- DOI: 10.18632/oncotarget.8459
Effect of IL-7 and IL-15 on T cell phenotype in myelodysplastic syndromes
Abstract
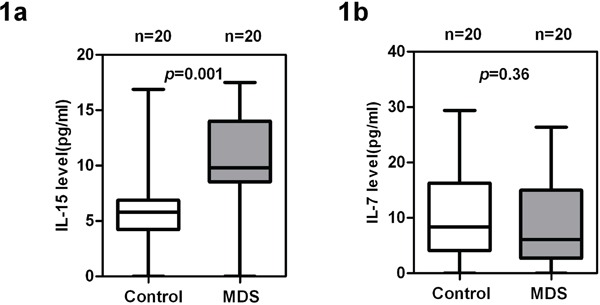
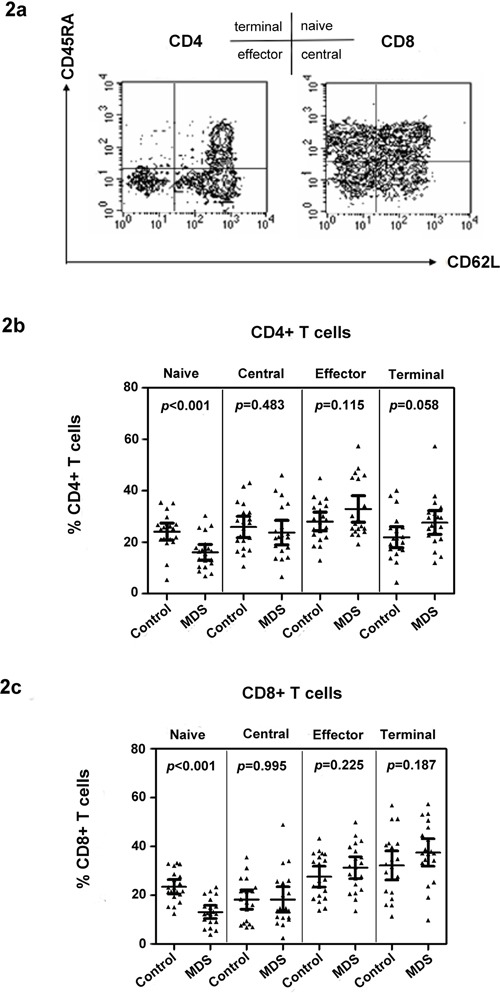
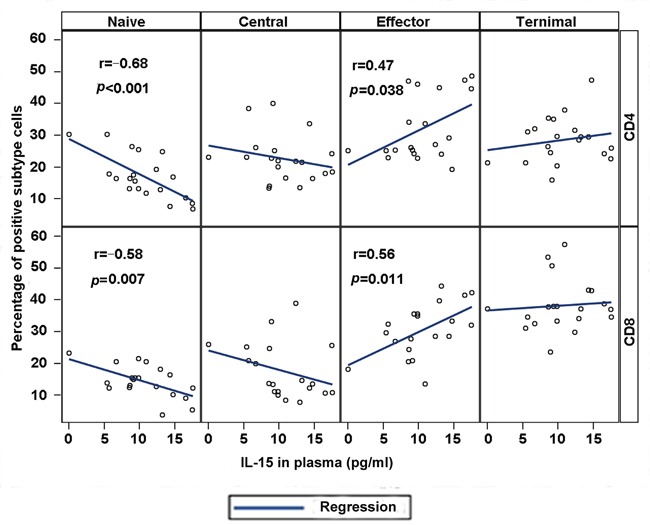
Aberrant T cell phenotype is one of the characteristics of myelodysplastic syndromes (MDS). In this study, we detected an increased concentration of IL-15 in the plasma of MDS patients (n = 20) compared with that in the plasma of healthy controls (n = 20). In MDS patients, reduced naïve CD4+ and CD8+ T cells [16.11 ± 6.56 vs. 24.11 ± 7.18 for CD4+ T cells (p < 0.001) and 13.15 ± 5.67 vs. 23.51 ± 6.25 for CD8+ T cells (p < 0.001)] were observed. The reduced naïve and increased effector memory T cells were significantly correlated with IL-15 plasma level. Then, the effect of IL-15 and IL-7 was tested in vitro. Peripheral blood mononuclear cells from MDS were treated for 15 days with IL-15. This treatment significantly decreased naïve CD4+ (p < 0.001) and CD8+ (p < 0.001) T cells and correspondingly increased terminal memory CD4+ and CD8+ T cells (p < 0.001). Treatment with IL-7 increased naïve CD4+ (p < 0.05) and CD8+ (p < 0.001) T cells. Our results indicated that exposure to high levels of IL-15 may be involved in the T cell phenotype conversion observed in MDS. IL-7 may be one of the promising therapeutic candidates for recovering the effector immune compartment in MDS patients.
Keywords: IL-15; IL-7; T cells; myelodysplastic syndromes.
Conflict of interest statement
The authors declare no competing interests.
Figures

Similar articles
-
Interleukin-17 enhances the production of interferon-γ and tumour necrosis factor-α by bone marrow T lymphocytes from patients with lower risk myelodysplastic syndromes.Eur J Haematol. 2013 May;90(5):375-84. doi: 10.1111/ejh.12074. Epub 2013 Mar 1. Eur J Haematol. 2013. PMID: 23331180
-
Erythropoietin administration is associated with improved T-cell properties in patients with myelodysplastic syndromes.Leuk Res. 2017 Jan;52:20-27. doi: 10.1016/j.leukres.2016.11.002. Epub 2016 Nov 2. Leuk Res. 2017. PMID: 27870945
-
Peripheral human CD4+CD8+ T lymphocytes exhibit a memory phenotype and enhanced responses to IL-2, IL-7 and IL-15.Sci Rep. 2017 Sep 14;7(1):11612. doi: 10.1038/s41598-017-11926-2. Sci Rep. 2017. PMID: 28912605 Free PMC article.
-
Homeostasis of memory T cells.Immunol Rev. 2006 Jun;211:154-63. doi: 10.1111/j.0105-2896.2006.00401.x. Immunol Rev. 2006. PMID: 16824125 Review.
-
Cytokine signals in T-cell homeostasis.J Immunother. 2005 Jul-Aug;28(4):289-94. doi: 10.1097/01.cji.0000165356.03924.e7. J Immunother. 2005. PMID: 16000945 Review.
Cited by
-
The role of interleukin-15 in the development and treatment of hematological malignancies.Front Immunol. 2023 Apr 20;14:1141208. doi: 10.3389/fimmu.2023.1141208. eCollection 2023. Front Immunol. 2023. PMID: 37153603 Free PMC article. Review.
-
Obesity altered T cell metabolism and the response to infection.Curr Opin Immunol. 2017 Jun;46:1-7. doi: 10.1016/j.coi.2017.03.008. Epub 2017 Mar 27. Curr Opin Immunol. 2017. PMID: 28359913 Free PMC article. Review.
References
-
- Greenberg P, Cox C, LeBeau MM, Fenaux P, Morel P, Sanz G, Sanz M, Vallespi T, Hamblin T, Oscier D, Ohyashiki K, Toyama K, Aul C, Mufti G, Bennett J. International scoring system for evaluating prognosis in myelodysplastic syndromes. Blood. 1997;89:2079–2088. - PubMed
-
- Sloand EM, Kim S, Fuhrer M, Risitano AM, Nakamura R, Maciejewski JP, Barrett AJ, Young NS. Fas-mediated apoptosis is important in regulating cell replication and death in trisomy 8 hematopoietic cells but not in cells with other cytogenetic abnormalities. Blood. 2002;100:4427–4432. - PubMed
-
- Sloand EM, Melenhorst JJ, Tucker ZC, Pfannes L, Brenchley JM, Yong A, Visconte V, Wu C, Gostick E, Scheinberg P, Olnes MJ, Douek DC, Price DA, Barrett AJ, Young NS. T-cell immune responses to Wilms tumor 1 protein in myelodysplasia responsive to immunosuppressive therapy. Blood. 2011;117:2691–2699. - PMC - PubMed
-
- Aalbers AM, van den Heuvel-Eibrink MM, Baumann I, Beverloo HB, Driessen GJ, Dworzak M, Fischer A, Gohring G, Hasle H, Locatelli F, De Moerloose B, Noellke P, Schmugge M, Stary J, Yoshimi A, Zecca M, et al. T-cell receptor Vbeta skewing frequently occurs in refractory cytopenia of childhood and is associated with an expansion of effector cytotoxic T cells: a prospective study by EWOG-MDS. Blood Cancer J. 2014;4:e209. - PMC - PubMed
MeSH terms
Substances
Grants and funding
LinkOut - more resources
Full Text Sources
Other Literature Sources
Medical
Research Materials
Miscellaneous
