. 2016 May;12(19):2616-26.
doi: 10.1002/smll.201503342. Epub 2016 Mar 31.

Controlled Drug Release and Chemotherapy Response in a Novel Acoustofluidic 3D Tumor Platform

Affiliations

Controlled Drug Release and Chemotherapy Response in a Novel Acoustofluidic 3D Tumor Platform

Ioannis K Zervantonakis et al. Small. 2016 May.

Abstract

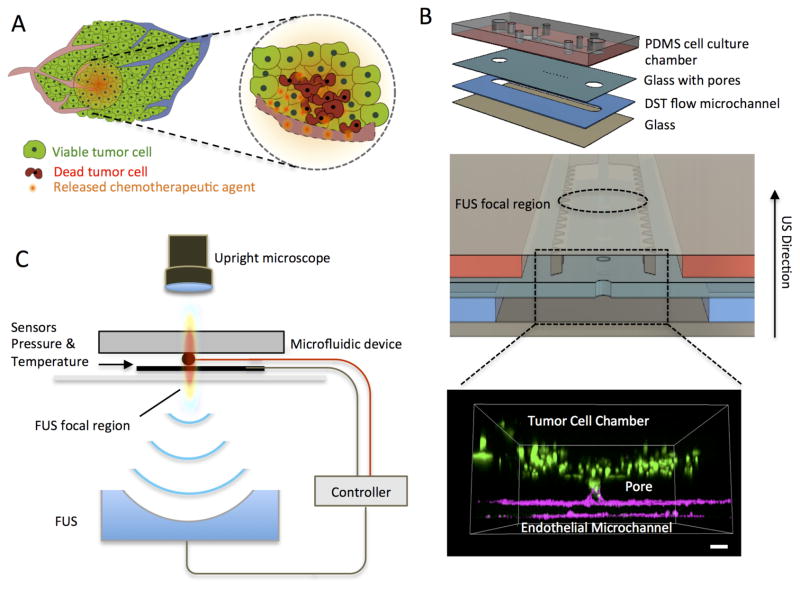
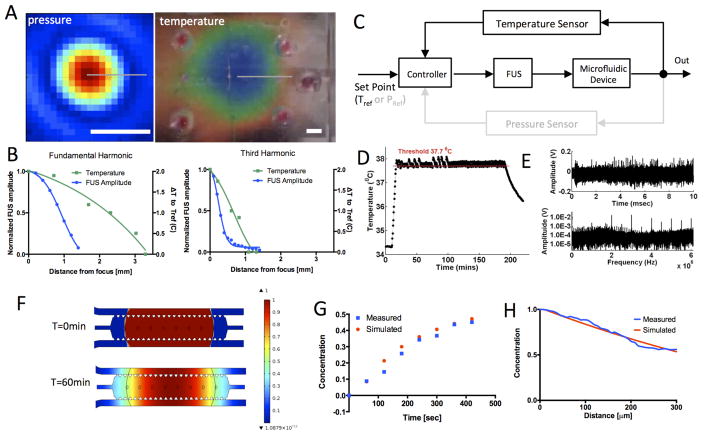
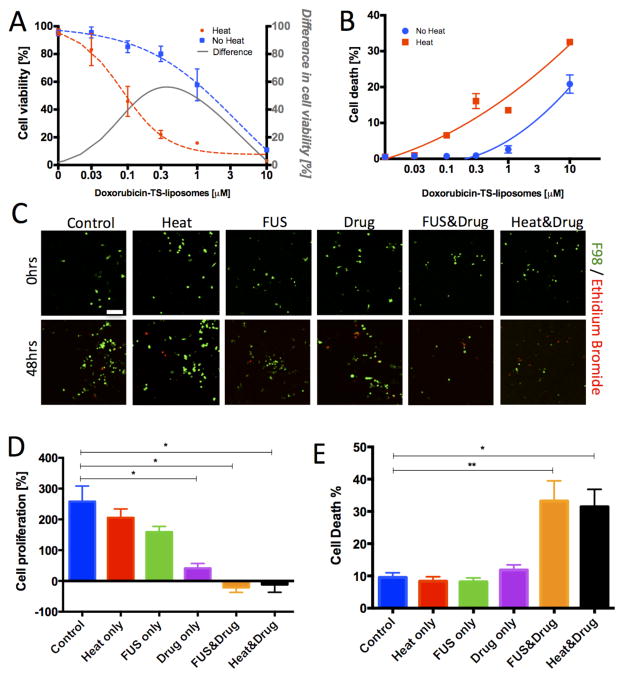
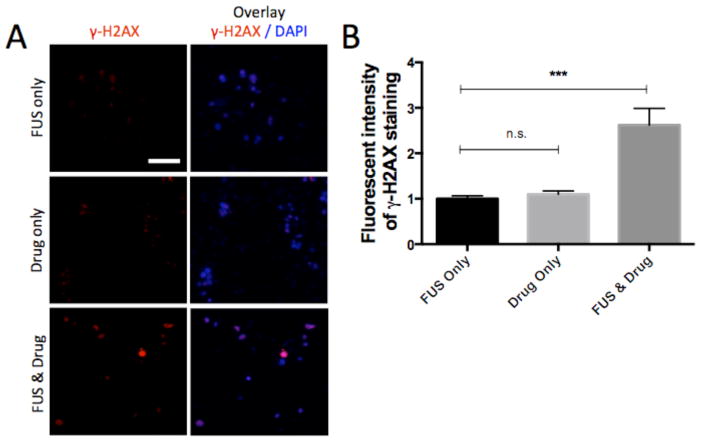
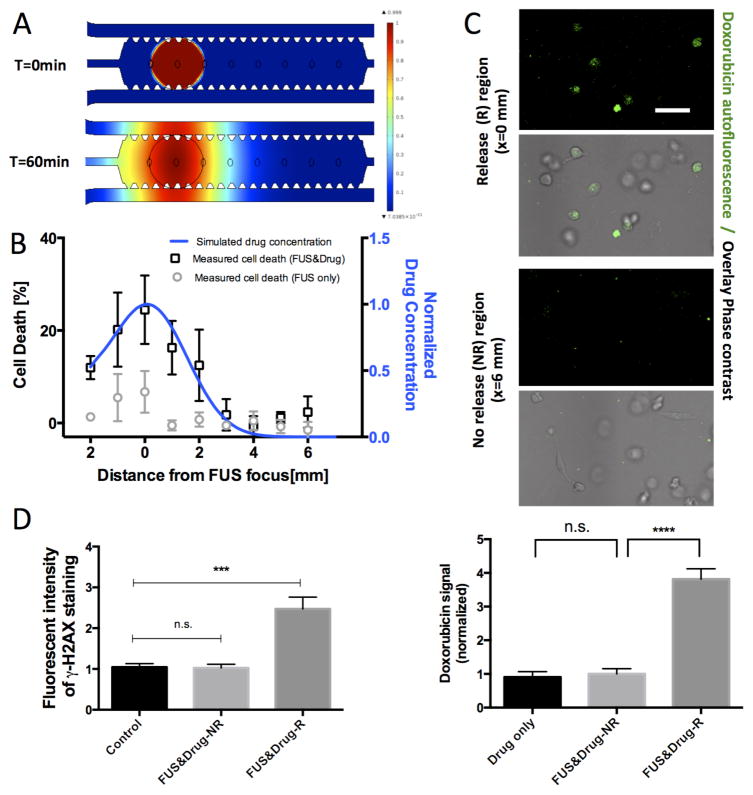
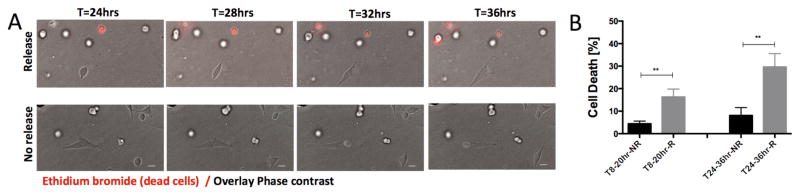
Overcoming transport barriers to delivery of therapeutic agents in tumors remains a major challenge. Focused ultrasound (FUS), in combination with modern nanomedicine drug formulations, offers the ability to maximize drug transport to tumor tissue while minimizing toxicity to normal tissue. This potential remains unfulfilled due to the limitations of current approaches in accurately assessing and quantifying how FUS modulates drug transport in solid tumors. A novel acoustofluidic platform is developed by integrating a physiologically relevant 3D microfluidic device and a FUS system with a closed-loop controller to study drug transport and assess the response of cancer cells to chemotherapy in real time using live cell microscopy. FUS-induced heating triggers local release of the chemotherapeutic agent doxorubicin from a liposomal carrier and results in higher cellular drug uptake in the FUS focal region. This differential drug uptake induces locally confined DNA damage and glioblastoma cell death in the 3D environment. The capabilities of acoustofluidics for accurate control of drug release and monitoring of localized cell response are demonstrated in a 3D in vitro tumor mode. This has important implications for developing novel strategies to deliver therapeutic agents directly to the tumor tissue while sparing healthy tissue.

Keywords: acoustofluidics; controlled release; drug delivery; focused ultrasound; tumor microenvironments.


Figures

Figure 1
Figure 1
Schematic of the closed-loop acoustofluidic (FUS-microfluidic integrated) device. (A) Schematic showing localized, drug release in a tumor. The area targeted for drug release by FUS is highlighted with the dashed circle. (B) Top: Assembly of the multilayer microfluidic device. Middle: Cross-section of the microfluidic device showing the cell chamber, DST flow microchannel where the drugs are loaded and the FUS focal region. Bottom: 3D confocal rendering of GFP tumor cells (green) in the cell chamber and interfaced through the glass pore with the DST flow microchannel where an endothelial monolayer is formed (magenta) (C) Diagram of experimental system, highlighting the optically transparent microfluidic device, the pressure/temperature sensors feeding into the controller and the FUS transducer (located 30mm away from the device).
Figure 2
Figure 2
Computational and experimental characterization of the acoustofluidic system. (A) Pressure (left) and temperature (right) maps for the fundamental frequency (1.025MHz) of the FUS transducer. Pressure map was measured with a calibrated hydrophone in the water. The temperature was mapped using a thermochromic film with 2 °C dynamic range. Scalebar is 2mm. (B) Spatial profiles of FUS amplitude (blue) and temperature (green) for the fundamental (left) and third harmonic (right). FUS amplitude was normalized by the maximum value. (C) Controller block diagram. (D) Temperature recording from the thermocouple in response to FUS pulses. Feedback control was used for all temperature measurements in our experiments. (E) Voltage trace (top) and spectrum (bottom) of microbubble acoustic emissions recorded by the pressure sensor in response to a FUS pulse. Temperature and pressure sensors are located in the center of the heated region in Figure 2A. (F) Simulations of concentration distribution of the released drug at time 0 (top) and 60min (bottom). (G) Measured and computed temporal evolution of drug concentration 100μm from the initial drug-release area. (H) Concentration profiles within the cell chamber at t=60min. Concentration values were normalized by the maximum value in the drug-release area.
Figure 3
Figure 3
Cancer cell response to doxorubicin-TS-liposomes. (A) F98 cell viability to varying drug doses after 48hrs under water-bath triggered release (red) and no-release (blue) conditions. Viability values normalized to the untreated control. The difference between the two curves is also plotted (grey). (B) Cell death dose-response (a quadratic function was fit). Average values and SEM error bars across 4 wells. (C) Top: Representative confocal images of viable (green) and dead (red) F98 cells in the microfluidic device prior (top: 0hrs) and after (bottom: 48hrs) application of experimental conditions. Each image corresponds to a single confocal slice. Scale bar is 100μm. (D) Quantification of cell proliferation (% change of viable cells between 48hrs and 0hrs) in the microfluidic device under control, heating only, FUS treatment only, doxorubicin-TS-liposomes (0.3 μM) only, FUS & doxorubicin-TS-liposomes (0.3 μM), water-bath induced-heating at 43C & doxorubicin-TS-liposomes (0.3 μM). (E): Percentage of dead cells over total cells in each condition. Average values across n > 5 devices; error bars represent standard error of the mean (SEM). Statistically significant differences are highlighted (* p<0.05; ** p<0.01).
Figure 4
Figure 4
Analysis of DNA damage in response to drug exposure in the device. (A) Immunostaining of γ-H2AX and DAPI in the microfluidic device under conditions of FUS-exposure, no-drug release (0.3μM doxorubicin-TS-liposomes) and FUS-triggered drug release (FUS & drug: 0.3μM). Each image corresponds to a single confocal slice. Scale bar corresponds to 100μm. (B) Quantification of staining intensity per cell in (A). Average values (n=40), and error bars represent standard deviation. Values normalized to the γ-H2AX intensity for the FUS only condition. Statistically significant differences are highlighted (*** p<0.001).
Figure 5
Figure 5
Localized FUS-triggered drug release and cell response. (A) Diffusion simulation of drug distribution at 0min and 60min after FUS-triggered release. (B) Spatial profile (blue) of simulated drug concentration at t=60minutes after drug release and measured cell death under localized FUS-triggered drug treatment (black bars) show good agreement. Cell death profile under FUS-treatment only (grey bars) is also shown. Concentration normalized to the maximum value (0.3μM). Cell death values are reported as differences from baseline values at the region of no release. Averages across n=4 devices and error bars are SEM. (C) Representative confocal images of doxorubicin uptake (green) in an area of drug release (R) compared to an area of no release (NR), 1hr after FUS-triggered heating. Scale bar corresponds to 50μm. Quantification of doxorubicin (dose of 3μM to clearly demonstrate differential effects) uptake in microfluidic devices. Values are normalized to doxorubicin uptake signal for devices treated with drug only but no FUS treatment. Average values across n=30 cells are plotted, and error bars represent standard deviation. (D) Quantification of DNA-damage response in drug release (R) and no release (NR) locations in devices 4hrs after localized FUS treatment and doxorubicin-TS-liposome (0.3μM) treatment. Bars represent average across n=40 cells, and error bars represent standard deviation. Values normalized to the γ-H2AX intensity for the untreated control. Statistically significant differences are highlighted (*** p<0.001, **** p<0.0001).
Figure 6
Figure 6
Live cell imaging of tumor cell death after FUS-triggered localized drug release. (A) Time series of confocal images showing tumor cell death (red, incorporation of ethidium bromide) in a location of drug release (top row) compared to a location of no release (bottom row). Scale bar corresponds to 25μm. (B) Quantification of the percentage of tumor cells dying during 8–20hrs (left) and 24–36hrs (right) after treatment with doxorubicin-TS-liposomes (3μM) in areas of drug release (R) and areas of no release (NR). n=8 locations were analyzed per condition (n>120 cells scored per condiction per device) and values represents averages with error bars SEM. Statistically significant differences are highlighted (** p<0.01).

Similar articles

Cited by

References

    1. Chauhan VP, Jain RK. Nature materials. 2013;12(11):958–62. - PMC - PubMed
    1. Woodworth GF, Dunn GP, Nance EA, Hanes J, Brem H. Frontiers in oncology. 2014;4:126. - PMC - PubMed
    1. Olson JJ, Nayak L, Ormond DR, Wen PY, Kalkanis SN, Ryken TC, Committee ACJG. Journal of neuro-oncology. 2014;118(3):557–99. - PubMed
    1. Bertrand N, Wu J, Xu X, Kamaly N, Farokhzad OC. Advanced drug delivery reviews. 2014;66:2–25. - PMC - PubMed
    1. Xu X, Ho W, Zhang X, Bertrand N, Farokhzad O. Trends in molecular medicine. 2015;21(4):223–32. - PMC - PubMed

Publication types

MeSH terms

Substances

LinkOut - more resources