. 2016 Mar 31:7:11124.
doi: 10.1038/ncomms11124.

Early ERK1/2 activation promotes DRP1-dependent mitochondrial fission necessary for cell reprogramming

Affiliations

Early ERK1/2 activation promotes DRP1-dependent mitochondrial fission necessary for cell reprogramming

Javier Prieto et al. Nat Commun. .

Abstract

During the process of reprogramming to induced pluripotent stem (iPS) cells, somatic cells switch from oxidative to glycolytic metabolism, a transition associated with profound mitochondrial reorganization. Neither the importance of mitochondrial remodelling for cell reprogramming, nor the molecular mechanisms controlling this process are well understood. Here, we show that an early wave of mitochondrial fragmentation occurs upon expression of reprogramming factors. Reprogramming-induced mitochondrial fission is associated with a minor decrease in mitochondrial mass but not with mitophagy. The pro-fission factor Drp1 is phosphorylated early in reprogramming, and its knockdown and inhibition impairs both mitochondrial fragmentation and generation of iPS cell colonies. Drp1 phosphorylation depends on Erk activation in early reprogramming, which occurs, at least in part, due to downregulation of the MAP kinase phosphatase Dusp6. Taken together, our data indicate that mitochondrial fission controlled by an Erk-Drp1 axis constitutes an early and necessary step in the reprogramming process to pluripotency.


Figures
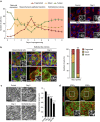
Figure 1
Figure 1. Cell reprogramming induces mitochondrial fission.
(a) MEFs were mock-infected (day 0, control) or OSKM-transduced. At the indicated days, cells were fixed and mitochondrial morphology assessed by IF. (right) IF images of MEFs stained with anti-Tom20 antibody (red) before (control) or after expressing the OSKM factors for the indicated days. Insets show a black and white magnification of the pictures. DAPI (blue) was used as a nuclear counterstaining. Scale bar, 24 μm. Graph on the left, quantification of the different mitochondrial morphologies observed in MEFs before (day 0) or at the indicated days after OSKM expression (n=3). Shaded areas depict the timing for MET (orange) and the appearing of epithelial-like colonies (pink). (b) IF images of mesenchymal cells (scale bar, 24 μm (leftmost)) or epithelial-like colonies (scale bar, 16 μm (middle); scale bar, 16 μm (right)) found in the cultures at the indicated days of reprogramming showing F-actin and mitochondria stainings. Middle and right lower images are a magnification of the indicated area in the respective upper panels. Scale bar, 8 μm. Insets show a black and white magnification of the pictures. DAPI (blue) was used as a nuclear counterstaining. Graph on the right, quantification of the indicated mitochondrial morphologies observed in the mesenchymal cells (Mes) or epithelial-like colonies (Epi-like) at day 8 of reprogramming (n=3). (c) TEM micrographs of MEFs before (control) or at the indicated days after OSKM expression, or epithelial-like colony (Epi-like) at day eight of reprogramming, displaying the ultrastructural characteristics of their mitochondria. Scale bar, 800 nm. Graph on the right, quantification of the mitochondrial length observed in the indicated cells (n⩾800). (d) IF images of pluripotent cells stained with anti-Oct4 (green) and anti-Tom20 antibodies (red). Insets below are a black and white magnification of the pictures illustrating mitochondrial morphologies. Scale bar, 40 μm (upper); scale bar, 16 μm (lower), respectively. Data are represented as mean±s.e.m.(*P<0.05, **P<0.01, ***P<0.001, ****P<0.0001). One-tailed unpaired Student's t-test was used to compare data sets.
Figure 2
Figure 2. Mitochondrial fission is associated with cells undergoing reprogramming.
(a) MEFs were mock-infected (control) or transduced with the reprogramming factors. At the indicated days, cells were fixed and Thy1 expression and mitochondrial morphology assessed by IF. (left) Representative confocal images of MEFs stained with anti-Thy1 (yellow) and anti-Tom20 (red) antibodies before (control) or after expressing the OSKM factors for the indicated days. Insets show a black and white magnification of the pictures. DAPI (blue) was used as a nuclear counterstaining. Scale bar, 16 μm. Graph on the right shows the quantification of the different mitochondrial morphologies observed in MEFs before (control) or at the indicated days after OSKM expression in the Thy1-positive and -negative cells (n=3). (b) MEFs were mock-infected (control) or transduced with the reprogramming factors. At day 4, cells were sorted as Thy1-positive and -negative. Sorted Thy1-positive and -negative cell populations were further cultured for 8 or 14 days, and epithelial-like and SSEA1-positive colonies were identified by IF analysis using Alexa Fluor 488-Phalloidin and anti-SSEA1 antibody. Graph shows the quantification of epithelial-like and SSEA1-positive colonies found at the indicated days of reprogramming (sorted at day 4) (n=3). (c) Representative confocal images of epithelial-like and SSEA1-positive colonies found in OSKM-transduced MEFs at days 12 and 18 of reprogramming stained with Alexa Fluor 488-Phalloidin (green, to stain F-actin), anti-Tom20 (red, to label mitochondria) and anti-SSEA1 (violet, to label pluripotent colonies) antibodies. (lower) Higher magnifications of the indicated area in the respective upper images. Insets in the lower images are a black and white magnification of the pictures to illustrate mitochondrial morphology in colonies. Scale bar, 24 μm (upper); scale bar, 8 μm (lower), respectively. Data are represented as mean±s.e.m. (*P<0.05, **P<0.01, ***P<0.001). One-tailed unpaired Student's t-test was used to compare data sets.
Figure 3
Figure 3. Reprogramming-induced mitochondrial fission follows a Drp1-dependent pathway.
(a) Total RNA was extracted from wild-type MEFs left untreated (control) or OSKM-infected for the indicated days (black bars), or from the indicated pluripotent cells (red bars). The expression of Drp1 gene was then assessed by qPCR and represented as relative gene expression normalized to control MEFs (n=3). (b,d,f) Graphs showing the number of AP-positive colonies obtained after 25 days of retroviral delivery of the OSKM factors in the presence of (b) esiRNA control (esiControl) or esiRNA targeting Drp1 (esiDrp1), (d) Drp1 wild-type (Drp1WT) or the catalytically inactive K38A mutation (Drp1K38A) or (f) the Drp1 inhibitor Mdivi-1 (50 μM) (n=6). (right) Representative bright-field images from the plates of the indicated cultures after AP-staining. Insets show a magnification of a selected area from the AP-stained plates. (c,e) Representative confocal images of MEFs expressing the reprogramming factors during 4 days in the presence of the indicated (c) esiRNAs or (e) Drp1 constructs and stained with anti-Tom20 antibody (red) to assess the indicated mitochondrial morphologies. Insets show a black and white magnification of the pictures. DAPI (blue) was used as a nuclear counterstaining. Scale bars, 24 μm. Graphs on the right of the images show the quantification of the indicated mitochondrial morphologies observed in cells treated as above (n=3) Data are represented as mean±s.e.m. (**P<0.01, ***P<0.001, ****P<0.0001). One-tailed unpaired Student's t-test was used to compare data sets. qPCR, quantitative PCR.
Figure 4
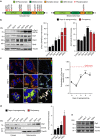
Figure 4. OSKM-induced Drp1 phosphorylation at serine 579.
(a) Diagram depicting the identified phosphorylated residues in cytosolic- (left) or mitochondria- (right) associated Drp1 in self-renewing ES cells by LC-MS/MS. (b) Lysates of mock- or OSKM-transduced MEFs for the indicated days, or the specified pluripotent cells were analysed by immunoblotting using the indicated antibodies. Graphs on the right show the quantification of the indicated ratios (n=3). (c) Representative confocal images of MEFs before (control, upper) or 4 days after OSKM expression (day 4, middle), or ES cells (ESCs, lower) stained with anti-Drp1 (green) or anti-Tom20 (red) antibodies. DAPI (blue) was used as a nuclear counterstaining. (middle) Magnification of the pictures on the left. Rightmost pictures are colour map representations of the pictures in the middle panels to display colocalized pixels between both fluorophores according to the displayed colour bar. Warm colours depict pixels with highly correlated intensity and spatial overlap while cold colours are indicative of random or anti-correlation. Scale bars, 24 μm (left); scale bar, 12 μm (middle); and scale bar, 12 μm (right). Graph on the right shows the quantification of the PCC to display the degree of colocalization between Drp1 and Tom20 at the indicated days of reprogramming. Red dashed line indicates the levels of Drp1 and Tom20 colocalization found in ES cells (n=3). (d) Cells treated as in b were lysed at the indicated days and fractionated into cytosolic or mitochondrial subcellular fractions. Then, subcellular fractions were subjected to immunoblotting analysis using the indicated antibodies. Graph shows the quantification of the Drp1/Tom20 co-fractionation ratio in the mitochondrial fraction (n=3). (e) Immunoblot showing the amount of the indicated proteins in total lysates from cells used for subcellular fractionation as control. Data are represented as mean±s.e.m. (*P<0.05, **P<0.01, ***P<0.001, ****P<0.0001). One-tailed unpaired Student's t-test was used to compare data sets. LC-MS/MS, liquid chromatography with tandem mass spectrometry.
Figure 5
Figure 5. Reprogramming-induced mitochondrial fission depends on Erk1/2 phosphorylation of Drp1.
(a) Lysates of mock- or OSKM-transduced MEFs for the indicated days were analysed by immunoblotting using the indicated antibodies. Graphs on the right show the quantification of the indicated ratios (n=3). (b) MEFs were OSKM-transduced and 3 days post-infection cells were treated with DMSO (black bars), as vehicle control, or the MEK1/2 inhibitor PD0325901 (1 μM) (iMek, green bars) for 16 h. Then, cell lysates were prepared and analysed by immunoblotting using the indicated antibodies (left). Graphs on the right show the quantification of the indicated ratios (n=3). (c) (left) Representative confocal images of OSKM-expressing MEFs for 3 days, treated as in b and stained with anti-Tom20 antibody (red) to assess the different mitochondrial morphologies. Insets show a black and white magnification of the pictures. DAPI (blue) was used as a nuclear counterstaining. Scale bars, 24 μm. Graph on the right shows the quantification of the indicated mitochondrial morphologies observed in the cells treated as indicated (n=3). (d) (left) Representative confocal images of MEFs expressing the reprogramming factors, together with Drp1 wild type (Drp1WT) or the phosphomimetic S579D mutation (Drp1S579D), during 4 days. Cells were then treated, fixed and stained as in c. Insets show a black and white magnification of the pictures. DAPI (blue) was used as a nuclear counterstaining. Scale bars, 24 μm. Graph on the right shows the quantification of the indicated mitochondrial morphologies observed in the cells treated as indicated (n=3). Data are represented as mean±s.e.m. (*P<0.05, **P<0.01, ****P<0.0001). One-tailed unpaired Student's t-test was used to compare data sets.
Figure 6
Figure 6. Effect of Dusp6 in cell reprogramming.
(a) Dusp6 gene expression in untreated (control) or OSKM-infected MEFs was assessed by qPCR (n=3). (b) MEFs were transduced with OSKM together with empty vector- or Dusp6-encoding retroviruses. Four days after, cell lysates were prepared and analysed by immunoblotting using the indicated antibodies. Graphs on the right show the quantification of the data (n=3). (c) (left) IF images of MEFs transduced as in b and stained with anti-Tom20 antibody (red) 4 days post infection to assess the different mitochondrial morphologies. Insets show a black and white magnification of the pictures. DAPI (blue) was used as a nuclear counterstaining. Scale bars, 24 μm. Graph on the right shows the quantification of the observed mitochondrial morphologies in the cells (n=3). (d) (left) IF images of MEFs co-expressing the reprogramming factors and Dusp6 together with Drp1 wild type (Drp1WT) or the phosphomimetic S579D mutation (Drp1S579D) during 4 days. Cells were then fixed and stained as in c. Insets show a black and white magnification of the pictures. DAPI (blue) was used as a nuclear counterstaining. Scale bars, 24 μm. Graph on the right, quantification of the indicated mitochondrial morphologies observed in the cells (n=3). (e) Graphs showing the number of AP-positive colonies obtained in MEFs after 25 days of retroviral delivery of the OSKM factors either together with empty vector- (control) or Dusp6-encoding retroviruses (Dusp6) (left) or in the presence of DMSO (as vehicle control) or the MEK1/2 inhibitor PD0325901 (1 μM) (iMek) (right) (n=3). Panels in the right, bright-field images from the plates of the indicated cultures after AP-staining. Insets show a magnification of a selected area from the AP-stained plates. Data are represented as mean±s.e.m. (*P<0.05, **P<0.01, ***P<0.001, ****P<0.0001). One-tailed unpaired Student's t-test was used to compare data sets. qPCR, quantitative PCR.
Figure 7
Figure 7. Model.
The illustration depicts the role of ERK signalling in activating Drp1 through its phosphorylation at S579 during early reprogramming. The role of Dusp6 downregulation by reprogramming factors in activating ERK signalling during early reprogramming is also displayed.

Similar articles

Cited by

References

    1. Takahashi K. & Yamanaka S. Induction of pluripotent stem cells from mouse embryonic and adult fibroblast cultures by defined factors. Cell 126, 663–676 (2006). - PubMed
    1. Okita K., Ichisaka T. & Yamanaka S. Generation of germline-competent induced pluripotent stem cells. Nature 448, 313–317 (2007). - PubMed
    1. Stadtfeld M. & Hochedlinger K. Induced pluripotency: history, mechanisms, and applications. Genes Dev. 24, 2239–2263 (2010). - PMC - PubMed
    1. Plath K. & Lowry W. E. Progress in understanding reprogramming to the induced pluripotent state. Nat. Rev. Genet. 12, 253–265 (2011). - PMC - PubMed
    1. Apostolou E. & Hochedlinger K. Chromatin dynamics during cellular reprogramming. Nature 502, 462–471 (2013). - PMC - PubMed

Publication types

MeSH terms

LinkOut - more resources