

Cutting Edge: BAFF Promotes Autoantibody Production via TACI-Dependent Activation of Transitional B Cells
- PMID: 27022196
- PMCID: PMC4868625
- DOI: 10.4049/jimmunol.1600017
Cutting Edge: BAFF Promotes Autoantibody Production via TACI-Dependent Activation of Transitional B Cells
Abstract
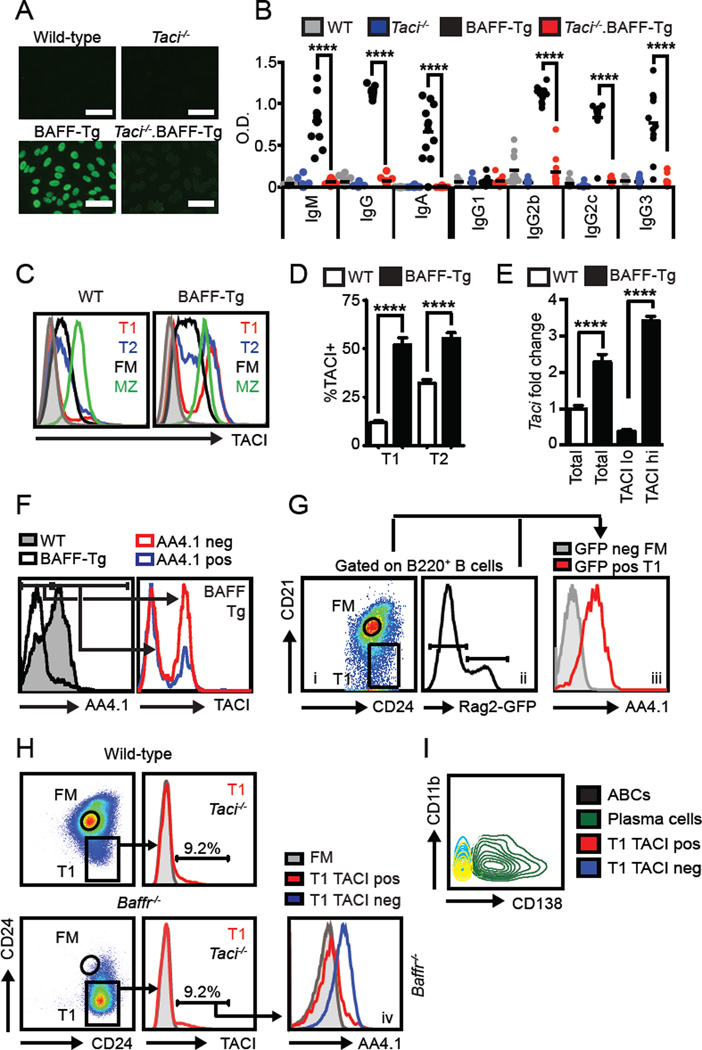
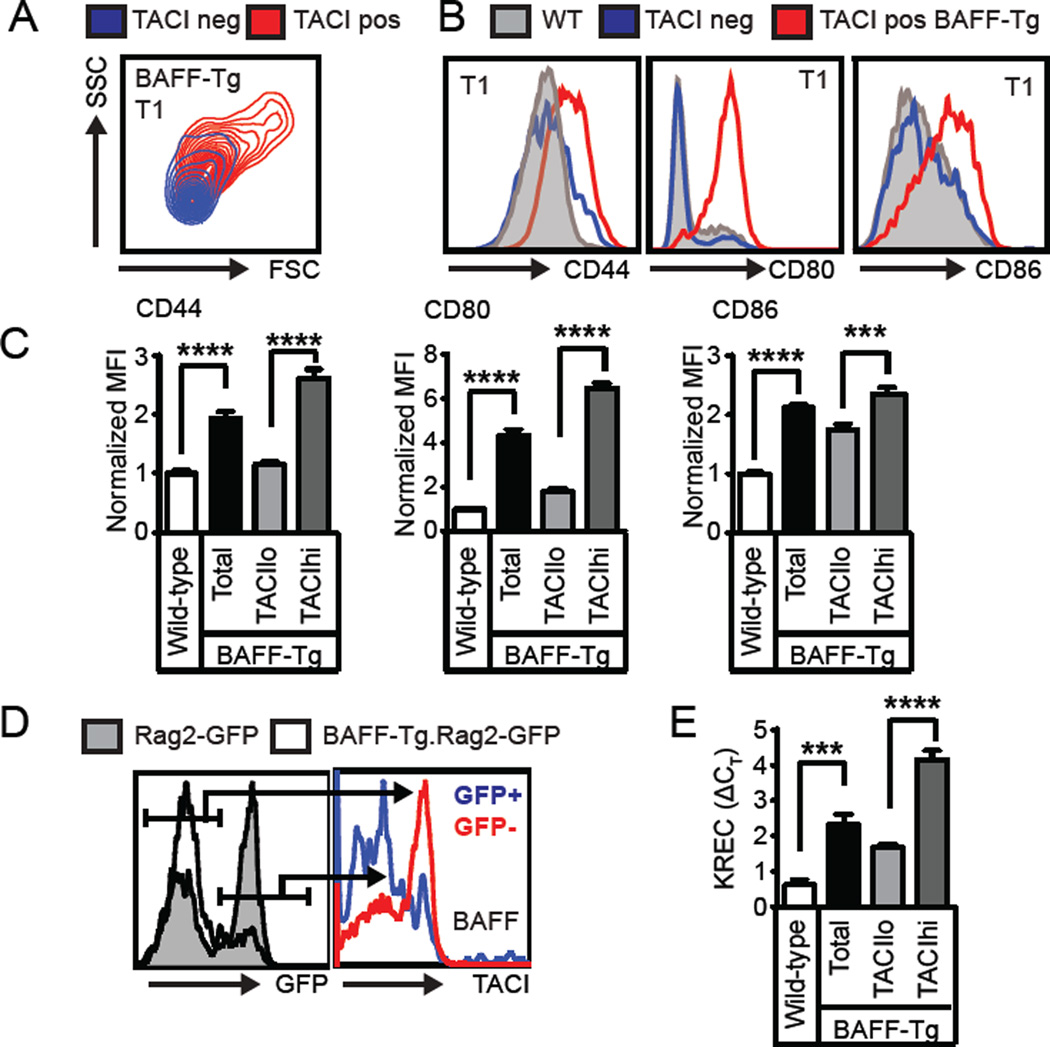
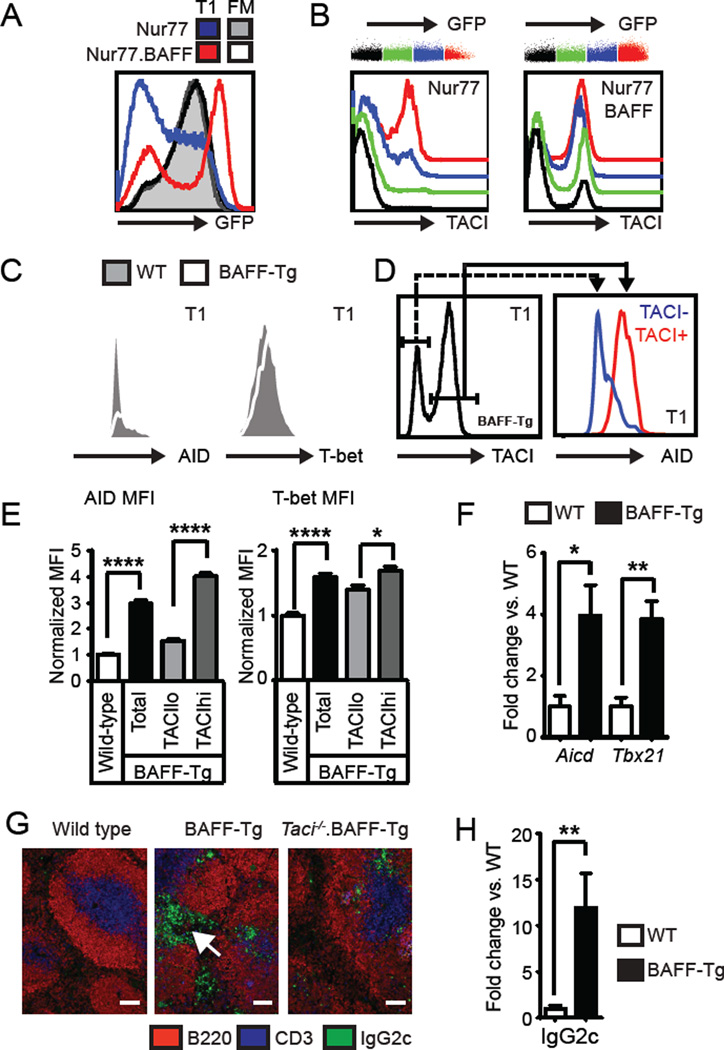
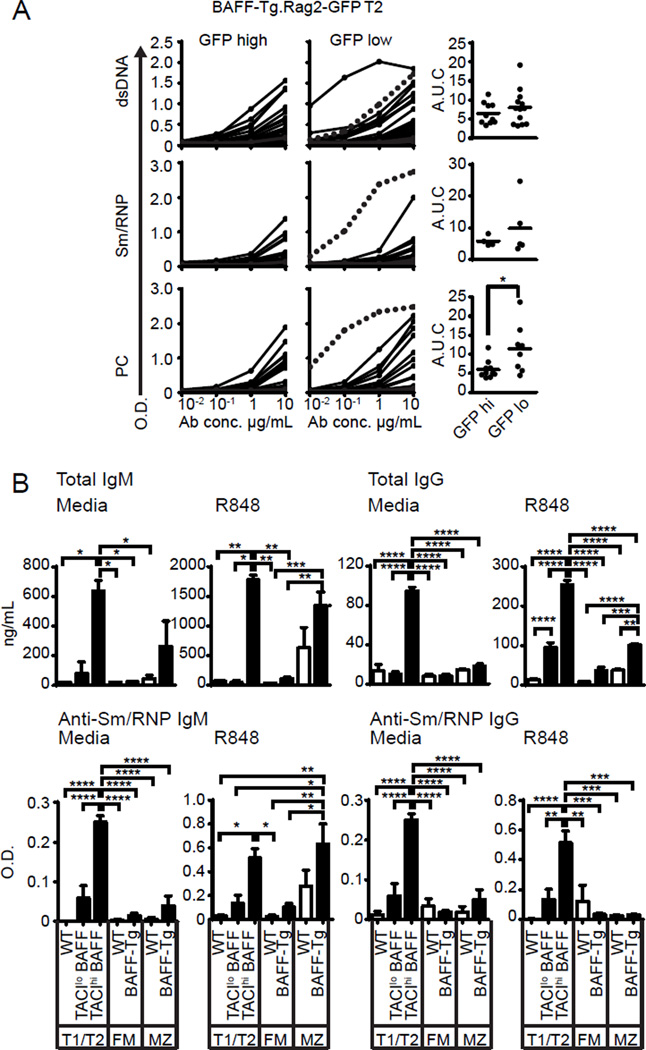
Mice overexpressing B cell activating factor of the TNF family (BAFF) develop systemic autoimmunity characterized by class-switched anti-nuclear Abs. Transmembrane activator and CAML interactor (TACI) signals are critical for BAFF-mediated autoimmunity, but the B cell developmental subsets undergoing TACI-dependent activation in settings of excess BAFF remain unclear. We report that, although surface TACI expression is usually limited to mature B cells, excess BAFF promotes the expansion of TACI-expressing transitional B cells. TACI(+) transitional cells from BAFF-transgenic mice are characterized by an activated, cycling phenotype, and the TACI(+) cell subset is specifically enriched for autoreactivity, expresses activation-induced cytidine deaminase and T-bet, and exhibits evidence of somatic hypermutation. Consistent with a potential contribution to BAFF-mediated humoral autoimmunity, TACI(+) transitional B cells from BAFF-transgenic mice spontaneously produce class-switched autoantibodies ex vivo. These combined findings highlight a novel mechanism through which BAFF promotes humoral autoimmunity via direct, TACI-dependent activation of transitional B cells.
Copyright © 2016 by The American Association of Immunologists, Inc.
Conflict of interest statement
The authors have declared that no conflict of interest exists
Figures
Similar articles
-
Integrated B Cell, Toll-like, and BAFF Receptor Signals Promote Autoantibody Production by Transitional B Cells.J Immunol. 2018 Dec 1;201(11):3258-3268. doi: 10.4049/jimmunol.1800393. Epub 2018 Oct 29. J Immunol. 2018. PMID: 30373855 Free PMC article.
-
TACI deletion protects against progressive murine lupus nephritis induced by BAFF overexpression.Kidney Int. 2018 Oct;94(4):728-740. doi: 10.1016/j.kint.2018.03.012. Epub 2018 Jun 12. Kidney Int. 2018. PMID: 29907458 Free PMC article.
-
Cutting Edge: BAFF Overexpression Reduces Atherosclerosis via TACI-Dependent B Cell Activation.J Immunol. 2016 Dec 15;197(12):4529-4534. doi: 10.4049/jimmunol.1601198. Epub 2016 Nov 11. J Immunol. 2016. PMID: 27837104 Free PMC article.
-
BAFF receptor and TACI in B-1b cell maintenance and antibacterial responses.Ann N Y Acad Sci. 2015 Dec;1362:57-67. doi: 10.1111/nyas.12772. Epub 2015 May 11. Ann N Y Acad Sci. 2015. PMID: 25962322 Review.
-
Effect of TACI signaling on humoral immunity and autoimmune diseases.J Immunol Res. 2015;2015:247426. doi: 10.1155/2015/247426. Epub 2015 Mar 17. J Immunol Res. 2015. PMID: 25866827 Free PMC article. Review.
Cited by
-
B cell-activating factor (BAFF) from dendritic cells, monocytes and neutrophils is required for B cell maturation and autoantibody production in SLE-like autoimmune disease.Front Immunol. 2023 Feb 27;14:1050528. doi: 10.3389/fimmu.2023.1050528. eCollection 2023. Front Immunol. 2023. PMID: 36923413 Free PMC article.
-
TLR7 Signaling in Lupus B Cells: New Insights into Synergizing Factors and Downstream Signals.Curr Rheumatol Rep. 2021 Nov 24;23(11):80. doi: 10.1007/s11926-021-01047-1. Curr Rheumatol Rep. 2021. PMID: 34817709 Free PMC article. Review.
-
Altered B cell signalling in autoimmunity.Nat Rev Immunol. 2017 Jul;17(7):421-436. doi: 10.1038/nri.2017.24. Epub 2017 Apr 10. Nat Rev Immunol. 2017. PMID: 28393923 Free PMC article. Review.
-
Protection of mice deficient in mature B cells from West Nile virus infection by passive and active immunization.PLoS Pathog. 2017 Nov 27;13(11):e1006743. doi: 10.1371/journal.ppat.1006743. eCollection 2017 Nov. PLoS Pathog. 2017. PMID: 29176765 Free PMC article.
-
TACI Isoforms Regulate Ligand Binding and Receptor Function.Front Immunol. 2018 Oct 2;9:2125. doi: 10.3389/fimmu.2018.02125. eCollection 2018. Front Immunol. 2018. PMID: 30333819 Free PMC article.
References
-
- Mackay F, Schneider P. Cracking the BAFF code. Nat Rev Immunol. 2009;9:491–502. - PubMed
-
- Thompson JS, Bixler SA, Qian F, Vora K, Scott ML, Cachero TG, Hession C, Schneider P, Sizing ID, Mullen C, Strauch K, Zafari M, Benjamin CD, Tschopp J, Browning JL, Ambrose C. BAFF-R, a newly identified TNF receptor that specifically interacts with BAFF. Science. 2001;293:2108–2111. - PubMed
-
- Figgett WA, Deliyanti D, Fairfax KA, Quah PS, Wilkinson-Berka JL, Mackay F. Deleting the BAFF receptor TACI protects against systemic lupus erythematosus without extensive reduction of B cell numbers. J Autoimmun. 2015 - PubMed
-
- Giltiay NV, Chappell CP, Sun X, Kolhatkar N, Teal TH, Wiedeman AE, Kim J, Tanaka L, Buechler MB, Hamerman JA, Imanishi-Kari T, Clark EA, Elkon KB. Overexpression of TLR7 promotes cell-intrinsic expansion and autoantibody production by transitional T1 B cells. J Exp Med. 2013;210:2773–2789. - PMC - PubMed
Publication types
MeSH terms
Substances
Grants and funding
LinkOut - more resources
Full Text Sources
Other Literature Sources
Molecular Biology Databases