Chronic Protein Restriction in Mice Impacts Placental Function and Maternal Body Weight before Fetal Growth
- PMID: 27018791
- PMCID: PMC4809512
- DOI: 10.1371/journal.pone.0152227
Chronic Protein Restriction in Mice Impacts Placental Function and Maternal Body Weight before Fetal Growth
Abstract
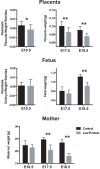
Mechanisms of resource allocation are essential for maternal and fetal survival, particularly when the availability of nutrients is limited. We investigated the responses of feto-placental development to maternal chronic protein malnutrition to test the hypothesis that maternal low protein diet produces differential growth restriction of placental and fetal tissues, and adaptive changes in the placenta that may mitigate impacts on fetal growth. C57BL/6J female mice were fed either a low-protein diet (6% protein) or control isocaloric diet (20% protein). On embryonic days E10.5, 17.5 and 18.5 tissue samples were prepared for morphometric, histological and quantitative RT-PCR analyses, which included markers of trophoblast cell subtypes. Potential endocrine adaptations were assessed by the expression of Prolactin-related hormone genes. In the low protein group, placenta weight was significantly lower at E10.5, followed by reduction of maternal weight at E17.5, while the fetuses became significantly lighter no earlier than at E18.5. Fetal head at E18.5 in the low protein group, though smaller than controls, was larger than expected for body size. The relative size and shape of the cranial vault and the flexion of the cranial base was affected by E17.5 and more severely by E18.5. The junctional zone, a placenta layer rich in endocrine and energy storing glycogen cells, was smaller in low protein placentas as well as the expression of Pcdh12, a marker of glycogen trophoblast cells. Placental hormone gene Prl3a1 was altered in response to low protein diet: expression was elevated at E17.5 when fetuses were still growing normally, but dropped sharply by E18.5 in parallel with the slowing of fetal growth. This model suggests that nutrients are preferentially allocated to sustain fetal and brain growth and suggests the placenta as a nutrient sensor in early gestation with a role in mitigating impacts of poor maternal nutrition on fetal growth.
Conflict of interest statement
Figures


Similar articles
-
Complex patterns of cell growth in the placenta in normal pregnancy and as adaptations to maternal diet restriction.PLoS One. 2020 Jan 9;15(1):e0226735. doi: 10.1371/journal.pone.0226735. eCollection 2020. PLoS One. 2020. PMID: 31917811 Free PMC article.
-
Expression of epigenetic machinery genes is sensitive to maternal obesity and weight loss in relation to fetal growth in mice.Clin Epigenetics. 2016 Feb 27;8:22. doi: 10.1186/s13148-016-0188-3. eCollection 2016. Clin Epigenetics. 2016. PMID: 26925174 Free PMC article.
-
Perfluorooctanoic acid-induced inhibition of placental prolactin-family hormone and fetal growth retardation in mice.Mol Cell Endocrinol. 2011 Apr 30;337(1-2):7-15. doi: 10.1016/j.mce.2011.01.009. Epub 2011 Jan 15. Mol Cell Endocrinol. 2011. PMID: 21241770
-
Nutritionally mediated placental growth restriction in the growing adolescent: consequences for the fetus.Biol Reprod. 2004 Oct;71(4):1055-62. doi: 10.1095/biolreprod.104.030965. Epub 2004 Jun 16. Biol Reprod. 2004. PMID: 15201203 Review.
-
Review: The placenta and developmental programming: balancing fetal nutrient demands with maternal resource allocation.Placenta. 2012 Feb;33 Suppl:S23-7. doi: 10.1016/j.placenta.2011.11.013. Epub 2011 Dec 10. Placenta. 2012. PMID: 22154688 Review.
Cited by
-
The maternal microbiome promotes placental development in mice.Sci Adv. 2023 Oct 6;9(40):eadk1887. doi: 10.1126/sciadv.adk1887. Epub 2023 Oct 6. Sci Adv. 2023. PMID: 37801498 Free PMC article.
-
Morphological correspondence between brain and endocranial surfaces in mice exposed to undernutrition during development.J Anat. 2022 Jul;241(1):1-12. doi: 10.1111/joa.13639. Epub 2022 Feb 7. J Anat. 2022. PMID: 35132617 Free PMC article.
-
A Nutrient-Sensing Transition at Birth Triggers Glucose-Responsive Insulin Secretion.Cell Metab. 2020 May 5;31(5):1004-1016.e5. doi: 10.1016/j.cmet.2020.04.004. Cell Metab. 2020. PMID: 32375022 Free PMC article.
-
Obesogenic diet in mice compromises maternal metabolic physiology and lactation ability leading to reductions in neonatal viability.Acta Physiol (Oxf). 2022 Oct;236(2):e13861. doi: 10.1111/apha.13861. Epub 2022 Aug 3. Acta Physiol (Oxf). 2022. PMID: 35880402 Free PMC article.
-
Maternal Macronutrient Consumption and the Developmental Origins of Metabolic Disease in the Offspring.Int J Mol Sci. 2017 Jul 6;18(7):1451. doi: 10.3390/ijms18071451. Int J Mol Sci. 2017. PMID: 28684678 Free PMC article. Review.
References
-
- Prada JA, Tsang RC. Biological mechanisms of environmentally induced causes of IUGR. Eur J Clin Nutr. 1998;52 Suppl 1: S21–7; discussion: S27-8. - PubMed
-
- King JC. Physiology of pregnancy and nutrient metabolism. Am J Clin Nutr. 2000;71: 1218s–1225s. - PubMed
-
- Romo A, Carceller R, Tobajas J. Intrauterine growth retardation (IUGR): epidemiology and etiology. Pediatr Endocrinol Rev 6 Suppl. 2009;3: 332–336. - PubMed
-
- Schell LM, Magnus PD. Is there an elephant in the room? Addressing rival approaches to the interpretation of growth perturbations and small size. Am J Hum Biol. 2007;19: 606–614. - PubMed
Publication types
MeSH terms
Substances
Grants and funding
LinkOut - more resources
Full Text Sources
Other Literature Sources
Medical
Molecular Biology Databases

