mTOR inhibition as an adjuvant therapy in a metastatic model of HPV+ HNSCC
- PMID: 27015118
- PMCID: PMC5029697
- DOI: 10.18632/oncotarget.8286
mTOR inhibition as an adjuvant therapy in a metastatic model of HPV+ HNSCC
Abstract
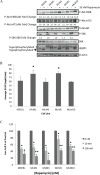
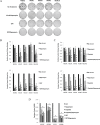
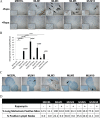
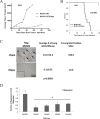
Effective treatments for recurrent/metastatic human papillomavirus-positive (HPV+) head and neck squamous cell cancer (HNSCC) are limited. To aid treatment development, we characterized a novel murine model of recurrent/metastatic HPV+ HNSCC. Further analysis of the parental tumor cell line and its four recurrent/metastatic derivatives led to preclinical testing of an effective treatment option for this otherwise fatal disease. Reverse phase protein arrays identified key signaling cascades in the parental and recurrent/metastatic cell lines. While protein expression profiles differed among the recurrent/metastatic cell lines, activated proteins associated with the mTOR signaling cascade were a commonality. Based on these data, mTOR inhibition was evaluated as an adjuvant treatment for recurrent/metastatic disease. mTOR activity and treatment response were assessed in vitro by western blot, Seahorse, proliferation, clonogenic, and migration assays. Standard-of-care cisplatin/radiation therapy (CRT) versus CRT/rapamycin were compared in vivo. Low-dose rapamycin inhibited mTOR signaling, decreasing proliferation (43%) and migration (62%) while it enhanced CRT-induced cytotoxicity (3.3 fold) in clonogenic assays. Furthermore, rapamycin re-sensitized CRT-resistant, metastatic tumors to treatment in vivo, improving long-term cures (0-30% improved to 78-100%, depending on the recurrent/metastatic cell line) and limiting lymph node metastasis (32%) and lung metastatic burden (30 fold). Studies using immune compromised mice suggested rapamycin's effect on metastasis is independent of the adaptive immune response. These data suggest a role of mTOR activation in HPV+ HNSCC recurrent/metastatic disease and that adjuvant mTOR inhibition may enhance treatment of resistant, metastatic cell populations at the primary site and limit distant metastasis.
Keywords: head and neck oral cancer; human papillomavirus; mTOR; metastasis; rapamycin.
Conflict of interest statement
The authors report no financial or other conflicts of interest relevant to the subject of this article.
Figures


Similar articles
-
Improved clearance during treatment of HPV-positive head and neck cancer through mTOR inhibition.Neoplasia. 2013 Jun;15(6):620-30. doi: 10.1593/neo.13432. Neoplasia. 2013. PMID: 23730210 Free PMC article.
-
Metastatic model of HPV+ oropharyngeal squamous cell carcinoma demonstrates heterogeneity in tumor metastasis.Oncotarget. 2016 Apr 26;7(17):24194-207. doi: 10.18632/oncotarget.8254. Oncotarget. 2016. PMID: 27013584 Free PMC article.
-
mTOR as a molecular target in HPV-associated oral and cervical squamous carcinomas.Clin Cancer Res. 2012 May 1;18(9):2558-68. doi: 10.1158/1078-0432.CCR-11-2824. Epub 2012 Mar 12. Clin Cancer Res. 2012. PMID: 22409888 Free PMC article.
-
Systemic Treatment in HPV-Induced Recurrent or Metastatic HNSCC.Recent Results Cancer Res. 2017;206:149-160. doi: 10.1007/978-3-319-43580-0_11. Recent Results Cancer Res. 2017. PMID: 27699536 Review.
-
Molecularly targeted agents and immunotherapy for the treatment of head and neck squamous cell cancer (HNSCC).Discov Med. 2016 Jun;21(118):507-16. Discov Med. 2016. PMID: 27448787 Review.
Cited by
-
Impact of HPV infection on oral squamous cell carcinoma.Oncotarget. 2016 Nov 22;7(47):76704-76712. doi: 10.18632/oncotarget.12501. Oncotarget. 2016. PMID: 27732948 Free PMC article.
-
mTOR, metabolism, and the immune response in HPV-positive head and neck squamous cell cancer.World J Otorhinolaryngol Head Neck Surg. 2016 Jul 20;2(2):76-83. doi: 10.1016/j.wjorl.2016.05.010. eCollection 2016 Jun. World J Otorhinolaryngol Head Neck Surg. 2016. PMID: 29204551 Free PMC article. Review.
-
Neuroimmune mechanisms of behavioral alterations in a syngeneic murine model of human papilloma virus-related head and neck cancer.Psychoneuroendocrinology. 2017 May;79:59-66. doi: 10.1016/j.psyneuen.2017.02.006. Epub 2017 Feb 11. Psychoneuroendocrinology. 2017. PMID: 28259044 Free PMC article.
-
Mouse Models for Studying Oral Cancer: Impact in the Era of Cancer Immunotherapy.J Dent Res. 2018 Jun;97(6):683-690. doi: 10.1177/0022034518767635. Epub 2018 Apr 12. J Dent Res. 2018. PMID: 29649368 Free PMC article. Review.
-
mTOR Signaling in Cancer and mTOR Inhibitors in Solid Tumor Targeting Therapy.Int J Mol Sci. 2019 Feb 11;20(3):755. doi: 10.3390/ijms20030755. Int J Mol Sci. 2019. PMID: 30754640 Free PMC article. Review.
References
-
- Leemans CR, Braakhuis BM, Brakenhoff RH. The molecular biology of head and neck cancer. Nat Rev Cancer. 2011;11:9–22. - PubMed
-
- American Cancer Society . Cancer Facts & Figures 2013. American Cancer Society; 2013.
-
- Forastiere AA. Management of advanced stage squamous cell carcinoma of the head and neck. Am J Med Sci. 1986;291:405–15. - PubMed
MeSH terms
Substances
Grants and funding
LinkOut - more resources
Full Text Sources
Other Literature Sources
Medical
Research Materials
Miscellaneous

