. 2016 May 15;27(10):1596-605.
doi: 10.1091/mbc.E15-11-0796. Epub 2016 Mar 23.

The novel RacE-binding protein GflB sharpens Ras activity at the leading edge of migrating cells

Affiliations

The novel RacE-binding protein GflB sharpens Ras activity at the leading edge of migrating cells

Hiroshi Senoo et al. Mol Biol Cell. .

Abstract

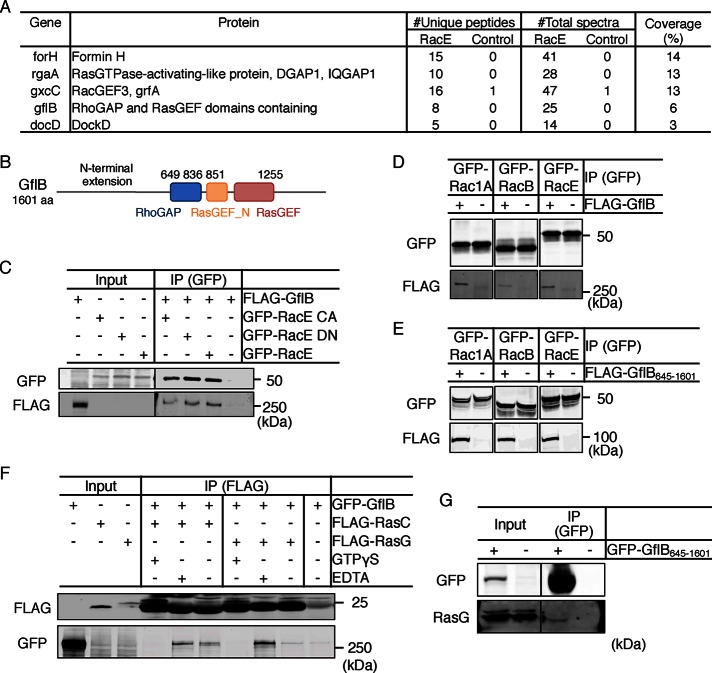
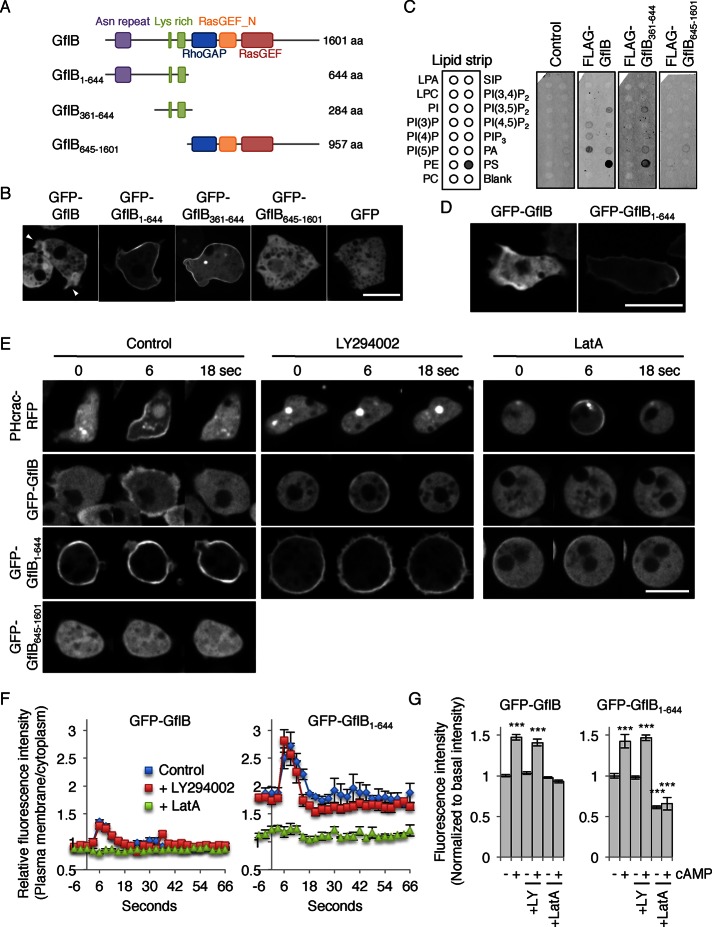
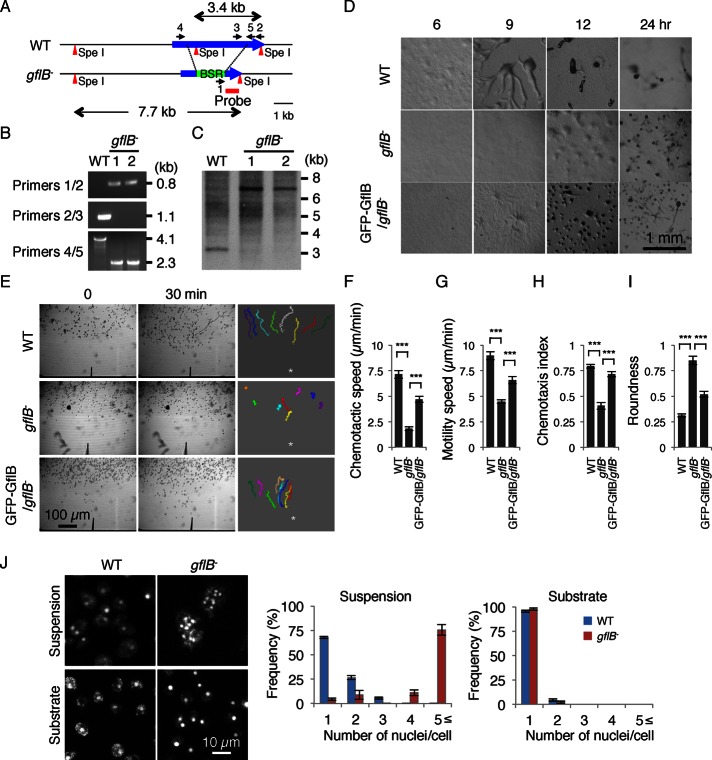
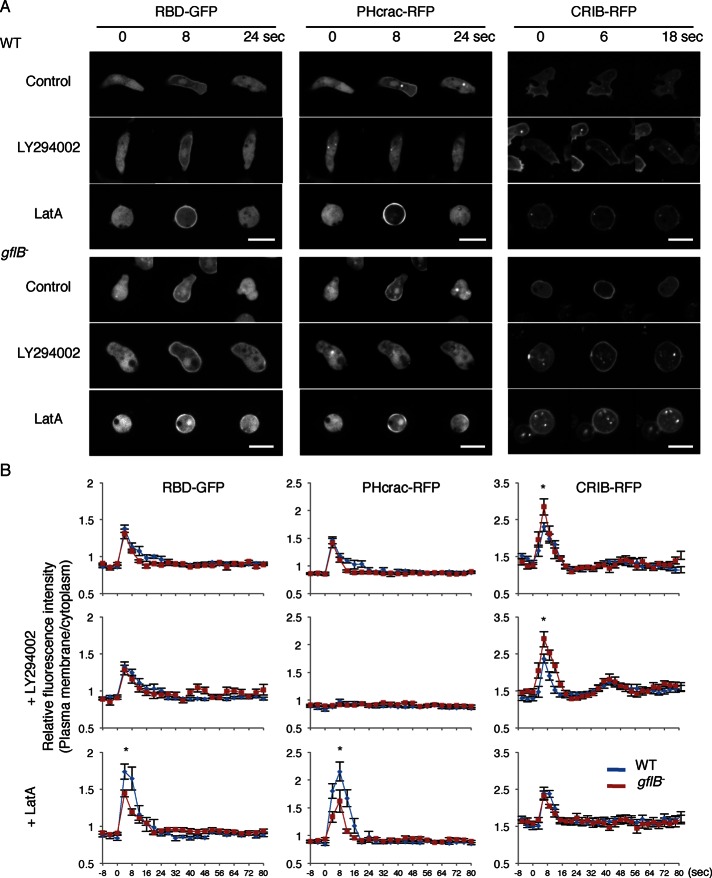
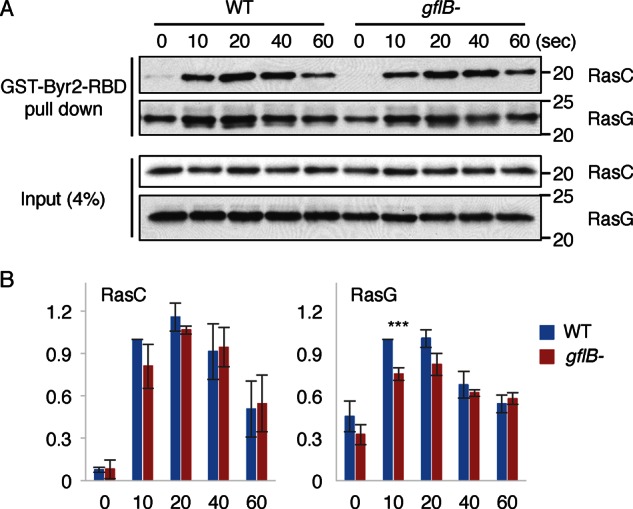
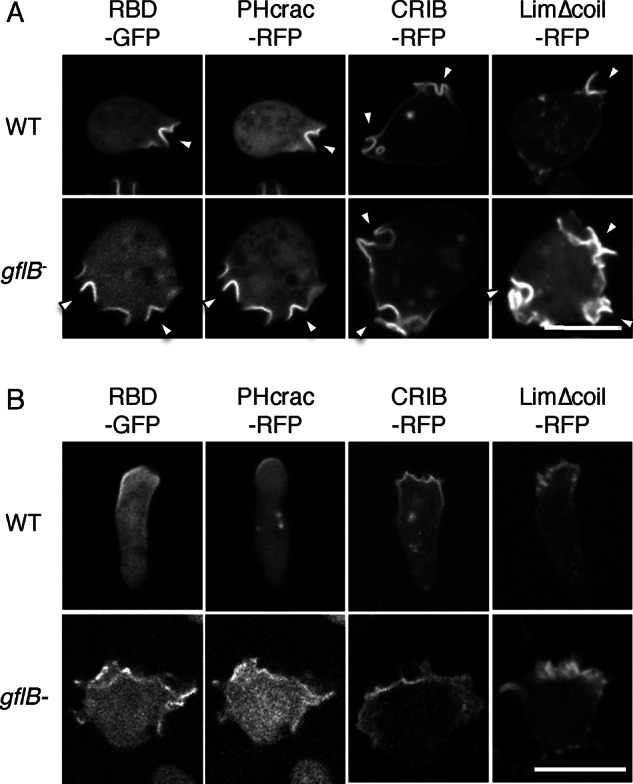
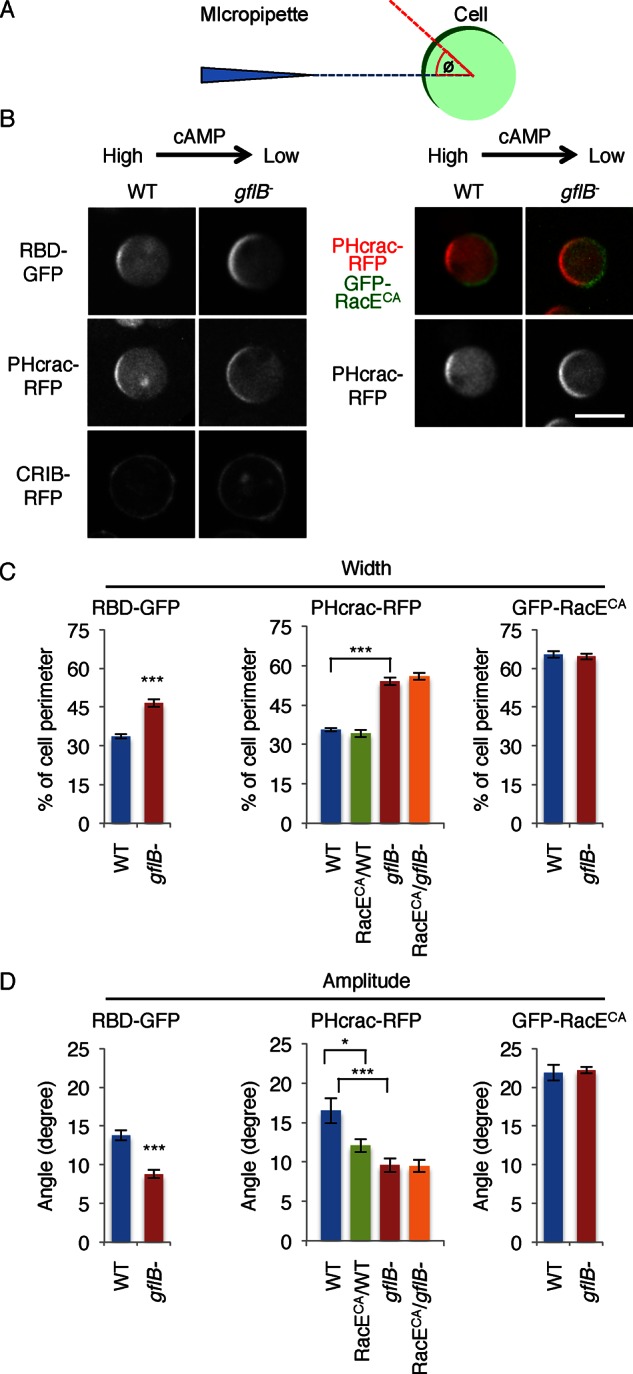
Directional sensing, a process in which cells convert an external chemical gradient into internal signaling events, is essential in chemotaxis. We previously showed that a Rho GTPase, RacE, regulates gradient sensing in Dictyostelium cells. Here, using affinity purification and mass spectrometry, we identify a novel RacE-binding protein, GflB, which contains a Ras GEF domain and a Rho GAP domain. Using biochemical and gene knockout approaches, we show that GflB balances the activation of Ras and Rho GTPases, which enables cells to precisely orient signaling events toward higher concentrations of chemoattractants. Furthermore, we find that GflB is located at the leading edge of migrating cells, and this localization is regulated by the actin cytoskeleton and phosphatidylserine. Our findings provide a new molecular mechanism that connects directional sensing and morphological polarization.


Figures

FIGURE 1:
FIGURE 1:
Identification of GflB as a RacE- and Ras-binding protein. (A) Identified RacE- binding proteins. Number of unique peptides, total number of spectra, and coverage of the proteins by the identified peptides. (B) The domain structure of GflB was analyzed with Prosite. (C) A lysate from Dictyostelium cells expressing FLAG-GflB was incubated with lysates from Dictyostelium cells expressing GFP-RacE, constitutively active GFP-RacEG20V (CA), or dominant-negative GFP-RacET25N (DN). GFP-fusion proteins were pulled down using GFP-Trap beads. The lysates (input) and the pelleted fractions (IP) were analyzed by Western blot with antibodies to GFP and FLAG. (D) A cell lysate expressing FLAG-GflB was incubated with lysates from cells expressing GFP-Rac1A, GFP-RacB, or GFP-RacE. GFP-Trap beads were added to the mixed lysates, and the bound fractions were analyzed by Western blot. +, Presence of FLAG-GflB protein; –, absence of FLAG-GflB protein. (E) Experiments similar to D were performed with a truncated form of GflB (FLAG-GflB645–1601). (F) A cell lysate carrying GFP-GflB was incubated with lysates containing the indicated Ras GTPase in the presence or absence of 50 μM GTPγS or 5 mM EDTA. GFP-Trap beads were added to the mixed lysates, and the bound fractions were analyzed by Western blotting with antibodies to GFP and FLAG. (G) GFP-Trap beads were added to a Dictyostelium cell lysate containing GFP-GflB645–1601, and the bound fractions were analyzed by Western blotting with antibodies to GFP and pan-Ras. The anti–pan-Ras antibody specifically recognizes RasG in Dictyostelium cells (Cai et al., 2010; Chattwood et al., 2014).
FIGURE 2:
FIGURE 2:
GflB is located at the cell periphery in growing cells and the leading edge of chemotaxing cells. (A) GflB constructs used. (B) Growing WT cells expressing the indicated forms of GflB fused to GFP were observed by fluorescence microscopy. Arrowheads indicate pseudopods. Bar, 10 μm. (C) Full-length GflB and its N-terminal extension (amino acids 361–664) bind to phosphatidylserine in a lipid dot blot assay. Nitrocellulose membranes spotted for the indicated lipids were incubated with cell lysates expressing the indicated FLAG-tagged proteins. Protein–lipid interactions were detected using anti-FLAG primary antibodies and fluorescently labeled secondary antibodies. (D) Differentiated WT cells expressing GFP-GflB and GFP-GflB1–644 were placed in a cAMP gradient and viewed by fluorescence microscopy. cAMP gradients were formed from the right side of images. (E) Differentiated WT cells expressing the indicated GFP-fusion proteins were uniformly stimulated with cAMP in the presence or absence of the PI3 kinase inhibitor LY294002 and the actin polymerization inhibitor latrunculin A (LatA). (F, G) Quantification of GFP-GflB and GFP-GflB1–644 localization. GFP intensity at the cell periphery was normalized to GFP intensity in the cytosol; –, basal intensity before addition of cAMP (0 s); +, peak intensity after addition of cAMP (5 s). Values are normalized to the basal intensity and represent the mean ± SEM. At least nine cells were analyzed for each group.
FIGURE 3:
FIGURE 3:
gflB cells are defective in chemotaxis. (A) The gflB was replaced by a blasticidin resistance cassette (BSR). (B) Genomic DNA was analyzed by PCR with primer sets 1/2, 2/3, and 4/5. The primer set 1/2 amplified a 0.8-kb region in gflB cells, whereas the primer 2/3 set amplified a 1.1-kb region in WT cells. The primer set 4/5 amplified a 4.1-kb region in WT cells and a 2.3-kb region in gflB cells. (C) Genomic DNA was digested with the indicated restriction enzymes and analyzed by Southern blotting with a DNA fragment corresponding to the region designated as the probe in A. After digestion with SpeI, a 3.4-kb band was generated from WT cells, whereas a 7.7-kb band was generated from gflB cells, as expected. (D) WT cells, gflB cells, and gflB cells expressing GFP-GflB (GFP-GflB/gflB cells) were plated on nonnutrient DB agar and examined over time for development. (E) Developed WT cells, gflB cells, and GFP-GflB/gflB cells were placed in a chemoattractant gradient generated by a micropipette that releases cAMP and were observed for 20 min by phase contrast microscopy. The cell migration trajectories are shown. The chemotaxis assays were quantified (F–I). (F) Chemotactic speed, calculated as the distance traveled toward the micropipette divided by the elapsed time (20 min). (G) Motility speed, defined as the total distance traveled divided by the elapsed time, determined by measuring the position of a centroid every 30 s for a period of 20 min. (H) Chemotactic index, defined as the distance traveled in the direction of the gradient divided by the total distance traveled in 20 min. (I) Roundness, determined by calculating the ratio of the short axis (As) and long axis (Al) of cells (As/Al). The values represent the mean ± SEM. At least 30 cells were analyzed for each group. (J) DAPI staining shows that gflB cells are multinucleated when cultured in suspension but not on solid substrates. The nuclei per cell were quantified. Values represent mean ± SEM (n = 30).
FIGURE 4:
FIGURE 4:
Alterations in Ras activation, PIP3 production, and Rac activation in response to global chemoattractant stimulation in gflB cells. (A) WT and gflB cells expressing the indicated biosensors were uniformly stimulated with 1 μM cAMP in the presence or absence of 80 μM LY294002 or 5 μM LatA. RBD-GFP and PHcrac-RFP were coexpressed. Cells were observed by time-lapse fluorescence microscopy. Bar, 10 μm. (B) Fluorescence intensity at the cell periphery quantified relative to fluorescence intensity in the cytosol. Values represent the mean ± SEM. At least nine cells were analyzed for each group.
FIGURE 5:
FIGURE 5:
GflB is required for cAMP-stimulated activation of RasG. (A) Dictyostelium cells were lysed at the indicated time points after the addition of cAMP. GST-Byr2-RBD, which binds to active RasC and RasG, was added to the lysates. The GST-fusion protein was pulled down with glutathione-Sepharose beads. The lysates and the bound fractions were analyzed by Western blotting with antibodies to RasC and RasG. (B) Quantification of the band intensities. Values represent the mean ± SEM (n = 3).
FIGURE 6:
FIGURE 6:
GflB spatially organizes PIP3 production and Ras activation in a chemoattractant gradient. (A, B) WT and gflB cells expressing the indicated biosensors examined during growth (A) and during chemotaxis (B) by fluorescence microscopy. RBD-GFP and PHcrac-RFP were cotransfected cells in WT in A and gflB cells in A and B, whereas RBD-GFP and PHcrac-RFP were observed in two different WT cells, as efficiency of cotransfection was relatively low. In B, cAMP gradients were formed from the top of images. RBD-GFP and PHcrac-RFP were coexpressed. Bar, 10 μm.
FIGURE 7:
FIGURE 7:
GflB regulates gradient sensing. (A) The gradient-sensing assay. Cells expressing biosensors were placed in a cAMP gradient in the presence of latrunculin A. To determine the positions of the PHcrac and RBD crescents, the angle Φ was defined by measuring the angle formed by two lines: the line drawn between the centroid of the cell and the center of the crescent (red), and the line drawn between the centroid of the cell and the tip of the micropipette (blue). The edges of each crescent were defined as the points at which the fluorescence intensity on the membrane was 1.5-fold higher than that in the cytoplasm. (B) WT and gflB cells expressing RBD-GFP, PHcrac-RFP, or CRIB-RFP were analyzed in the gradient-sensing assay (left). WT and gflB cells expressing PHcrac-RFP along with GFP-RacEG20V were also analyzed in the gradient-sensing assay (right). GFP-RacEG20V formed a crescent on the side of the cell that faces away from the cAMP gradient (right, green). Images were taken 10–15 min after the cAMP gradient was formed. The cAMP gradient is generated from the right side of cells in each image. (C) The widths of the crescents were quantified. (D) The amplitudes of the lateral movements of the crescents were quantified by calculating the angle Φ as described in A. Values represent the mean ± SEM. More than 30 cells were analyzed for each group.

Similar articles

Cited by

References

    1. Aman A, Piotrowski T. Cell migration during morphogenesis. Dev Biol. 2010;341:20–33. - PubMed
    1. Artemenko Y, Lampert TJ, Devreotes PN. Moving towards a paradigm: common mechanisms of chemotactic signaling in Dictyostelium and mammalian leukocytes. Cell Mol Life Sci. 2014;71:3711–3747. - PMC - PubMed
    1. Bagorda A, Parent CA. Eukaryotic chemotaxis at a glance. J Cell Sci. 2008;121:2621–2624. - PMC - PubMed
    1. Berzat A, Hall A. Cellular responses to extracellular guidance cues. EMBO J. 2010;29:2734–2745. - PMC - PubMed
    1. Bolourani P, Spiegelman GB, Weeks G. Delineation of the roles played by RasG and RasC in cAMP-dependent signal transduction during the early development of Dictyostelium discoideum. Mol Biol Cell. 2006;17:4543–4550. - PMC - PubMed

Publication types

LinkOut - more resources