. 2016 Mar 31;531(7596):661-4.
doi: 10.1038/nature17198. Epub 2016 Mar 23.

β-Arrestin biosensors reveal a rapid, receptor-dependent activation/deactivation cycle

Affiliations

β-Arrestin biosensors reveal a rapid, receptor-dependent activation/deactivation cycle

Susanne Nuber et al. Nature. .

Abstract

(β-)Arrestins are important regulators of G-protein-coupled receptors (GPCRs). They bind to active, phosphorylated GPCRs and thereby shut off 'classical' signalling to G proteins, trigger internalization of GPCRs via interaction with the clathrin machinery and mediate signalling via 'non-classical' pathways. In addition to two visual arrestins that bind to rod and cone photoreceptors (termed arrestin1 and arrestin4), there are only two (non-visual) β-arrestin proteins (β-arrestin1 and β-arrestin2, also termed arrestin2 and arrestin3), which regulate hundreds of different (non-visual) GPCRs. Binding of these proteins to GPCRs usually requires the active form of the receptors plus their phosphorylation by G-protein-coupled receptor kinases (GRKs). The binding of receptors or their carboxy terminus as well as certain truncations induce active conformations of (β-)arrestins that have recently been solved by X-ray crystallography. Here we investigate both the interaction of β-arrestin with GPCRs, and the β-arrestin conformational changes in real time and in living human cells, using a series of fluorescence resonance energy transfer (FRET)-based β-arrestin2 biosensors. We observe receptor-specific patterns of conformational changes in β-arrestin2 that occur rapidly after the receptor-β-arrestin2 interaction. After agonist removal, these changes persist for longer than the direct receptor interaction. Our data indicate a rapid, receptor-type-specific, two-step binding and activation process between GPCRs and β-arrestins. They further indicate that β-arrestins remain active after dissociation from receptors, allowing them to remain at the cell surface and presumably signal independently. Thus, GPCRs trigger a rapid, receptor-specific activation/deactivation cycle of β-arrestins, which permits their active signalling.


Figures
Extended Data Figure 1
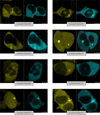
Extended Data Figure 1. Specific labelling of FRET-based β-arrestin2 biosensors in intact cells with FlAsH
HEK293 cells were transfected with one of the CFP-tagged β-arrestin2 biosensors, labelled with FlAsH and analysed by laser scanning microscopy. Confocal images show overlapping intracellular staining in both the CFP (blue) and the FlAsH (yellow) channels.
Extended Data Figure 2
Extended Data Figure 2. Translocation of the β-arrestin2 biosensors
HEK293 cells were transiently transfected with PTH1R–CFP and either wild-type β-arrestin2–YFP or one of the eight β-arrestin2–FlAsH–YFP sensors. a, Increase in membrane fluorescence 10 min after stimulation with 1 µM PTH 1–34 (N-terminal fragment) expressed as percentage increase of the initial fluorescence at t = 0 min. Data represent mean ± s.e.m. values of the indicated number of independent experiments. #P < 0.01 versus no effect (Kruskal–Wallis followed by Mann–Whitney U post-hoc analysis). b, Confocal images of the CFP-tagged PTH1R (left) and wild-type β-arrestin2–YFP (top), or β-arrestin2–FlAsH2–YFP (bottom) before (middle) and 10 min after PTH stimulation (right).
Extended Data Figure 3
Extended Data Figure 3. β-Arrestin-dependent ERK1/2 phosphorylation
HEK293 cells were transiently transfected with the indicated constructs or control vector (pcDNA3; Con) and treated without or with isoproterenol for 10 min (10 µM) as indicated. Cell lysates were analysed for pERK1/2 and ERK1/2 by immunoblot analysis. Data represent mean ± s.e.m., n = 6 independent experiments. *P < 0.05 versus unstimulated samples; #P < 0.05 versus isoproterenol-stimulated control (Kruskal–Wallis followed by Mann–Whitney U post-hoc analysis).
Extended Data Figure 4
Extended Data Figure 4. Conformational changes in the β-arrestin2–FlAsH2 biosensor after FFA4R stimulation
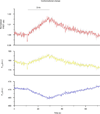
Representative traces of docosahexaenoic acid (DHA)-induced changes in the normalized FRET ratio (FFlAsH/FCFP) and the corresponding CFP (FCFP, cyan) or FlAsH (FFlAsH, yellow) emission recorded from one single HEK293 cell expressing the FFA4R and the FlAsH-labelled β-arrestin2–FlAsH2–CFP sensor. Application of 100 µM DHA is indicated. Representative trace of 10 experiments.
Extended Data Figure 5
Extended Data Figure 5. β-Arrestin-mediated downstream signalling to kinases for M2-muscarinic, β2-adrenergic and FFA4 receptors
HEK293 cells were transfected with β2AR, M2-muscarinic or FFA4 receptors and stimulated with respective agonists at saturating concentrations (isoproterenol, 100 µM; carbachol (CCH), 100 µM; docosahexaenoic acid, 10 µM) for 10 min. β-Arrestin downstream signalling was evaluated by phospho-specific antibodies for pSrc, pERK1/2 and pJNK. Gβ was used as loading control. Data represent mean ± s.e.m. of n = 12 independent experiments. *P < 0.05 versus unstimulated control; #P < 0.05 versus indicated column (Kruskal–Wallis followed by Mann–Whitney U post-hoc analysis).
Extended Data Figure 6
Extended Data Figure 6. Concentration dependency of the kinetics of the conformational changes in β-arrestin upon β2AR stimulation
HEK293 cells were co-transfected with the β2AR and β-arrestin2–FlAsH2–CFP and stimulated with different concentrations of isoproterenol. Kinetics of the agonist evoked intramolecular FRET changes were analysed by curve fitting according to Fig. 2. The bar graph shows the rate constants τ (s) for conformational changes detected with the β-arrestin2–FlAsH2 sensor upon stimulation with 1, 10, 30 or 100 µM isoproterenol, respectively. Data represent mean ± s.e.m. of n ≥ 3 independent experiments. The values are not significantly different (P < 0.05).
Figure 1
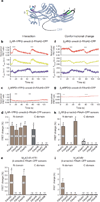
Figure 1. FRET sensors for the β-arrestin2–receptor interaction and receptor-dependent conformational changes in β-arrestin2
a, FRET-based β-arrestin2 biosensors. Schematic representation of the β-arrestin2–FlAsH constructs used in this study derived from the crystal structure (Protein Data Bank (PDB) code 3P2D). CFP was attached C-terminally, and the FlAsH binding motif (CCPGCC) was inserted in different positions. Positions of the FlAsH binding motif are highlighted in the structure and specified in Extended Data Table 1. The sensors were termed β-arrestin2–FlAsH1–8–CFP (abbreviated: FlAsH1–8). bi, Monitoring the β-arrestin2–receptor interaction and receptor-dependent conformational changes in β-arrestin2 by FRET. b, c, f, g, Representative traces of isoproterenol-induced changes in CFP (FCFP, cyan) and YFP or FlAsH (FYFP or FFlAsH, yellow) emissions and the corresponding normalized FRET ratio (FYFP or FFlAsH/FCFP) recorded from a single HEK293 cell expressing either YFP-fused β2AR (b) or β2AR (f) and the FlAsH-labelled β-arrestin2–FlAsH2–CFP. Isoproterenol application (100 µM) is indicated. Intermolecular (c) and intramolecular (g) FRET detected upon stimulation of a phosphorylation-deficient β2AR mutant (β2ARPD) in HEK293 cells co-expressing β-arrestin2–FlAsH2–CFP; these experiments were repeated more then ten times with similarly negative results. d, e, h, i, Quantification of agonist-evoked FRET changes. Shown are maximal FRET changes (percentage) for the interaction of β2AR–YFP (d) or M2AChR–YFP (e) and the β-arrestin2–FlAsH–CFP sensors, or by conformational changes detected with the β-arrestin2 sensors after stimulation of β2AR with 100 µM isoproterenol (h) or M2AChR with 100 µM acetylcholine (i). Data represent mean ± s.e.m., for n independent experiments (biological replicates) as indicated. #P < 0.01 (versus no effect); *P < 0.05 (versus FlAsH2 and FlAsH5).
Figure 2
Figure 2. Kinetics of the interaction of β-arrestin2 with β2AR and its conformational movements
a, Kinetics of the agonist (100 µM isoproterenol)-induced interaction of β-arrestin2–FlAsH2–CFP with β2AR (light grey) and its conformational changes (dark grey). Interaction and conformational changes (inverted to facilitate comparison) were quantified by FRET as in Fig. 1. FRET changes were plotted against time and analysed by exponential fitting to yield time constants (τ). Maximal values were set to 100%. Data represent mean ± s.e.m. of n = 17 (interaction) or 23 (conformational change) independent experiments (biological replicates). b, Bar graph of the time constants for the β2AR-agonist-induced interaction (τ = 1.3 ± 0.17 s) and the conformational changes detected with β-arrestin2–FlAsH2–CFP (τ = 2.2 ± 0.22 s). Data represent mean ± s.e.m. of n = 17 (interaction) or 23 (conformational change) independent experiments (biological replicates). **P < 0.01 (Mann–Whitney U test). c, Kinetics of FRET changes after agonist removal. FRET signals were recorded after termination of exposure to the agonist (100 µM isoproterenol; switch to buffer indicated by blue line). Traces are from a representative experiment showing distinct delays in the intermolecular FRET signal indicating β-arrestin2–receptor dissociation, and the intramolecular FRET signal indicating reversal of the active β-arrestin conformation. The rate constants of the two processes were not different (τ = 22 ± 4.2 s versus 23 ± 2.1 s). d, Bar graph of the delays for the agonist-induced β-arrestin–receptor dissociation (1.9 ± 0.51 s), and the reversal of the β-arrestin2 conformational changes from experiments as shown in c (τ = 4.2 ± 0.85 s). Data represent mean ± s.e.m. of n = 12 independent experiments (biological replicates). *P < 0.05 (Mann–Whitney U test).
Figure 3
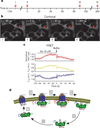
Figure 3. Kinetics of β-arrestin2 translocation between cytosol and cell membrane after β2AR stimulation
a, Timeline of the experimental set up. HEK293 cells co-expressing β-arrestin2–YFP and β2AR were stimulated with isoproterenol (Iso 10 µM) added to the coverslip, followed by washout with a peristaltic pump (flow rate 1.4 ml min−1). Translocation of β-arrestin2–YFP to the cell membrane and subsequent dissociation upon washout were determined by confocal microscopy. Images were taken every 15 s. The experiment is representative of six independent experiments. b, Confocal images before and after ligand addition. I, β-Arrestin2–YFP was diffusely cytosolic before agonist stimulation (t = −90 s). II, Maximal β-arrestin2 translocation to the cell membrane was observed 90 s after isoproterenol addition (t = 0 s; begin of washout). III, β-Arrestin2 movement back to the cytosol occurs after washout, but cell-surface localization is still clearly visible at 90 s after the beginning of washout (t = 90 s). IV, Translocation back to the cytosol is complete after 360 s of washout (t = 360 s). The images are representative of 4 independent experiments (biological replicates). c, Kinetics of the β-arrestin2–β2AR interaction after β2AR stimulation and ligand washout measured by FRET. HEK293 cells were transfected with β2AR–YFP and β-arrestin2–CFP. Isoproterenol (10 µM) was added for 90 s and then washed out as above. Changes in CFP (FCFP, cyan) and YFP (FYFP, yellow) emissions and the corresponding normalized FRET ratio (FYFP/FCFP, red) were recorded from a single HEK293 cell. Note the artefact caused by switching on the pump for washout (t = 0 s). The traces are representative of 7 independent experiments (biological replicates). d, Model of an activation/deactivation and translocation cycle of β-arrestin2. After binding to an active phosphorylated receptor (1), β-arrestin2 adopts an activated conformation (2) that might facilitate fitting to the activated, phosphorylated receptor surface. Parts of C and/or N domain (labelled with FlAsH in our studies) undergo further movements (3) to bring β-arrestin2 into a receptor-specific activated conformation. After agonist removal, β-arrestin2 dissociates from the receptor (4) and remains active for some time (5) before its active state is reversed (6). The major rearrangements in the loops associated with β-arrestin2 activation are schematically illustrated. Structural elements of β-arrestin2 are coloured as follows in each step: N and C domains, green; C-tail, red; FlAsH2, cyan; FlAsH5, blue; FlAsH1, light green; finger, middle and gate loops, light grey.

Similar articles

Cited by

References

    1. Lohse MJ, Hoffmann C. Arrestin interactions with G protein-coupled receptors. Handb. Exp. Pharmacol. 2014;219:15–56. - PubMed
    1. Shukla AK, Xiao K, Lefkowitz RJ. Emerging paradigms of β-arrestin-dependent seven transmembrane receptor signaling. Trends Biochem. Sci. 2011;36:457–469. - PMC - PubMed
    1. Lohse MJ, Benovic JL, Codina J, Caron MG, Lefkowitz RJ. β-Arrestin: a protein that regulates β-adrenergic receptor function. Science. 1990;248:1547–1550. - PubMed
    1. Wilden U, Hall SW, Kühn H. Phosphodiesterase activation by photoexcited rhodopsin is quenched when rhodopsin is phosphorylated and binds the intrinsic 48-kDa protein of rod outer segments. Proc. Natl Acad. Sci. USA. 1986;83:1174–1178. - PMC - PubMed
    1. Goodman OB, et al. β-Arrestin acts as a clathrin adaptor in endocytosis of the β2-adrenergic receptor. Nature. 1996;383:447–450. - PubMed

Publication types

MeSH terms