. 2016 Mar 31;531(7596):604-9.
doi: 10.1038/nature17394. Epub 2016 Mar 23.

Structure of promoter-bound TFIID and model of human pre-initiation complex assembly

Affiliations

Structure of promoter-bound TFIID and model of human pre-initiation complex assembly

Robert K Louder et al. Nature. .

Erratum in

Abstract

The general transcription factor IID (TFIID) plays a central role in the initiation of RNA polymerase II (Pol II)-dependent transcription by nucleating pre-initiation complex (PIC) assembly at the core promoter. TFIID comprises the TATA-binding protein (TBP) and 13 TBP-associated factors (TAF1-13), which specifically interact with a variety of core promoter DNA sequences. Here we present the structure of human TFIID in complex with TFIIA and core promoter DNA, determined by single-particle cryo-electron microscopy at sub-nanometre resolution. All core promoter elements are contacted by subunits of TFIID, with TAF1 and TAF2 mediating major interactions with the downstream promoter. TFIIA bridges the TBP-TATA complex with lobe B of TFIID. We also present the cryo-electron microscopy reconstruction of a fully assembled human TAF-less PIC. Superposition of common elements between the two structures provides novel insights into the general role of TFIID in promoter recognition, PIC assembly, and transcription initiation.


Conflict of interest statement

The authors declare no competing financial interests.

Figures

Extended Data Figure 1
Extended Data Figure 1. Cryo-EM of the TFIID-IIA-SCP complex
a, Representative micrograph of frozen-hydrated TFIID-IIA-SCP complexes. Examples of particle picks are indicated by the green circles. 203,163 such picks were made from 1,253 total micrographs. b, Initial classification and refinement scheme for the TFIID-IIA-SCP structure (see Methods). c, Idealized dose-dependent B-factor plot based on cryo-EM data collected on microtubules under similar imaging conditions. This plot was used for the particle polishing step in b. d, e, Fourier shell correlation plot (d) and local resolution estimation (e) for the final reconstruction shown in b.
Extended Data Figure 2
Extended Data Figure 2. Focused classification and refinement of the promoter-bound BC-core and lobe C of TFIID
a, b, Scheme for focused classification and refinement of the BC-core region (a) or lobe C region of the TFIID-IIA-SCP structure (b) (see Methods). c, d, Fourier shell correlation plots (c) and local resolution estimations (d) of the BC-core and lobe C maps, corresponding to the final structures shown in a and b, respectively. e, Two-dimensional projections of the refined maps for the full TFIID-IIA-SCP structure (left), locally-refined BC-core map (middle), and locally-refined lobe C map (right). The maps used to calculate the projections are the same as the final structures in a, b, and Extended Data Fig. 1b, except that all have been low-pass filtered to 10 Å before calculating projections. f, 3D-classification of 56,457 particles into two classes (solid blue and transparent green), following focused alignment to the lobe C region of the structure. The resulting classes have been superposed through their lobe C densities in order to illustrate the flexibility of lobe B and the upstream region of promoter DNA relative to lobe C and the downstream promoter region. The magnitude of motion within lobe A1 (20 Å) is indicated.
Extended Data Figure 3
Extended Data Figure 3. Modelling of TBP, TFIIA, and promoter DNA into the cryo-EM density
a, Previously published reconstructions of TFIID-IIA-SCP in the rearranged state (left; EMDB code 2282) and of free TFIID in the canonical state (right; EMDB code 2287) . For the former, the densities for TFIIA (orange) and TBP (red) are assigned based on the superposition with the TFIID-IIA-SCP structure from our present study. b, Close-up view of the TBP-TFIIA-TATA module density and fitted structures. The termini of the TBP structure and the three subunits (α, β, and γ) within the TFIIA structure are indicated with circles. In the cell, the α and β subunits of TFIIA are translated as a single polypeptide and then are post-translationally cleaved. The location of the long stretch of residues spanning the region between the structured parts of TFIIAα and TFIIAβ (TFIIAαβ 52–329) is indicated as a dashed line. Note that only 34 of the residues within this flexible loop (52–58 and 303–329) are included in the TFIIA construct used for this study. Mutational analysis in yeast has shown that mutation of an isoleucine residue (I23 in humans, I27 in yeast; represented in green spheres) to lysine at the tip of the TFIIA four-helix bundle disrupts the interaction between TFIID and TFIIA. c, Mapping of the MPE.Fe(II) cleavage pattern for SCP DNA bound to TFIID-IIA, based on data published in Cianfrocco, et al. (2013). d, Mapping of the downstream core element (DCE) sequence onto the SCP DNA within the TFIID-IIA-SCP structure from our present study.
Extended Data Figure 4
Extended Data Figure 4. Structural modeling and conservation of the TAF1 promoter binding domains
a, TAF1 WH domain (grey) in complex with promoter DNA (cyan) superposed with the DNA-binding WH domain of the transcription factor E2F4 (PDB code 1CF7, magenta) in complex with its cognate DNA, with the alignment based on the protein (left) or DNA (right) components. b, Sequence alignment and secondary structure map of the TAF1 WH domain, used to calculate the conservation scores depicted in Fig. 2c (Hs, H. sapiens; Dr, D. rerio; Dm, D. melanogaster; Ce, Caenorhabditis elegans; At, A. thaliana; Sp, S. pombe; Sc, S. cerevisiae). The conserved positively charged residues that are in close proximity to the promoter DNA within the docked structure (K818, R864, K865, K868, and R875) are highlighted in pink. Numbering is based on the human sequence. c, Sequence alignment of a region of the TAF1 DUF3591 corresponding to the internal segment that is missing from the crystal structure and neighboring residues. The putative Inr-binding domain (1009–1061) within this segment is highlighted in blue. Numbering is based on the human sequence, and abbreviations are the same as in a. d, Three-dimensional structure prediction for the putative TAF1 Inr-binding domain output by the I-TASSER server. On the left, the residues are colored in rainbow from N- to C-terminus, with the terminal residues indicated. On the right, the modelling confidence is depicted in terms of the ResQ score (ribbon color) and B factor estimation (ribbon thickness) output by I-TASSER, with high confidence regions represented by thinner blue ribbon and low confidence regions represented with thicker red ribbon. e, Secondary structure prediction for the sequence modeled in d (H, helix, C, coil).
Extended Data Figure 5
Extended Data Figure 5. Structural modeling and conservation of TAF2 APD
a, Structural arrangement of domains (D1-4) within the TAF2 APD (bottom) compared to that of human ERAP1 (top, PDB code 2YD0), a member of the M1 family of aminopeptidases to which TAF2 shares homology. b, Domain arrangement of TAF2, including the four subdomains of the APD (D1-4), and the C-terminal intrinsically-disordered region (IDR). c, Rigid body docking of the best-conserved domains (D1 and D2) of the homologous human ERAP1 confirm the identity of this density. d, Segmented densities and fitted structures for the four subdomains (D1-4) of the TAF2 APD. e, Sequence alignment and secondary structure map for the putative DNA-binding regions within domain 3 of the TAF2 APD (species abbreviations are the same as in Extended Data Fig. 4a). Conserved residues that are in close proximity to the DNA within the docked structure are highlighted in pink. The stretch that is depicted as a dashed line shares low sequence similarity with known M1 aminopeptidases. Numbering is based on the human sequence.
Extended Data Figure 6
Extended Data Figure 6. Structural modeling and conservation of TAF6 and putative TAF8 density
a, Cryo-EM density of the TAF6 dimer with fitted homology models. Putative regions involved in the homodimer interface are labeled. b, Organization of α-helices within the human TAF6 HEAT-like repeat and unaccounted density (green) around the TAF6 homodimer. c, Sequence alignment and secondary structure map of the TAF6 HEAT repeat domain (species abbreviations are the same as in Extended Data Fig. 4a, except that Al = A. locustae). The green region indicates the region that is unmodeled in our structure, with the two predicted C-terminal helices outlined with dashes. Numbering is based on the human sequence. d, Unaccounted density indicative of two α-helices, located between domain 4 of the TAF2 APD and one copy of the TAF6 HEAT domain, which we attribute to TAF8. e, Sequence alignment of a putative TAF2-interaction domain within TAF8 (species abbreviations are the same as in Extended Data Fig. 4a). The last helix of the structurally determined histone fold domain of TAF8 is depicted in dark blue, while the 26 residue stretch that is predicted to be α-helical is shown in light blue with dashed outline. Secondary structure prediction was performed with PSI-PRED.
Extended Data Figure 7
Extended Data Figure 7. Modeling of the TFIID-based PIC
a, TFIID-based PIC model from Fig. 4, with the density for lobe A2 density (yellow) low-pass filtered to 16 Å and displayed at two different intensity thresholds (lower threshold in transparency). Both thresholds are lower than that used to display the density for the promoter-bound BC-core of TFIID. b, Close-up view of putative interactions between RPB1, -2, and -5 of Pol II and TAF1 of TFIID. c, Comparison of the paths of the promoter DNA within the TFIID-IIA-SCP and TAF-less PIC structures. The promoter DNA from the TFIID-IIA-SCP structure is colored as in Fig. 1, and the promoter DNA from the TAF-less PIC is colored in green. View is from the top of the model, relative to a. d, Docking of the core mediator coactivator complex (cMed, EMDB code 2786), including the mediator head and middle modules, onto the TFIID-based PIC, based on the structure of a cMED-bound initial transcribing complex. e, Docking of the free yeast mediator complex (brown transparency, EMDB code 2634) based on alignment with the core mediator shown in c. Lobe A2 of TFIID (yellow) is depicted similarly as in a.
Figure 1
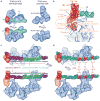
Figure 1. Cryo-EM reconstruction of the TFIID-IIA-SCP complex
a, TFIID-IIA-SCP reconstruction. Isosurfaces are displayed at two thresholds, with the lower one shown in transparency to enable visualization of weaker densities. b, Locally-refined cryo-EM reconstruction of the promoter-bound core of TFIID (i.e., excluding lobe A2). TSS is marked “+1” and the transcription direction by an arrow. c, Close-up view of the TBP-TFIIA promoter-binding module, indicating putative TFIID-interacting regions of TFIIA.
Figure 2
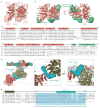
Figure 2. A TAF1-TAF7 subcomplex forms a downstream promoter-binding module
a, Docking of the human TAF1-TAF7 complex (PDB code 4RGW) into the locally-refined lobe C density. Promoter is colored as in Fig. 1. The location of the segmented density in the overall map is highlighted in the lower-left. b, Closeup view of the TAF1 WH domain (dark grey) bound to promoter DNA. c, The TAF1 WH domain with residues colored according to conservation (Extended Data fig. 4a). Conserved positively-charged residues that appear involved in DNA binding are shown as ball-and-sticks. d, Predicted 3D structure for the TAF1 segment spanning residues 1013–1057, docked into the protein density bound to the Inr promoter element. The predicted unstructured linker regions (993–1013 and 1056–1075) are represented as dashed lines. e, Putative interaction between TBP and the TAND of TAF1 within the canonical state of TFIID. The low-resolution reconstruction of TFIID in the canonical state is shown in mesh, superimposed on the new structure of promoter-bound TFIID. The domain organization of human TAF1 is shown at the top (the DUF3591 domain has been localized in this study).
Figure 3
Figure 3. TAF2 APD
a, Homology-based atomic model of the TAF2 APD fitted into the cryo-EM density. Coloring of the promoter DNA is the same as in Fig. 1. The location of the segmented density in the overall map is highlighted in the upper-right. b, Model of the TAF2 APD colored by domain (D1-4), with boundary residues for each domain indicated. c, Close-up of TAF2 APD domain 3 binding to promoter DNA with residues colored according to conservation (see Extended Data Fig. 5e). d, Side view highlighting the TAF1-TAF2 interface, with potential regions of interaction between the two subunits indicated.
Figure 4
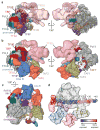
Figure 4. Structural TAFs within lobe C
a, Docking of the crystal structure of A. locustae TAF6C (PDB code 4ATG) into two adjacent densities in the cryo-EM map, termed copy 1 and copy 2. The location of the segmented density in the overall map is highlighted in the schematic in the upper-left. b, The density for the two copies of TAF6C in the improved lobe C map are shown superimposed (left), and the homodimer interface and symmetry operation is depicted using the original map from Fig. 1b (right). c, Location and sequence of the predicted 26 residue helix within the TAF2-interacting domain (2ID) of TAF8. The relative locations of the histone fold domain (HFD) and nuclear localization signal (NLS) are also depicted. d, Docking of the TAF8 26 residue helix between TAF2 APD domain 4 (D4) and TAF6 copy 1 (TAF6.1). e, Overall architecture of TFIID with all fitted atomic models.
Figure 5
Figure 5. Model of the TFIID-based PIC
a, Cryo-EM reconstruction of the human TAF-less PIC, with fitted atomic models. Views are similar to those in Fig. 5a in He, et al. (2013). b, Model of the TFIID-based PIC generated by superimposing the densities for TBP, TFIIA, and promoter DNA within the TFIID-IIA-SCP and TAF-less PIC reconstructions. For clarity, the superimposed densities from the TAF-less PIC reconstruction are hidden. c, Bottom view of the TFIID-based PIC model highlighting putative interactions between TFIID’s lobe B and TFIIF. d, Changes in protein-DNA contacts following the addition of TFIIB-Pol II-TFIIF to the TFIID-IIA-SCP complex, according to data published in Yakovchuk, et al. (2010). The blue to red coloring scale represents the rate constant of change in DNaseI cleavage (kobs) for each base pair following the addition of Pol II-TFIIB-TFIIF, with blue set to −10 × 10−3 s−1, corresponding to regions that become more protected, and red set to +10 × 10−3 s−1, corresponding to regions that become more exposed.

Similar articles

Cited by

References

    1. Levine M, Cattoglio C, Tjian R. Looping Back to Leap Forward: Transcription Enters a New Era. Cell. 2014;157:13–25. - PMC - PubMed
    1. Thomas MC, Chiang CM. The general transcription machinery and general cofactors. Critical reviews in biochemistry and molecular biology. 2006;41:105–178. - PubMed
    1. Buratowski S, Hahn S, Guarente L, Sharp PA. Five intermediate complexes in transcription initiation by RNA polymerase II. Cell. 1989;56:549–561. - PubMed
    1. Burley SK, Roeder RG. Biochemistry and structural biology of transcription factor IID (TFIID) Annual review of biochemistry. 1996;65:769–799. - PubMed
    1. Albright SR, Tjian R. TAFs revisited: more data reveal new twists and confirm old ideas. Gene. 2000;242:1–13. - PubMed

Publication types

MeSH terms

Associated data