. 2016 Nov;9(6):1559-1570.
doi: 10.1038/mi.2016.15. Epub 2016 Mar 23.

Norovirus antagonism of B-cell antigen presentation results in impaired control of acute infection

Affiliations

Norovirus antagonism of B-cell antigen presentation results in impaired control of acute infection

S Zhu et al. Mucosal Immunol. 2016 Nov.

Abstract

Human noroviruses are a leading cause of gastroenteritis, and so, vaccine development is desperately needed. Elucidating viral mechanisms of immune antagonism can provide key insight into designing effective immunization platforms. We recently revealed that B cells are targets of norovirus infection. Because noroviruses can regulate antigen presentation by infected macrophages and B cells can function as antigen-presenting cells, we tested whether noroviruses regulate B-cell-mediated antigen presentation and the biological consequence of such regulation. Indeed, murine noroviruses could prevent B-cell expression of antigen presentation molecules and this directly correlated with impaired control of acute infection. In addition to B cells, acute control required MHC class I molecules, CD8+ T cells, and granzymes, supporting a model whereby B cells act as antigen presenting cells to activate cytotoxic CD8+ T cells. This immune pathway was active prior to the induction of antiviral antibody responses. As in macrophages, the minor structural protein VP2 regulated B-cell antigen presentation in a virus-specific manner. Commensal bacteria were not required for the activation of this pathway and ultimately only B cells were required for the clearance of viral infection. These findings provide new insight into the role of B cells in stimulating antiviral CD8+ T-cell responses.


Figures
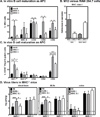
Figure 1
Figure 1. MNV-1, but not MNV-3, induces B cells to upregulate antigen presentation molecules
A) Duplicate wells of M12 cells were inoculated with mock inoculum (black bars), MNV-1 (gray bars), or MNV-3 (white bars) at MOI 5. At 2 dpi, cell were stained with antibodies to MHC I, MHC II, CD40, CD80, and CD86. Flow cytometry was carried out as described in the Methods and isotype control antibodies were used to set gates. The experiment was repeated three times and data from all experimental replicates were averaged. Statistical comparisons were made between mock and each virus strain; and MNV-1 and MNV-3. B) The same experiment described for panel A was repeated two additional times, performing parallel M12 and RAW 264.7 cell infections. RAW 264.7 cells were stained for surface markers at 1 dpi because of the faster viral replication kinetics in this cell line. Data for MHC I levels are presented as the fold-difference in expression on infected cells compared to mock-inoculated cells. The same trend (increased expression on MNV-1-infected M12 cells and MNV-3-infected RAW 264.7 cells) was observed for MHC II, CD40, CD80, and CD86 as well (data not shown). C) Groups (n = 2) of B6 mice were mock-inoculated (black bars) or infected p.o. with 107 TCID50 units MNV-1 (gray bars) or MNV-3 (white bars). At 2 dpi, Peyer’s patches were dissected, pooled for each mouse, and single cell suspensions were generated. Cells were stained for CD19, MHC I, MHC II, CD40, CD80, and CD86 and assessed by flow cytometry. Data are reported as the percentage of CD19+ cells expressing each antigen presentation molecule. The experiment was repeated three times and data from all experimental replicates were averaged. Statistical comparisons were made between mock and each virus strain; and MNV-1 and MNV-3. D) Groups of B6 (black bars), B2M−/− (gray bars), and MHC II−/− (white bars) mice were infected p.o. with 107 TCID50 units MNV-1 or MNV-3, as indicated on the x-axis. At 3 dpi, the indicated tissues were dissected and viral titers were determined by plaque assay. The data are reported as pfu/g of tissue and the data for all mice per group (n = 6–8 mice over three experiments) are averaged. Dashed lines indicate the limit of detection for each tissue. B6 mice were compared to B2M−/− and MHC II−/− strains, and B2M−/− and MHC II−/− were compared to each other, for statistical purposes for each virus strain.
Figure 2
Figure 2. B cells control acute MNV-1, but not MNV-3, infection
Groups of B6 (gray bars) and µMT (white bars) mice were infected p.o. with 107 TCID50 units MNV-1 (A) or MNV-3 (B). At 3, 5, 7, 10 and 14 dpi, the indicated tissues were dissected and virus titers were determined by plaque assay. The data are reported as pfu/g of tissue and the data for all mice per condition (n = 5–9 mice over three experiments) are averaged. Dashed lines indicate the limit of detection for each tissue. The two mouse strains were compared at each time point for each tissue for statistical purposes.
Figure 3
Figure 3. Antiviral antibody responses do not account for B cell-mediated control of MNV-1 infection
Groups of B6 mice were infected p.o. with either 104 TCID50 units (A) or 107 TCID50 units (B) of MNV-1 (black lines) or MNV-3 (gray lines). At 0, 1, 3, 5, 7, 14, 21, and 28 dpi, fecal pellets and serum were collected from each mouse. Virus-specific antibody was detected by standard ELISA using an anti-mouse IgA secondary antibody for fecal lysates, and anti-mouse IgM, IgG, and IgA secondary antibodies for serum samples. The data are reported as the averaged absorbance readings for all mice per condition (n = 6 mice over two experiments) subtracted by the absorbance of samples collected at 0 dpi. The two virus strains were compared at each time point for statistical purposes.
Figure 4
Figure 4. Cytotoxic CD8+ T cells control acute MNV-1, but not MNV-3, infection
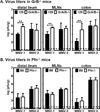
A) Groups of B6 (black bars) and CD8−/− (white bars) mice were infected p.o. with 107 TCID50 units MNV-1 or MNV-3. At 3 dpi, the indicated tissues were dissected and viral titers were determined by plaque assay. The data are reported as pfu/g of tissue and the data for all mice per group (n = 6–8 mice over three experiments) are averaged. Dashed lines indicate the limit of detection for each tissue. The two mouse strains were compared for each tissue and virus strain for statistical purposes. B) Peyer’s patch cell suspensions prepared from groups (n = 2–3) of mock-inoculated B6 mice (black bars), or B6 mice infected p.o. for 3 d with 107 TCID50 units MNV-1 (gray bars) or MNV-3 (white bars), were stained for surface CD8, NK1.1, CD4, or CD19 and intracellular granzyme B (GrB). The experiment was repeated five times for a total of 13 replicates per condition. The data are presented as the percentage of the indicated cell populations expressing GrB in the left panel; no GrB was detected in CD4+ and CD19+ populations (data not shown). The data are presented as total numbers of GrB-producing CD8+ T cells in the right panel. C) Peyer’s patch cell suspensions were stained for surface CD8 and the TCR β chain (as an indication of αβ T cells) or the TCR δ chain (as an indication of γδ T cells), and intracellular GrB. The overall frequencies of αβ and γδ CD8+ T cells expressing GrB are presented in the left panel. The total numbers of the GrB-expressing subsets are presented in the right panel. In panels B and C, the mock group was compared to each virus group, and the two virus groups were compared, for statistical purposes. D) IEL prepared from mock-inoculated (black bars) and MNV-1-infected (gray bars) wild-type B6 and B cell-deficient µMT mice at 3 dpi were stained for surface CD8 and intracellular GrB. The experiment was repeated six times for a total of 6 replicates per condition. The data are presented as the total number of GrB-producing CD8+ IEL per condition. The mock group was compared to the infected group for each mouse strain for statistical purposes.
Figure 5
Figure 5. The control of acute MNV-1 infection requires granzymes but not perforin
A) The same experiment described in Fig. 4A was performed on groups of 129 (black bars) and granzyme A/B−/− (GrA/B−/−; white bars) mice (n = 6 mice per group over two experiments). B) The same experiment as described in Fig. 4A was performed using B6 (black bars) and perforin−/− (Pfn−/−; white bars mice) (n = 6 mice per group over two experiments).
Figure 6
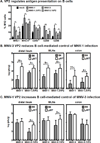
Figure 6. The VP2 protein regulates antigen presentation in B cells and B cell-mediated control of acute MNV-1 infection
A) Duplicate wells of M12 cells were inoculated with mock inoculum (black bars), MNV-1 (dark gray bars), MNV-1.3VP2 (white bars), MNV-3 (hatched bars, vertical lines), or MNV-3.1VP2 (hatched bars, diagonal lines) at MOI 5. At 2 dpi, cell were stained with antibodies to MHC I, MHC II, CD40, CD80, and CD86. Flow cytometry was carried out as described in the Methods and isotype control antibodies were used to set gates. The experiment was repeated three times. For all markers, the data from all experimental replicates are averaged. Statistical comparisons were made between each parental and chimeric pair. B, C) Groups of B6 (gray bars) and µMT (white bars) mice were infected p.o. with 107 TCID50 units MNV-1 or MNV-1.3VP2 (B), or MNV-3 or MNV-3.1VP2 (C). At 3 dpi, the indicated tissues were dissected and viral titers were determined by plaque assay. The data are reported as pfu/g of tissue and the data for all mice per group (n = 5 mice over two experiments) are averaged. Dashed lines indicate the limit of detection for each tissue. The fold-change in averaged virus titers comparing B6 to µMT for each virus strain is indicated above each set of bars.
Figure 7
Figure 7. The B cell-dependent control of acute MNV-1 infection occurs independent of the intestinal microbiota
Groups of B6 (gray bars) and µMT (white bars) mice were orally administered PBS or a cocktail of Abx, as described in the Methods and indicated on the x-axis. Both groups were then infected p.o. with 107 TCID50 units MNV-1. At 3 dpi, the indicated tissues were dissected and viral titers were determined by plaque assay. The data are reported as pfu/g of tissue and the data for all mice per group (n = 8–11 mice over four experiments) are averaged. Dashed lines indicate the limit of detection for each tissue. Statistical comparisons were made between B6 mice and µMT for each condition.
Figure 8
Figure 8. The role of B cells in MNV-1 clearance is independent of CD8+ T cells, B2M, and GrA/B
Groups of B6 (black bars), µMT (dark gray bars), CD8−/− (light gray bars), B2M−/− (white bars), 129 (white hatched bars), and GrA/B−/− (gray hatched bars) mice were infected p.o. with 107 TCID50 units MNV-1. At 14 dpi, the tissues indicated on the x-axis were dissected and viral titers determined by plaque assay. The data are reported as pfu/g of tissue and the data for all mice per group (n = 5 per condition over two experiments) are averaged.

Similar articles

Cited by

References

    1. Koo HL, Neill FH, Estes MK, Munoz FM, Cameron A, Dupont HL, et al. Noroviruses: The Most Common Pediatric Viral Enteric Pathogen at a Large University Hospital After Introduction of Rotavirus Vaccination. J Pediatr Infect Dis Soc. 2013 Mar;2(1):57–60. - PMC - PubMed
    1. Payne DC, Vinjé J, Szilagyi PG, Edwards KM, Staat MA, Weinberg GA, et al. Norovirus and Medically Attended Gastroenteritis in U.S. Children. N Engl J Med. 2013;368(12):1121–1130. - PMC - PubMed
    1. Patel MM. Systematic Literature Review of Role of Noroviruses in Sporadic Gastroenteritis. Emerg Infect Dis. 2008 Aug;14(8):1224–1231. - PMC - PubMed
    1. Ahmed SM, Hall AJ, Robinson AE, Verhoef L, Premkumar P, Parashar UD, et al. Global prevalence of norovirus in cases of gastroenteritis: a systematic review and meta-analysis. Lancet Infect Dis. 2014 Aug;14(8):725–730. - PMC - PubMed
    1. CDC - 2011 Estimates of Foodborne Illness [Internet] 2011 Available from: http://www.cdc.gov/foodborneburden/2011-foodborne-estimates.html.

Publication types

MeSH terms