. 2016 May 13;291(20):10836-46.
doi: 10.1074/jbc.M115.698779. Epub 2016 Mar 21.

Enhancing NAD+ Salvage Pathway Reverts the Toxicity of Primary Astrocytes Expressing Amyotrophic Lateral Sclerosis-linked Mutant Superoxide Dismutase 1 (SOD1)

Affiliations

Enhancing NAD+ Salvage Pathway Reverts the Toxicity of Primary Astrocytes Expressing Amyotrophic Lateral Sclerosis-linked Mutant Superoxide Dismutase 1 (SOD1)

Benjamin A Harlan et al. J Biol Chem. .

Abstract

Nicotinamide adenine dinucleotide (NAD(+)) participates in redox reactions and NAD(+)-dependent signaling pathways. Although the redox reactions are critical for efficient mitochondrial metabolism, they are not accompanied by any net consumption of the nucleotide. On the contrary, NAD(+)-dependent signaling processes lead to its degradation. Three distinct families of enzymes consume NAD(+) as substrate: poly(ADP-ribose) polymerases, ADP-ribosyl cyclases (CD38 and CD157), and sirtuins (SIRT1-7). Because all of the above enzymes generate nicotinamide as a byproduct, mammalian cells have evolved an NAD(+) salvage pathway capable of resynthesizing NAD(+) from nicotinamide. Overexpression of the rate-limiting enzyme in this pathway, nicotinamide phosphoribosyltransferase, increases total and mitochondrial NAD(+) levels in astrocytes. Moreover, targeting nicotinamide phosphoribosyltransferase to the mitochondria also enhances NAD(+) salvage pathway in astrocytes. Supplementation with the NAD(+) precursors nicotinamide mononucleotide and nicotinamide riboside also increases NAD(+) levels in astrocytes. Amyotrophic lateral sclerosis (ALS) is caused by the progressive degeneration of motor neurons in the spinal cord, brain stem, and motor cortex. Superoxide dismutase 1 (SOD1) mutations account for up to 20% of familial ALS and 1-2% of apparently sporadic ALS cases. Primary astrocytes isolated from mutant human superoxide dismutase 1-overexpressing mice as well as human post-mortem ALS spinal cord-derived astrocytes induce motor neuron death in co-culture. Increasing total and mitochondrial NAD(+) content in ALS astrocytes increases oxidative stress resistance and reverts their toxicity toward co-cultured motor neurons. Taken together, our results suggest that enhancing the NAD(+) salvage pathway in astrocytes could be a potential therapeutic target to prevent astrocyte-mediated motor neuron death in ALS.

Keywords: NAD biosynthesis; NAMPT; amyotrophic lateral sclerosis (ALS) (Lou Gehrig disease); astrocyte; mitochondria; oxidative stress.


Figures

FIGURE 1.
FIGURE 1.
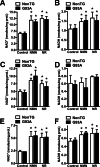
NAD+ precursors increase total and mitochondrial NAD+ content in astrocytes. Primary confluent cortical astrocytes obtained from non-transgenic (NonTG) and hSOD1G93A (G93A) mice were treated with vehicle (control), 5 mm NMN, or 5 mm NR. 24 h later total NAD+ (A), total NADH (B), mitochondrial NAD+ (C), and mitochondrial NADH (D) were determined as described under “Experimental Procedures” and corrected by protein (prot.) content. Primary confluent spinal cord astrocytes from non-transgenic and G93A mice were treated as above, and 24 h later total NAD+ (E) and total NADH (F) were determined and corrected by protein content. Each data bar represents the mean ± S.D. (error bars) of at least three independent experiments. *, significantly different from its respective control (p < 0.05).
FIGURE 2.
FIGURE 2.
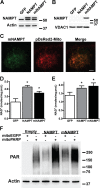
A mitochondrially targeted NAMPT increases total and mitochondrial NAD+ content in astrocytes. Primary confluent spinal cord astrocytes were transfected with adenovirus expressing GFP, NAMPT, or mNAMPT. 48 h post-transfection NAMPT protein levels were determined by Western blotting in whole (A) or purified mitochondrial fractions (B). Actin or VDAC1 levels were used as loading controls. C, micrographs showing co-localization of mNAMPT (anti-DDK antibody; green) and a red fluorescent protein targeted to the mitochondria (pDsRed2-Mito; red) in spinal cord astrocytes co-transfected with vectors coding for mNAMPT and pDsRed2-Mito. Scale bar, 8 μm. Total (D) and mitochondrial (E) NAD+ content in spinal cord astrocyte cultures 48 h after transfection with adenovirus expressing GFP, NAMPT, or mNAMPT was determined. NAD+ was determined as described under “Experimental Procedures” and corrected by protein (prot.) content. Each data bar represents the mean ± S.D. (error bars) of at least three independent experiments. *, significantly different from GFP (p < 0.05). F, increased mitochondrial NAD+ content in HEK293 cells evidenced by PAR polymer accumulation mediated by a mitochondrially targeted PARP1 catalytic domain following co-expression of NAMPT and mNAMPT. HEK293 cells stably transfected with a mitochondrially targeted EGFP (mitoEGFP) or mitoPARP were transient transfected with NAMPT, mNAMPT, or empty plasmids. 24 h post-transfection PAR polymer accumulation was determined by Western blotting. Actin levels were used as a loading control.
FIGURE 3.
FIGURE 3.
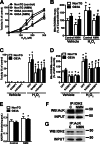
Increasing NAD+ levels confers resistance against hydrogen peroxide toxicity and decreases mitochondrial reactive oxygen species. A, confluent cortical non-transgenic (NonTG) and hSOD1G93A (G93A) astrocyte monolayers were incubated with 5 mm NMN and 24 h later treated with the indicated concentrations of H2O2. Toxicity was assessed by lactate dehydrogenase release 24 h after peroxide treatment. Data are expressed as the percentage of the respective control. B, confluent non-transgenic and hSOD1G93A astrocyte monolayers were incubated with 5 mm NMN for 24 h. Following a change of medium, cultures were treated with H2O2 (300 μm) or vehicle, and 2 h later mitochondrial ROS (Mito ROS) production was determined. Mitochondrial reactive oxygen species was corrected by mitochondrial content (Mito mass). Data are expressed as the percentage of the non-transgenic control. C, confluent non-transgenic and hSOD1G93A astrocyte monolayers were transfected with adenovirus expressing GFP, NAMPT, or mNAMPT. 48 h post-transfection astrocytes were treated with vehicle or H2O2 (300 μm). Toxicity was assessed by lactate dehydrogenase release 24 h after peroxide treatment. Data are expressed as the percentage of their respective controls. D, confluent non-transgenic and hSOD1G93A astrocyte monolayers were transfected with adenovirus expressing GFP, NAMPT, or mNAMPT. 48 h post-transfection astrocytes were treated with H2O2 (300 μm) or vehicle. 2 h after treatment mitochondrial ROS production was determined as indicated above. Data are expressed as the percentage of non-transgenic GFP. For A, B, C, and D, each data point represents the mean ± S.D. (error bars) of at least three independent experiments. *, significantly different from vehicle-treated control/GFP for each respective genotype (p < 0.05). #, significantly different from H2O2-treated control/GFP for each respective genotype (p < 0.05). E, confluent non-transgenic and hSOD1G93A astrocytes were treated with 5 mm NMN, and 24 h later NADPH levels were determined as described under “Experimental Procedures” and corrected by protein (prot.) content. Each data bar represents the mean ± S.D. (error bars) of at least three independent experiments. *, significantly different from its respective control (p < 0.05). F, confluent astrocytes were treated with 5 mm NMN for 24 h. Following protein extraction, IDH2 was immunoprecipitated and analyzed by Western blotting using an antibody against acetylated lysine (AcK). G, lysine-acetylated proteins were immunoprecipitated (IP) and then analyzed by Western blotting using an antibody against IDH2 (WB: IDH2). For both panels, as input control (INPUT), 20 μg of whole protein extracts were analyzed by Western blotting using an antibody against IDH2.
FIGURE 4.
FIGURE 4.
Increasing NAD+ levels decreases basal mitochondrial oxygen consumption rate in astrocytes. A, oxygen consumption rate (OCR) determined for basal conditions in confluent non-transgenic (NonTG) and hSOD1G93A (G93A) spinal cord astrocyte monolayers 24 h after treatment with vehicle (Control) or 5 mm NMN. B, ATP content in confluent non-transgenic and hSOD1G93A spinal cord astrocyte cultures 24 h after treatment with vehicle or 5 mm NMN. C, non-transgenic and hSOD1G93A spinal cord astrocyte cultures were treated with vehicle or 5 mm NMN, and 24 h later the relative mitochondrial to nuclear DNA ratio was estimated by real time PCR using primers specific for cytochrome c oxidase II (COX2) and lipoprotein lipase (LPL). D, relative expression of Ppargc1a, Ppargc1b, Nrf1, and Gabpa mRNA in spinal cord astrocyte cultures 24 h after treatment with 5 mm NMN. mRNA levels were determined by real time PCR and corrected by Actin mRNA levels. For all panels, each data point represents the mean ± S.D. (error bars) of at least three independent experiments. *, significantly different from vehicle treated non-transgenic astrocytes (p < 0.05). prot., protein.
FIGURE 5.
FIGURE 5.
The expression of NAD+ salvage enzymes and NAD+-consuming enzymes in hSOD1G93A astrocytes is not altered. A, mRNA levels of the indicated genes in confluent non-transgenic (NonTG) and hSOD1G93A (G93A) spinal cord astrocyte cultures. Each data bar represents the mean ± S.D. (error bars) of at least three independent experiments. B, SIRT1 and SIRT3 protein levels in non-transgenic and hSOD1G93A astrocytes. Actin levels were used as a loading control. Each lane represents an independent biological replicate. (SIRT1 quantification: non-transgenic, 100 ± 19; hSOD1G93A, 102 ± 11; SIRT3 quantification: non-transgenic: 100 ± 6; hSOD1G93A, 92 ± 7. No significant changes were found.)
FIGURE 6.
FIGURE 6.
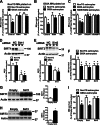
Enhancing NAD+ salvage pathway reverts the toxicity of astrocytes expressing ALS-linked mutant SOD1. A, confluent non-transgenic (NonTG) and hSOD1G93A (G93A) spinal cord astrocyte monolayers were treated with vehicle (Control), 5 mm NMN, or 5 mm NR. 24 h later purified motor neurons from non-transgenic E12.5 mice were plated on top of the astrocyte monolayer. B, the same experimental setup as in A was used, and purified motor neurons from hSOD1G93A E12.5 mice were plated on top of the astrocyte monolayer. For A and B, motor neuron survival was assessed 72 h later. *, significantly different from non-transgenic control (p < 0.05). C, confluent spinal cord astrocyte monolayers obtained from non-transgenic, hSOD1G93A, and hSOD1H46R/H48Q (H46R/H48Q) mice were transfected with adenovirus expressing GFP, NAMPT, or mNAMPT. 24 h later purified motor neurons from non-transgenic E12.5 mice were plated on top of the astrocyte monolayer. Motor neuron survival was assessed 72 h later. *, significantly different from non-transgenic GFP (p < 0.05). D and E, confluent non-transgenic (N) and hSOD1G93A (G) astrocytes were transfected with a negative control (NC), Sirt1, or Sirt3 siRNA, and 48 h later protein levels were determined by Western blotting. Actin levels were used as a loading control. A representative image is presented, and the bottom panels show the quantification of at least three experiments for each siRNA. *, significantly different from non-transgenic negative control (p < 0.05). F, confluent non-transgenic and hSOD1G93A spinal cord astrocytes monolayers were treated as in D and E, and 24 h later purified motor neurons from non-transgenic E12.5 mice were plated on top of the astrocyte monolayer. Motor neuron survival was assessed 72 h later. *, significantly different from non-transgenic negative control (p < 0.05). G and H, confluent hSOD1G93A astrocytes were transfected with plasmids coding for Sirt1, Sirt3, or an empty control plasmid, and 48 h later protein levels were determined by Western blotting. Actin levels were used as a loading control. The right panels show the quantification. To detect endogenous sirtuin expression (empty vector samples), the levels on the overexpressing samples had to be overexposed. Thus, the -fold change is likely underestimated. *, significantly different from empty control (p < 0.05). I, confluent non-transgenic and hSOD1G93A spinal cord astrocyte monolayers were transfected with plasmids coding for Sirt1, Sirt3, or an empty control plasmid, and 24 h later purified motor neurons from non-transgenic E12.5 mice were plated on top of the astrocyte monolayer. *, significantly different from non-transgenic empty (p < 0.05). For all panels, each data bar represents the mean ± S.D. (error bars) of at least three independent experiments.

Similar articles

Cited by

References

    1. Berger F., Ramírez-Hernández M. H., and Ziegler M. (2004) The new life of a centenarian: signalling functions of NAD(P). Trends Biochem. Sci. 29, 111–118 - PubMed
    1. Cantó C., Menzies K. J., and Auwerx J. (2015) NAD+ metabolism and the control of energy homeostasis: a balancing act between mitochondria and the nucleus. Cell Metab. 22, 31–53 - PMC - PubMed
    1. Bai P. (2015) Biology of poly(ADP-ribose) polymerases: the factotums of cell maintenance. Mol. Cell 58, 947–958 - PubMed
    1. Imai S., and Guarente L. (2014) NAD+ and sirtuins in aging and disease. Trends Cell Biol. 24, 464–471 - PMC - PubMed
    1. Aksoy P., White T. A., Thompson M., and Chini E. N. (2006) Regulation of intracellular levels of NAD: a novel role for CD38. Biochem. Biophys. Res. Commun. 345, 1386–1392 - PubMed

Publication types